

Structure-function coupling in highly sampled individual brains
- PMID: 39277800
- PMCID: PMC12098013
- DOI: 10.1093/cercor/bhae361
Structure-function coupling in highly sampled individual brains
Abstract
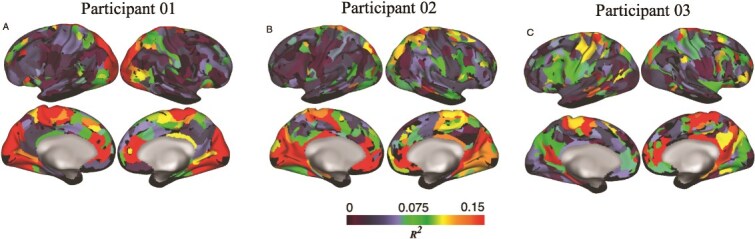
Structural connectivity (SC) between distant regions of the brain support synchronized function known as functional connectivity (FC) and give rise to the large-scale brain networks that enable cognition and behavior. Understanding how SC enables FC is important to understand how injuries to SC may alter brain function and cognition. Previous work evaluating whole-brain SC-FC relationships showed that SC explained FC well in unimodal visual and motor areas, but only weakly in association areas, suggesting a unimodal-heteromodal gradient organization of SC-FC coupling. However, this work was conducted in group-averaged SC/FC data. Thus, it could not account for inter-individual variability in the locations of cortical areas and white matter tracts. We evaluated the correspondence of SC and FC within three highly sampled healthy participants. For each participant, we collected 78 min of diffusion-weighted MRI for SC and 360 min of resting state fMRI for FC. We found that FC was best explained by SC in visual and motor systems, as well as in anterior and posterior cingulate regions. A unimodal-to-heteromodal gradient could not fully explain SC-FC coupling. We conclude that the SC-FC coupling of the anterior-posterior cingulate circuit is more similar to unimodal areas than to heteromodal areas.
Keywords: dense sampling; diffusion imaging; functional imaging; individual; structure–function coupling.
© The Author(s) 2024. Published by Oxford University Press. All rights reserved. For permissions, please e-mail: journals.permissions@oup.com.
Figures


Update of
-
Structure-Function Coupling in Highly Sampled Individual Brains.bioRxiv [Preprint]. 2023 Oct 5:2023.10.04.560909. doi: 10.1101/2023.10.04.560909. bioRxiv. 2023. Update in: Cereb Cortex. 2024 Sep 3;34(9):bhae361. doi: 10.1093/cercor/bhae361. PMID: 37873167 Free PMC article. Updated. Preprint.
References
-
- Alexander-Bloch AF, Vértes PE, Stidd R, Lalonde F, Clasen L, Rapoport J, Gogtay N. The anatomical distance of functional connections predicts brain network topology in health and schizophrenia. Cereb Cortex. 2013:23(1):127–138. https://doi.org/ 10.1093/cercor/bhr388. - DOI - PMC - PubMed
-
- Anderson JC, Martin KA. The synaptic connections between cortical areas V1 and V2 in macaque monkey. J Neurosci. 2009:29(36):11283–11293. https://doi.org/ 10.1523/JNEUROSCI.5757-08.2009. - DOI - PMC - PubMed
-
- Andersson JL, Sotiropoulos SN. An integrated approach to correction for off-resonance effects and subject movement in diffusion MR imaging. NeuroImage. 2016:125:1063–1078. https://doi.org/ 10.1016/j.neuroimage.2015.10.019. - DOI - PMC - PubMed
-
- Baum GL, Cui Z, Roalf DR, Ciric R, Betzel RF, Larsen B, Cieslak M, Cook PA, Xia CH, Moore TM, et al. Development of structure–function coupling in human brain networks during youth. Proc Natl Acad Sci. 2020:117(1):771–778. https://doi.org/ 10.1073/pnas.1912034117. - DOI - PMC - PubMed
Publication types
MeSH terms
Grants and funding
LinkOut - more resources
Full Text Sources
Other Literature Sources
Medical
