

Clustering of clinical symptoms using large language models reveals low diagnostic specificity of proposed alternatives to consensus mast cell activation syndrome criteria
- PMID: 39278360
- PMCID: PMC11700772
- DOI: 10.1016/j.jaci.2024.09.006
Clustering of clinical symptoms using large language models reveals low diagnostic specificity of proposed alternatives to consensus mast cell activation syndrome criteria
Abstract
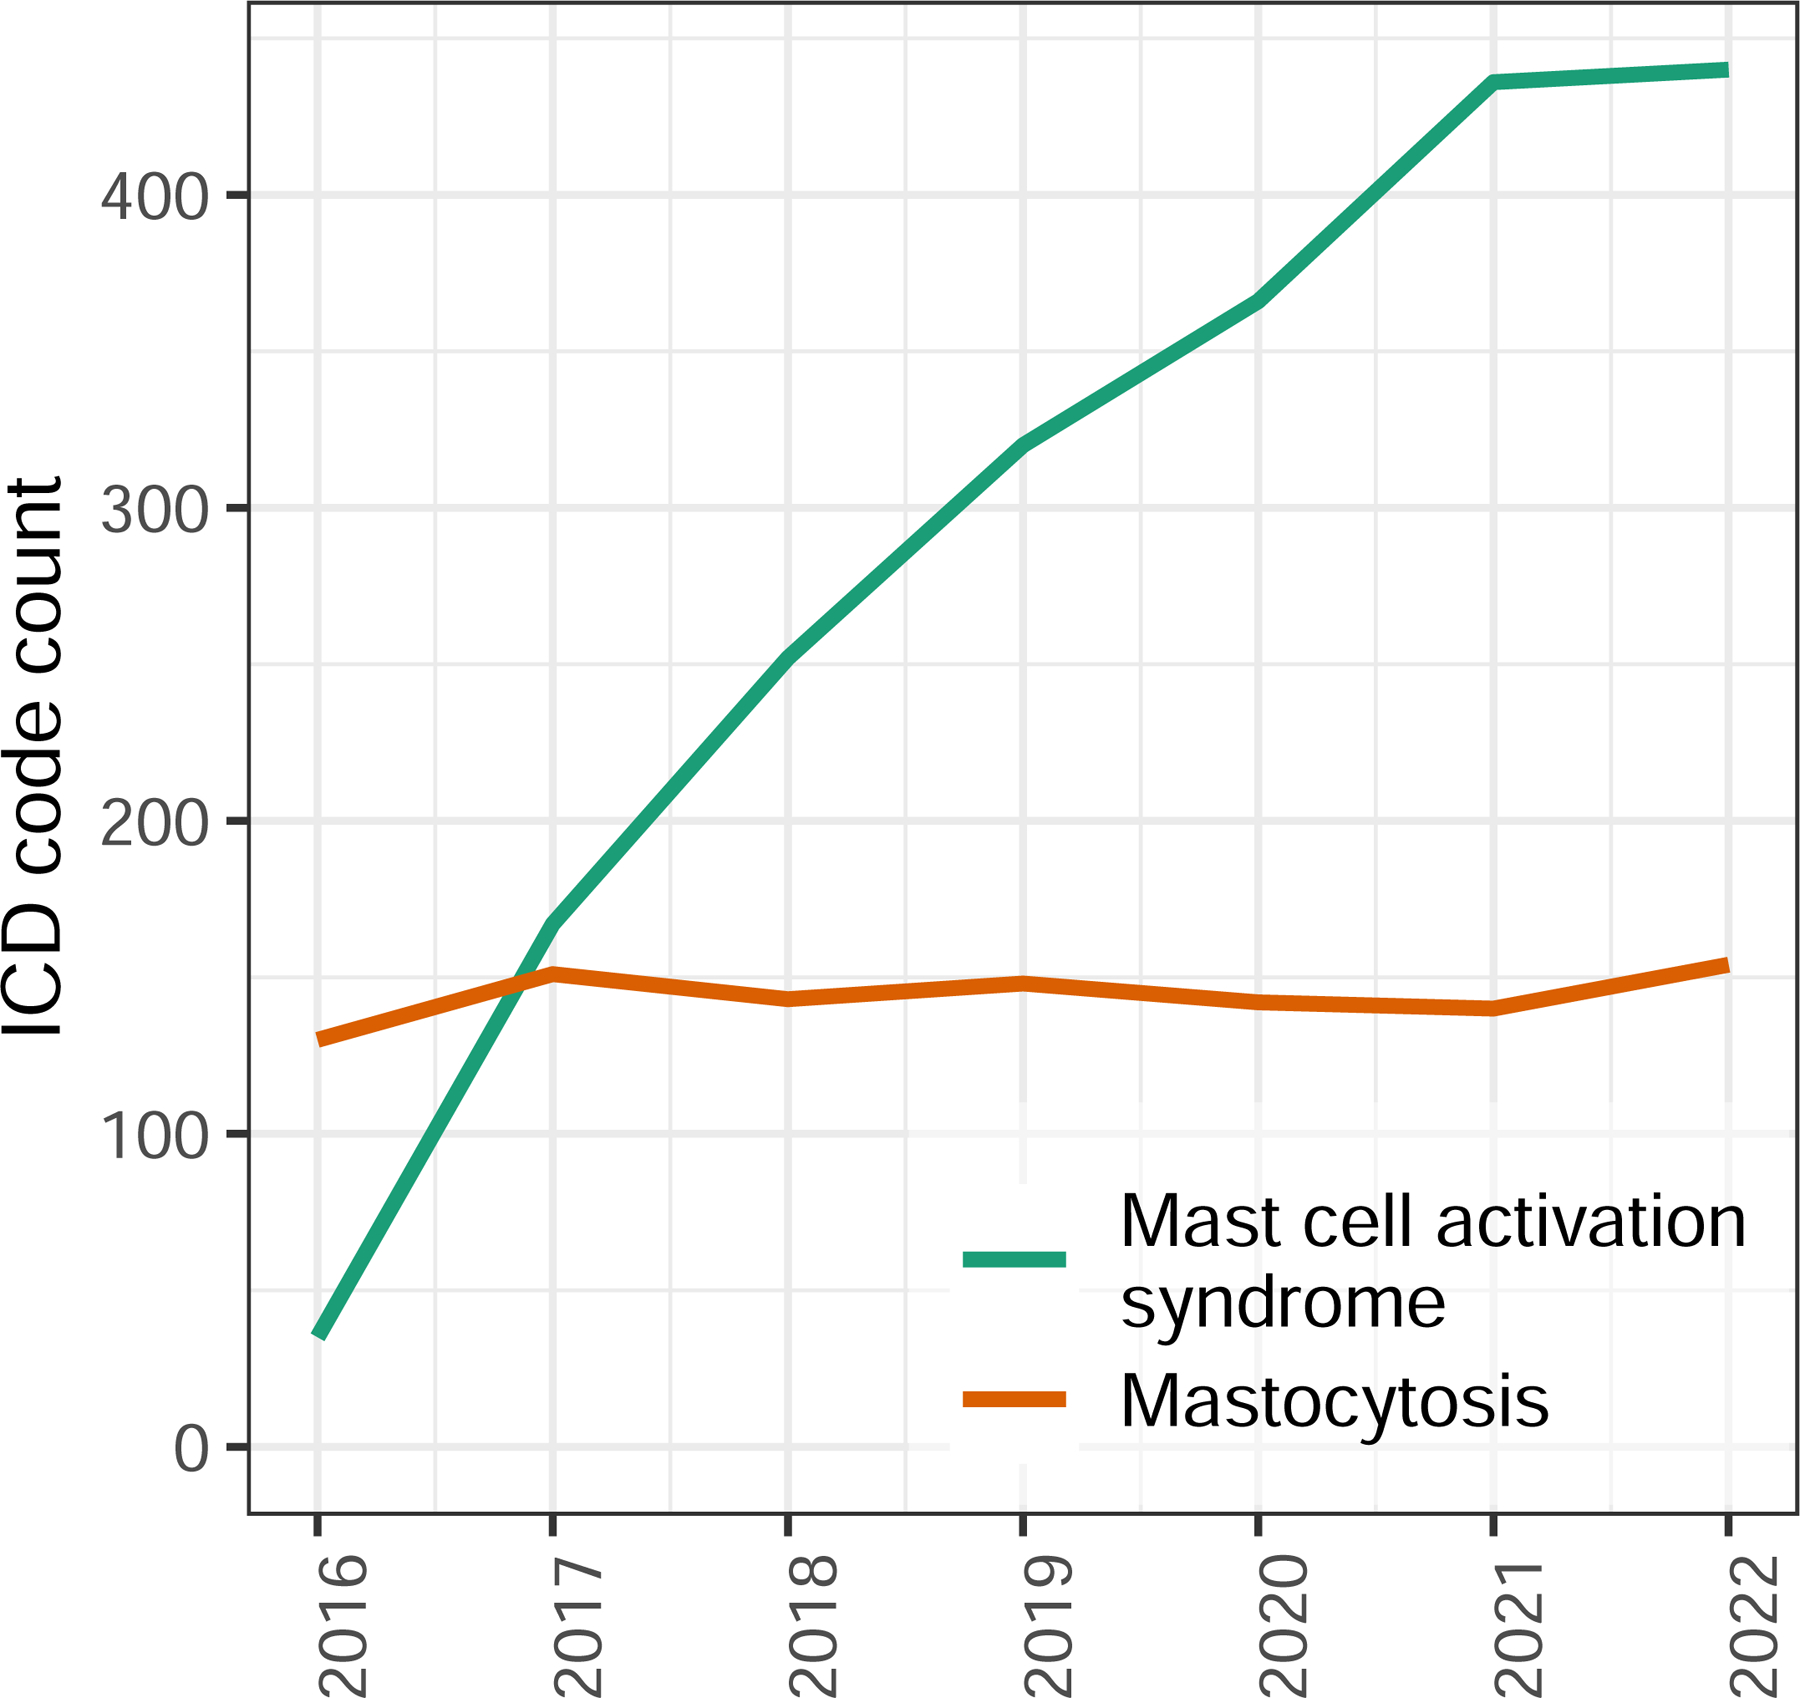
Background: The rate of diagnosis of mast cell activation syndrome (MCAS) has increased since the disorder's original description as a mastocytosis-like phenotype. While a set of consortium MCAS criteria is well described and widely accepted, this increase occurs in the setting of a broader set of proposed alternative MCAS criteria.
Objective: Effective diagnostic criteria must minimize the range of unrelated diagnoses that can be erroneously classified as the condition of interest. We sought to determine if the symptoms associated with alternative MCAS criteria result in less concise or consistent diagnostic alternatives, reducing diagnostic specificity.
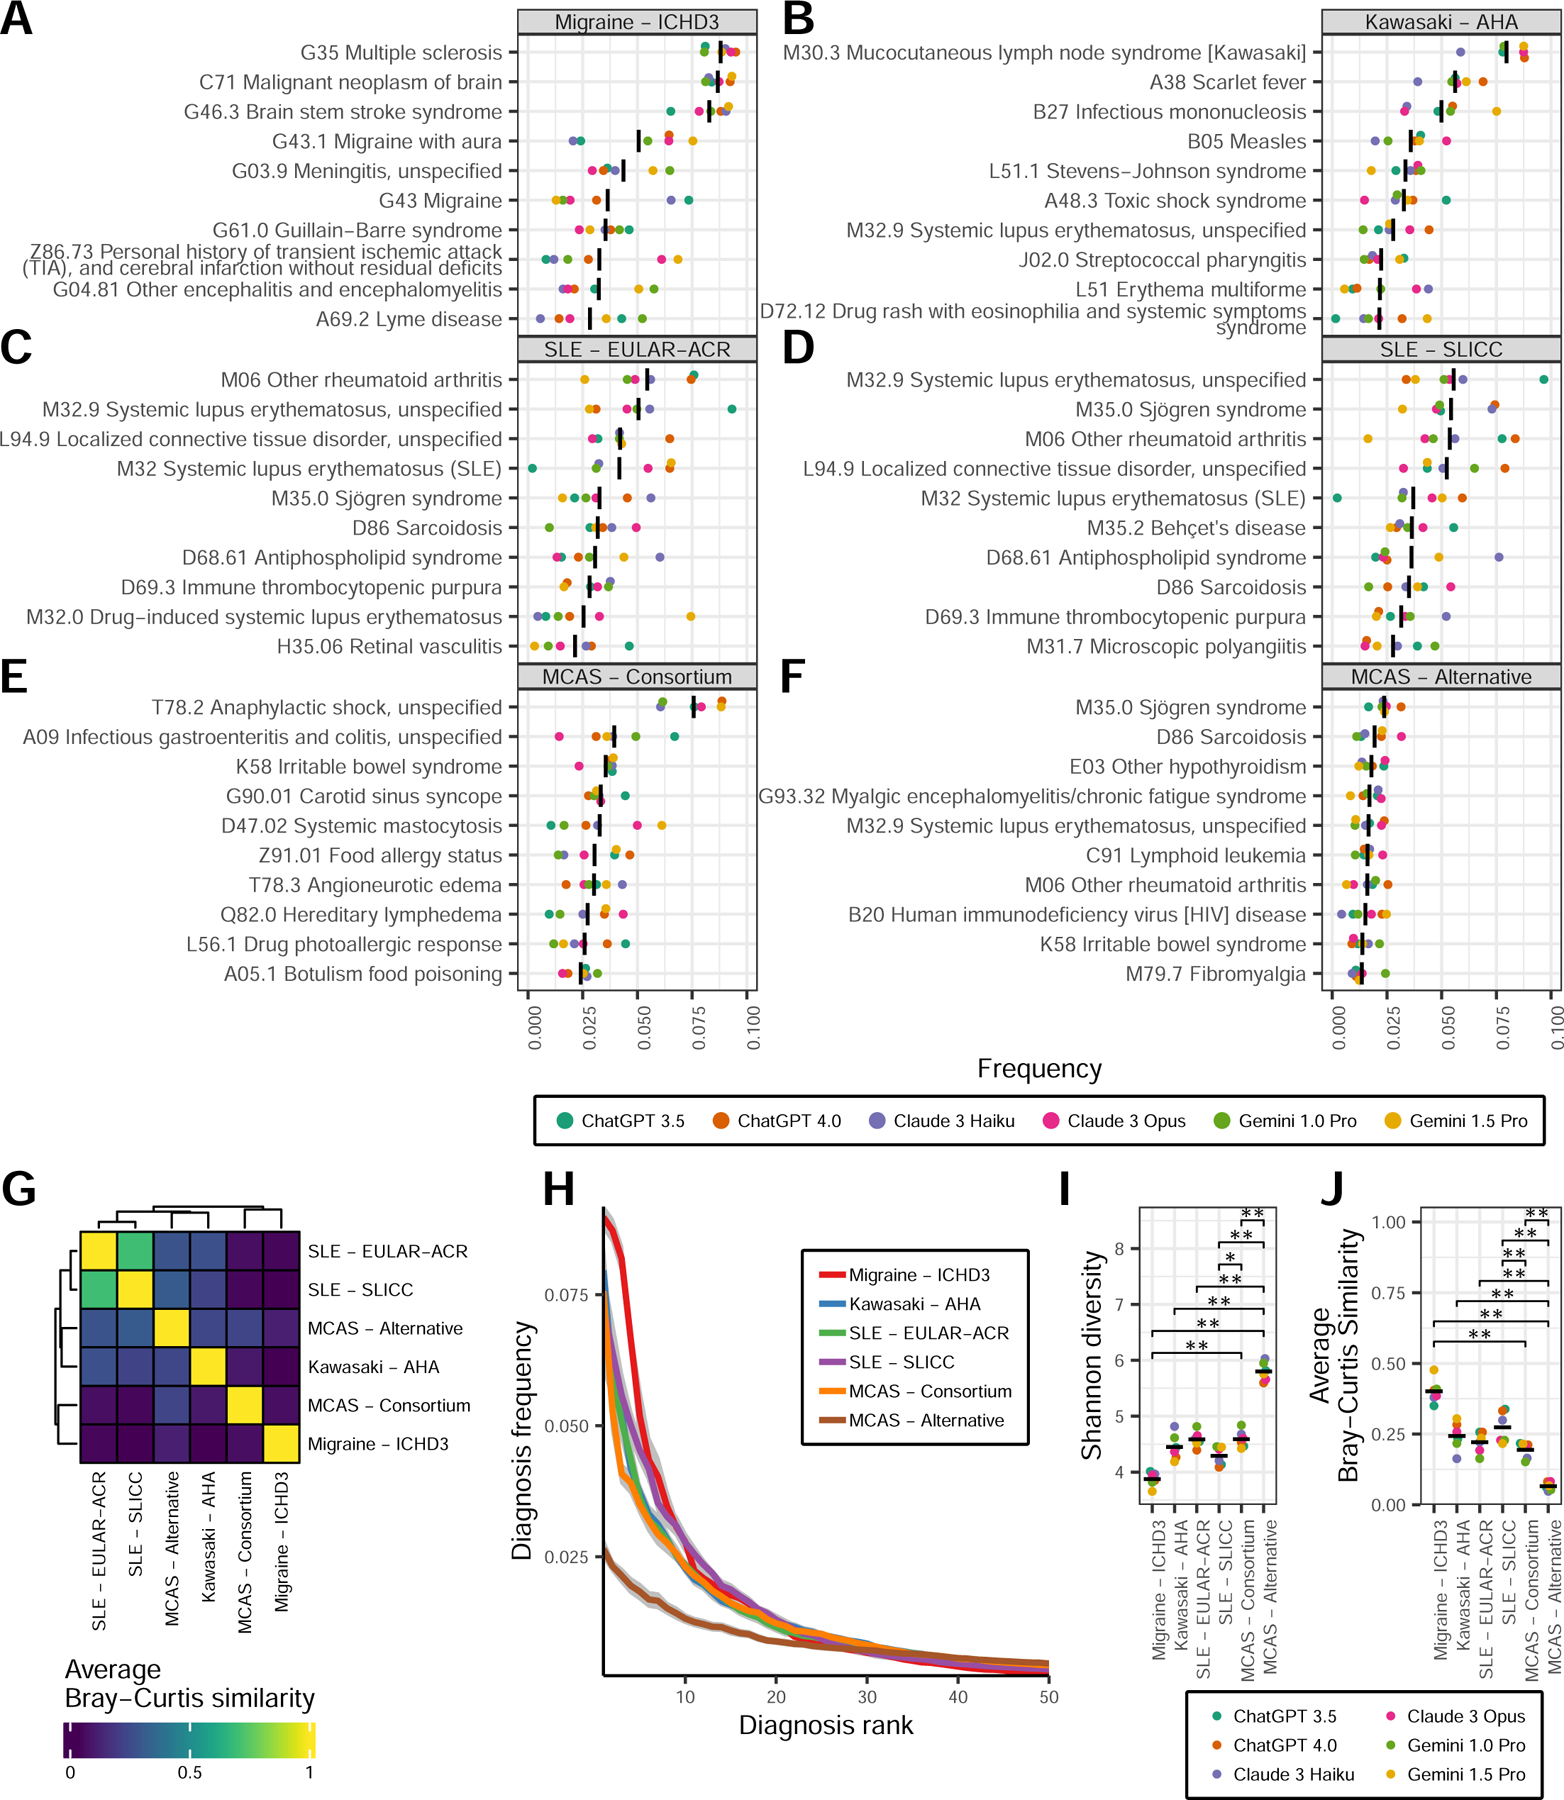
Methods: We used multiple large language models, including ChatGPT, Claude, and Gemini, to bootstrap the probabilities of diagnoses that are compatible with consortium or alternative MCAS criteria. We utilized diversity and network analyses to quantify diagnostic precision and specificity compared to control diagnostic criteria including systemic lupus erythematosus, Kawasaki disease, and migraines.
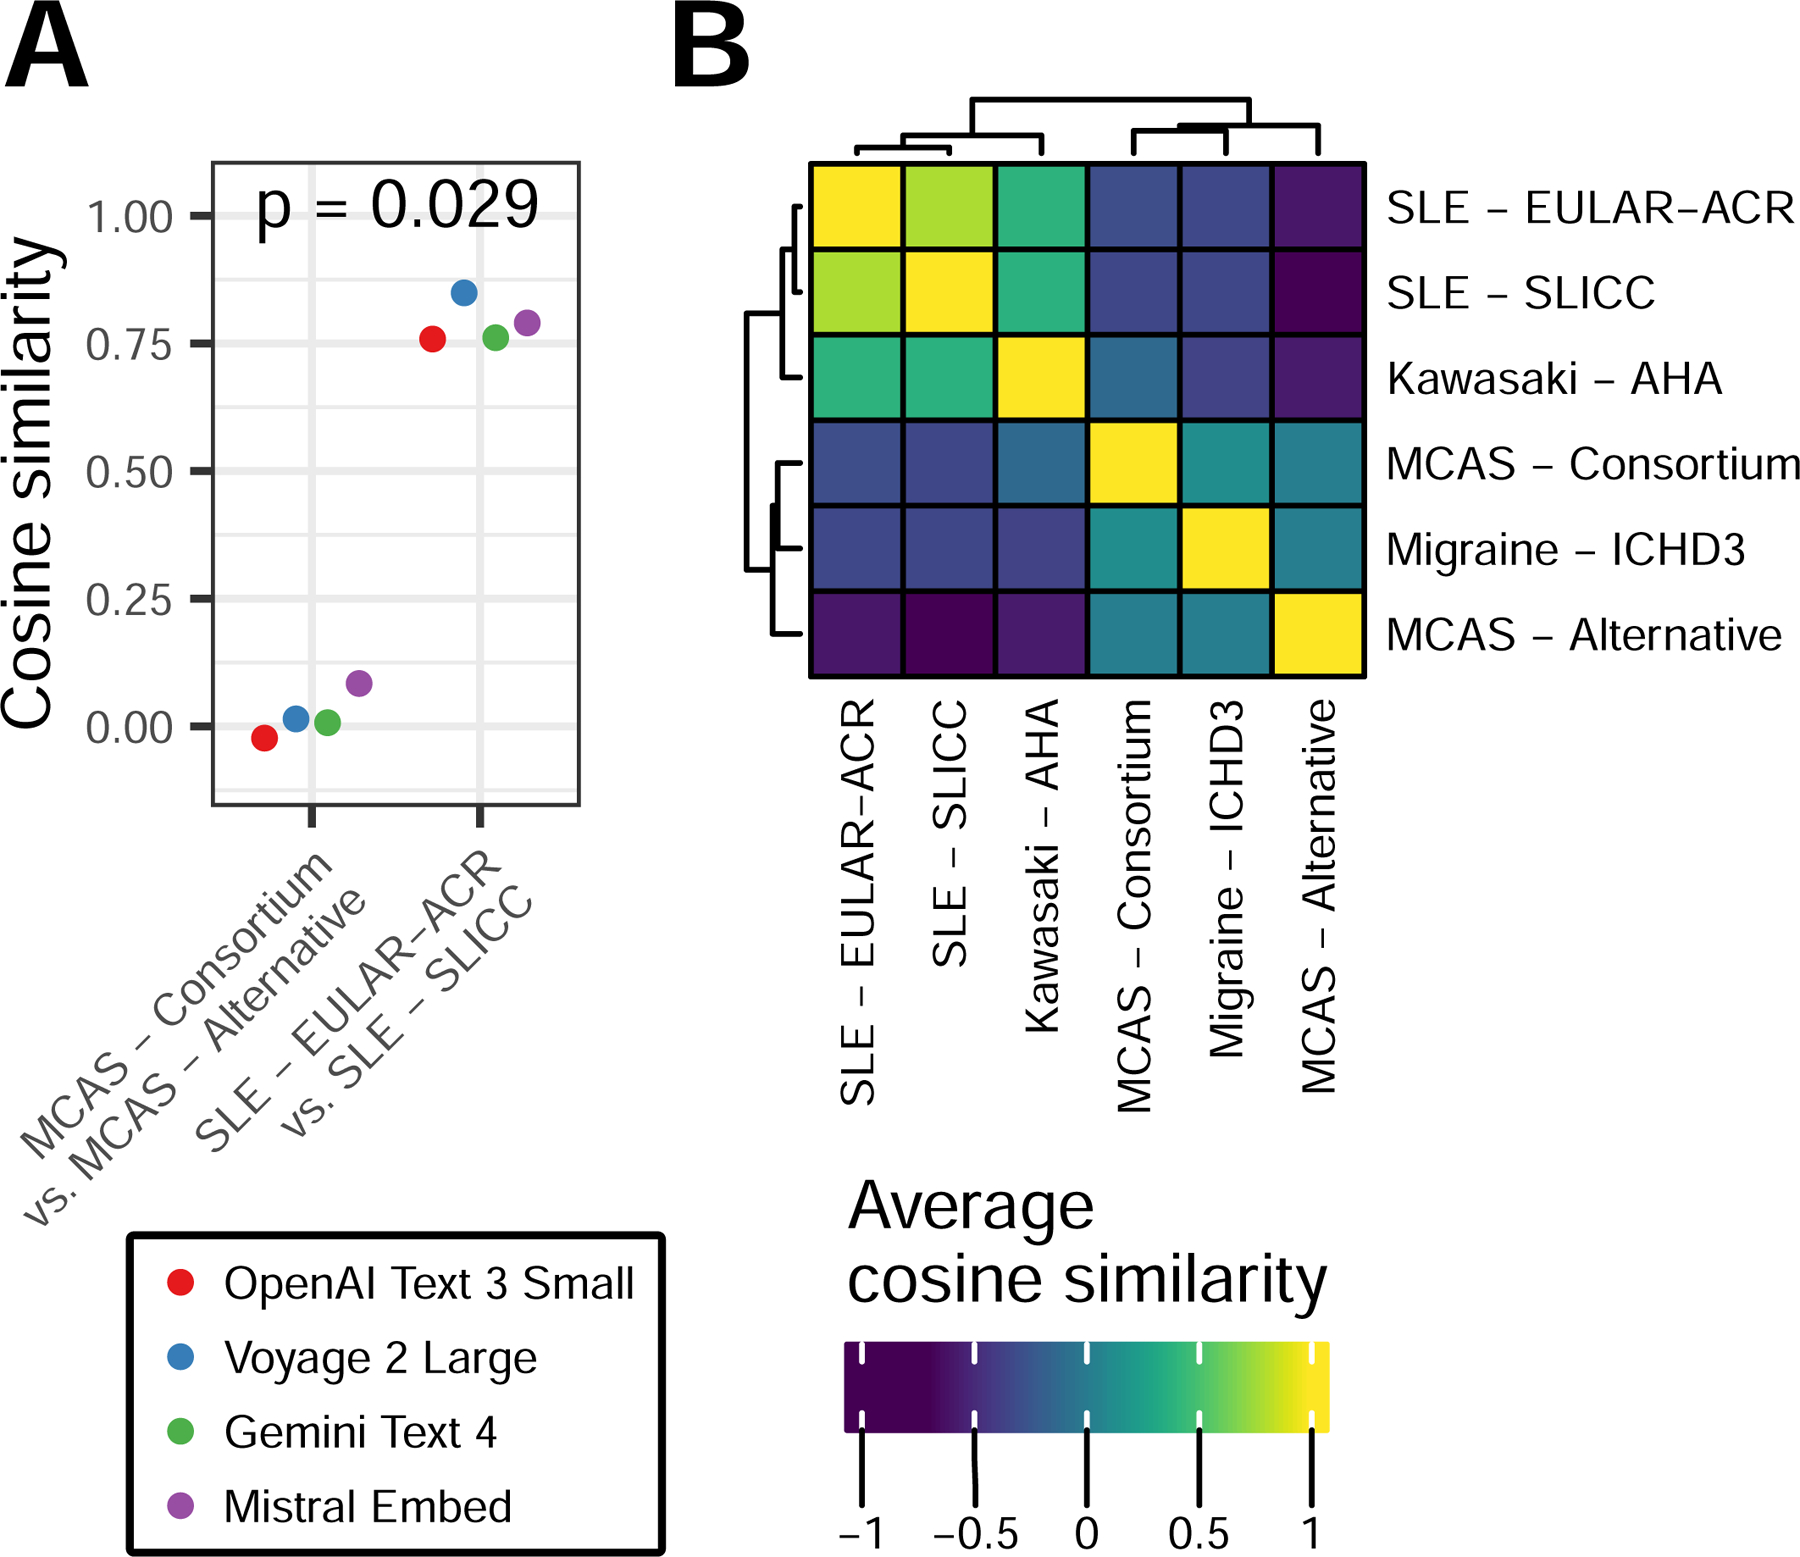
Results: Compared to consortium MCAS criteria, alternative MCAS criteria are associated with more variable (Shannon diversity 5.8 vs 4.6, respectively; P = .004) and less precise (mean Bray-Curtis similarity 0.07 vs 0.19, respectively; P = .004) diagnoses. The diagnosis networks derived from consortium and alternative MCAS criteria had lower between-network similarity compared to the similarity between diagnosis networks derived from 2 distinct systemic lupus erythematosus criteria (cosine similarity 0.55 vs 0.86, respectively; P = .0022).
Conclusion: Alternative MCAS criteria are associated with a distinct set of diagnoses compared to consortium MCAS criteria and have lower diagnostic consistency. This lack of specificity is pronounced in relation to multiple control criteria, raising the concern that alternative criteria could disproportionately contribute to MCAS overdiagnosis, to the exclusion of more appropriate diagnoses.
Keywords: Mast cell; anaphylaxis; artificial intelligence; generative pretrained transformer; large language model; mast cell activation syndrome; mastocytosis; natural language processing.
Copyright © 2024 American Academy of Allergy, Asthma & Immunology. Published by Elsevier Inc. All rights reserved.
Conflict of interest statement
Disclosure statement Suported by the Bill and Melinda Gates Foundation (OPP1113682 to P.K.); the National Institute of Allergy and Infectious Diseases (NIAID) grants U19AI057229 and U19AI67903; NIAID contract 75N93022C00052; Department of Defense contracts W81XWH1910235 and W911NF2320019; and the National Institute of Child Health and Human Development (grant K12HD000850). Disclosure of potential conflict of interest: The authors declare that they have no relevant conflicts of interest.
Figures

Similar articles
-
Doctor, I Think I Am Suffering from MCAS: Differential Diagnosis and Separating Facts from Fiction.J Allergy Clin Immunol Pract. 2019 Apr;7(4):1109-1114. doi: 10.1016/j.jaip.2018.11.045. J Allergy Clin Immunol Pract. 2019. PMID: 30961836 Review.
-
Expanding spectrum of mast cell activation disorders: monoclonal and idiopathic mast cell activation syndromes.Clin Ther. 2013 May;35(5):548-62. doi: 10.1016/j.clinthera.2013.04.001. Epub 2013 May 1. Clin Ther. 2013. PMID: 23642289 Review.
-
Using the Right Criteria for MCAS.Curr Allergy Asthma Rep. 2024 Feb;24(2):39-51. doi: 10.1007/s11882-024-01126-0. Epub 2024 Jan 20. Curr Allergy Asthma Rep. 2024. PMID: 38243020 Free PMC article. Review.
-
Selecting the Right Criteria and Proper Classification to Diagnose Mast Cell Activation Syndromes: A Critical Review.J Allergy Clin Immunol Pract. 2021 Nov;9(11):3918-3928. doi: 10.1016/j.jaip.2021.06.011. Epub 2021 Jun 22. J Allergy Clin Immunol Pract. 2021. PMID: 34166845 Review.
-
Global Classification of Mast Cell Activation Disorders: An ICD-10-CM-Adjusted Proposal of the ECNM-AIM Consortium.J Allergy Clin Immunol Pract. 2022 Aug;10(8):1941-1950. doi: 10.1016/j.jaip.2022.05.007. Epub 2022 May 25. J Allergy Clin Immunol Pract. 2022. PMID: 35623575
References
-
- Sonneck K, Florian S, Müllauer L, Wimazal F, Födinger M, Sperr WR, et al. Diagnostic and Subdiagnostic Accumulation of Mast Cells in the Bone Marrow of Patients with Anaphylaxis: Monoclonal Mast Cell Activation Syndrome. Int Arch Allergy Immunol 2007;142:158–64. - PubMed
MeSH terms
Grants and funding
LinkOut - more resources
Full Text Sources
