. 2024 Sep 15;15(9):676.
doi: 10.1038/s41419-024-07056-z.

SMAC mimetic drives microglia phenotype and glioblastoma immune microenvironment

Affiliations

SMAC mimetic drives microglia phenotype and glioblastoma immune microenvironment

Emmanuel Snacel-Fazy et al. Cell Death Dis. .

Abstract

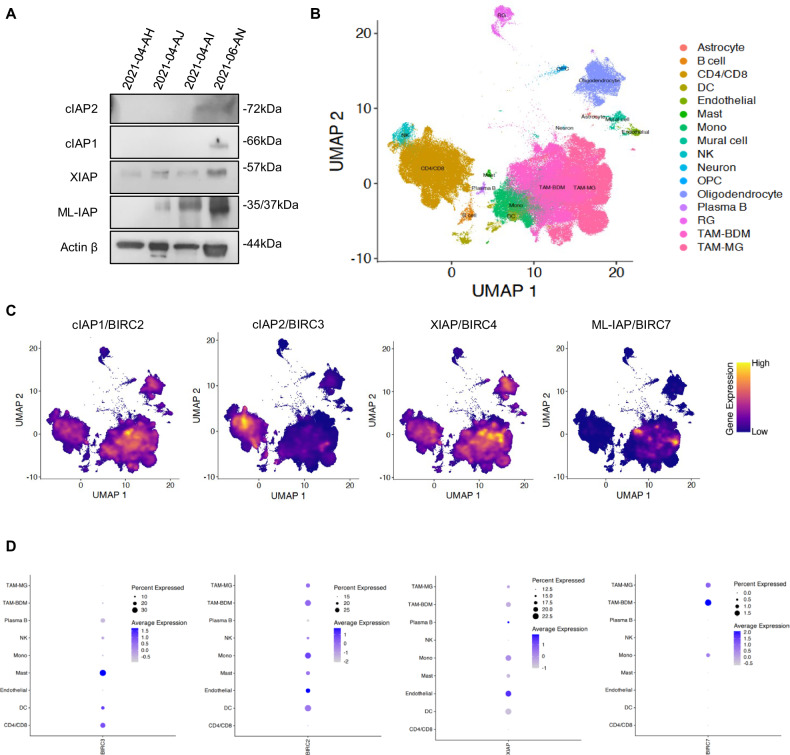
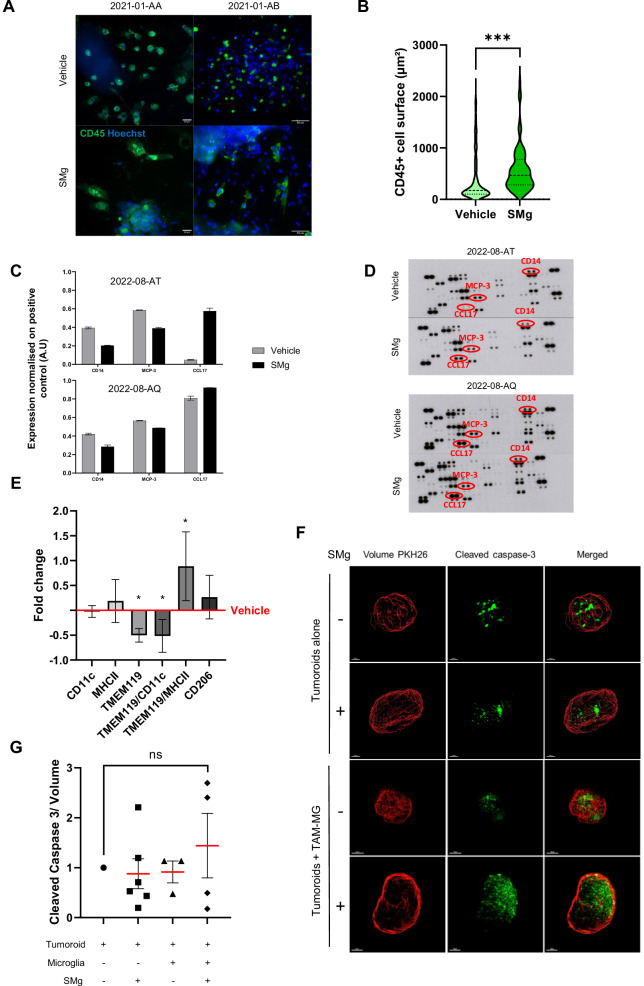
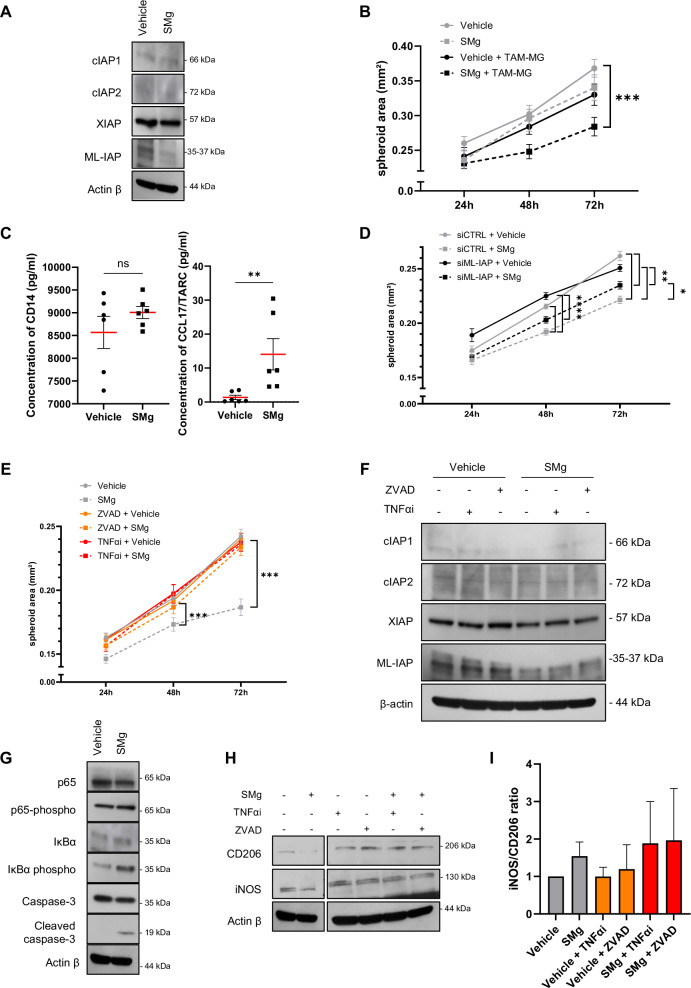
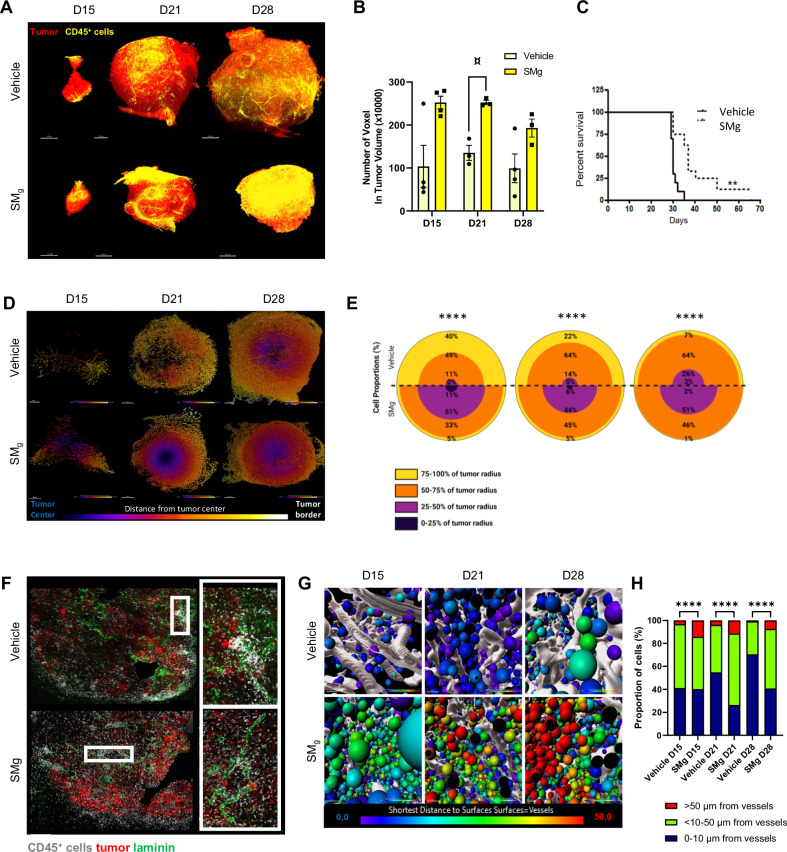
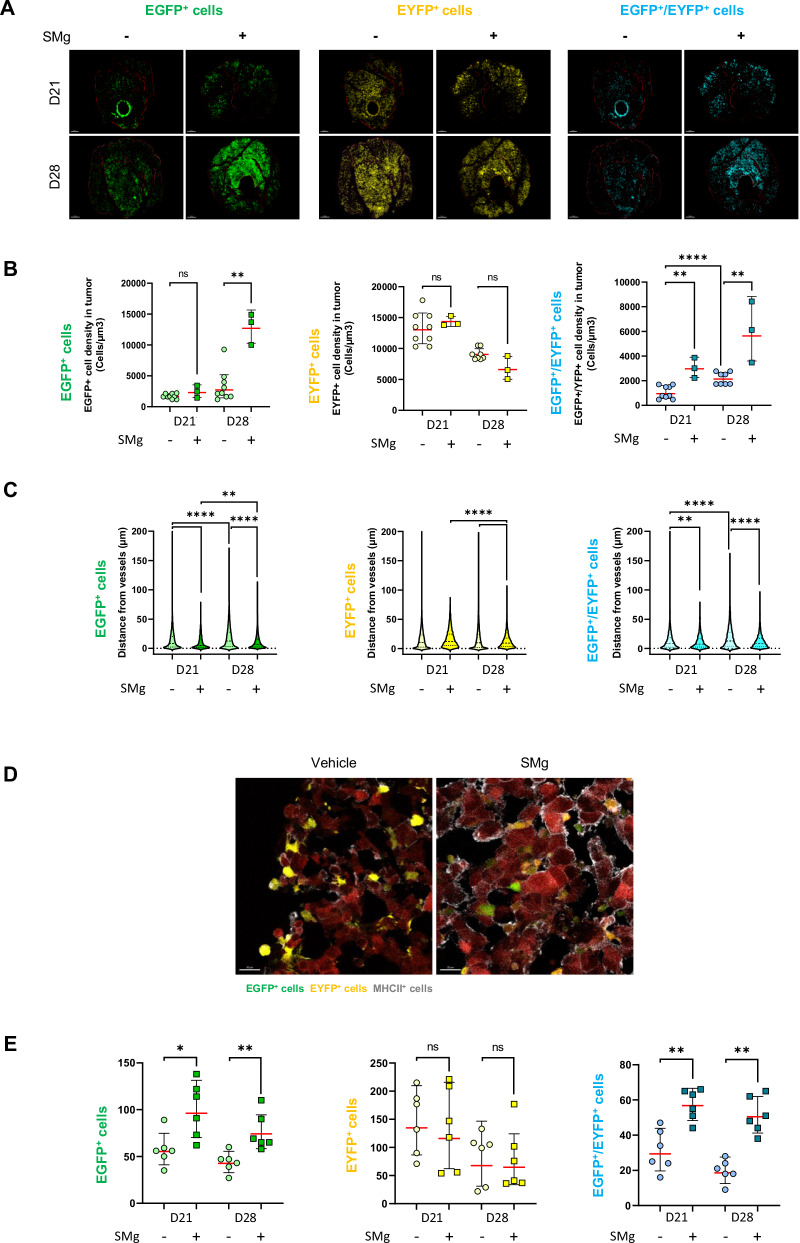
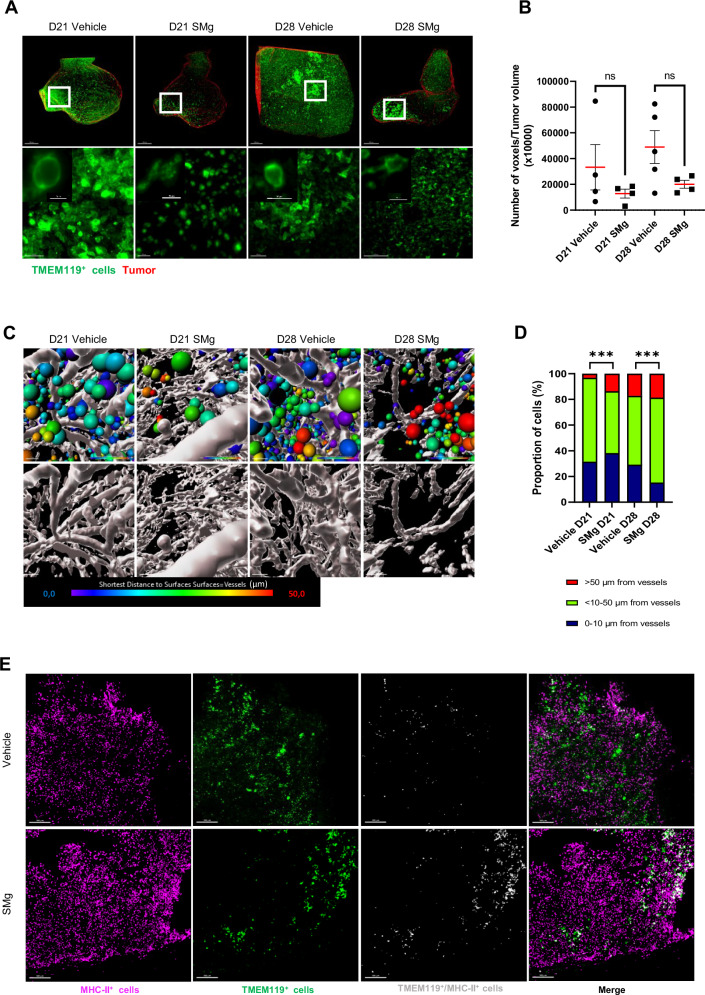
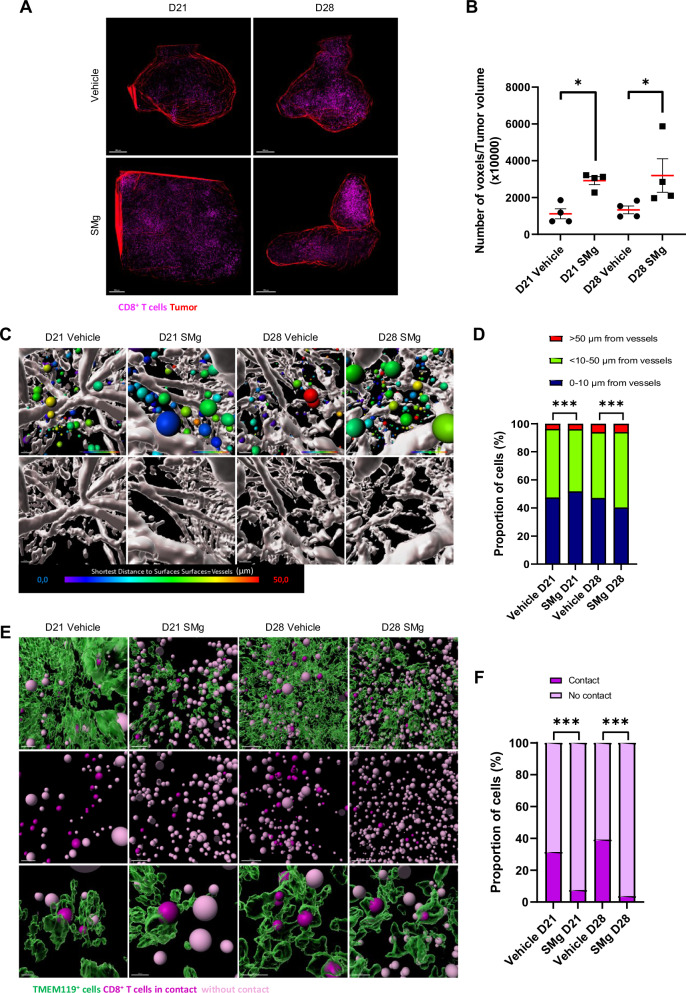
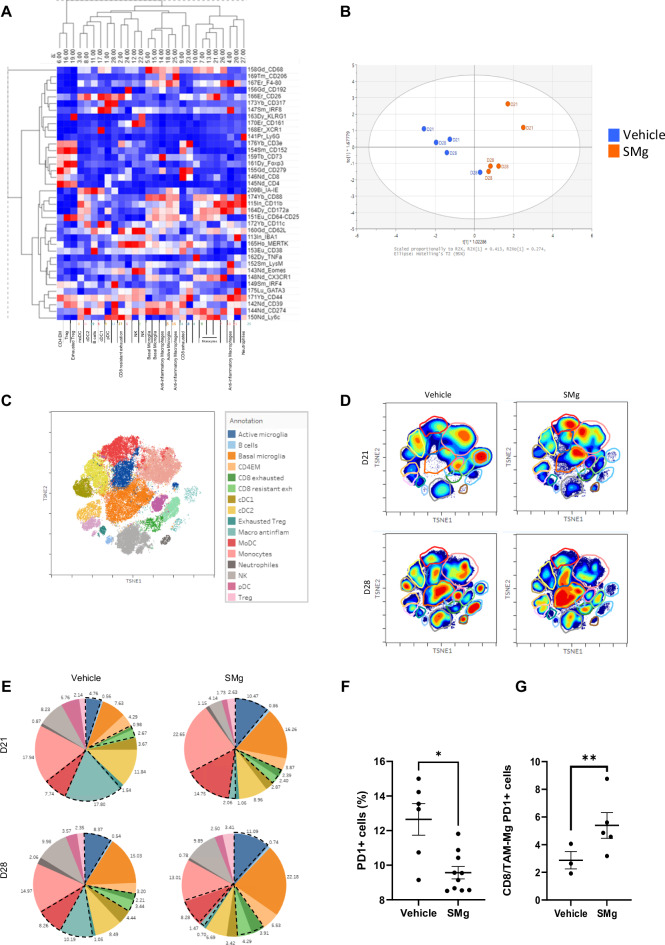
Tumor-associated macrophages/microglia (TAMs) are highly plastic and heterogeneous immune cells that can be immune-supportive or tumor-supportive depending of the microenvironment. TAMs are the most abundant immune cells in glioblastoma (GB), and play a key role in immunosuppression. Therefore, TAMs reprogramming toward immune-supportive cells is a promising strategy to overcome immunosuppression. By leveraging scRNAseq human GB databases, we identified that Inhibitor of Apoptosis Proteins (IAP) were expressed by TAMs. To investigate their role in TAMs-related immunosuppression, we antagonized IAP using the central nervous system permeant SMAC mimetic GDC-0152 (SMg). On explants and cultured immune cells isolated from human GB samples, SMg modified TAMs activity. We showed that SMg treatment promoted microglia pro-apoptotic and anti-tumoral function via caspase-3 pro-inflammatory cleavage and the inhibition of tumoroids growth. Then we designed a relevant immunogenic mouse GB model to decipher the spatio-temporal densities, distribution, phenotypes and function of TAMs with or without SMg treatment. We used 3D imaging techniques, a transgenic mouse with fluorescent TAM subsets and mass cytometry. We confirmed that SMg promoted microglia activation, antigen-presenting function and tumor infiltration. In addition, we observed a remodeling of blood vessels, a decrease in anti-inflammatory macrophages and an increased level of monocytes and their mo-DC progeny. This remodeling of the TAM landscape is associated with an increase in CD8 T cell density and activation. Altogether, these results demonstrated that SMg drives the immunosuppressive basal microglia toward an active phenotype with pro-apoptotic and anti-tumoral function and modifies the GB immune landscape. This identifies IAP as targets of choice for a potential mechanism-based therapeutic strategy and SMg as a promising molecule for this application.


Conflict of interest statement

The authors declare no competing interests.

Figures

Fig. 1
Fig. 1. Expression of cIAP1, cIAP2, XIAP and ML-IAP in human GB samples.
A IAP expression levels were analyzed by Western blotting in hCD45 sorted cells from 4 human GB samples. Expression level of actin β served as loading control. B UMAP representing the different clusters of cells composing the GB tumor microenvironment. Each single cell was mapped to previously published states (n > 1 million cells). C Expression profile of cIAP1/BIRC2, cIAP2/BIRC3, XIAP/BIRC5 and ML-IAP/BIRC7 within the cells of the microenvironment. Note enrichment within TAMs (BDM and MG). D Dot plot representation of the expression of cIAP1/BIRC2, cIAP2/BIRC3, XIAP/BIRC5 and ML-IAP/BIRC7 within the cells of the microenvironment. The size of the dots represents the percentage of cells within the population that express the gene of interest. The color of the dots represents the extent of expression within the plots. DC dendritic cells, Mono monocytes, NK natural killer, OPC oligodendrocyte-precursor cells, RG radial glia, TAM-BDM monocyte-derived cells, TAM-MG microglia.
Fig. 2
Fig. 2. IAP inhibition promotes TAM-MG pro-apoptotic function.
A Explants derived from human GB were labeled with anti-CD45 antibody (green) and Hoechst (nuclei, blue). Explants were treated for 72 h with vehicle or SMg at 1 µM (scale bar = 50 µm). Representative explants of 1 patient out of 7 are shown. B Violin plot of CD45+ cells surface (µm²). Quantification was performed with ImageJ, in vehicle (n = 311 cells) and SMg-treated (n = 123 cells) explants. Statistical analyses were performed by using t-test; alpha=0.05, bilateral p-value: ***p < 0.005. C Quantification of the main cytokines/chemokines differentially expressed between vehicle and SMg-treated human CD45+ cells after 72 h of treatment. The means of duplicates are shown. D Membranes of the cytokines and chemokines array. The most significant cytokines/chemokines have been spotted in red. E CD45+ cells were immunomagnetically sorted from 6 human GB samples. After 72 h of vehicle or SMg treatment at 1 µM, flow cytometry was performed. Fold changes were normalized on vehicle condition. Bar graphs represent mean ± s.e.m. Statistical analyses were performed by using Mann–Whitney test; alpha = 0.05, bilateral p-value: *p < 0.05. F 3D reconstitution of cleared vehicle or treated tumoroids co-cultured with TAM-MG isolated from the same patient. Tumoroids alone without SMg and without TAM-MG co-culture were considered as controls. Nucview staining (green) identifies caspase-3 cleavage and PKH26 (red) represents the tumoroid volume; Co-Cultures were generated from 3 patient samples. Representative images of a same patient are shown. Scale bar=150 µm. G Quantification of caspase-3 cleavage in tumoroids without TAM-MG following vehicle (n = 9) or SMg treatment (n = 6) and with TAM-MG (vehicle, n = 3; SMg, n = 4) from 3 human GB samples. Fold changes were normalized on vehicle without TAM-MG condition. Statistical analyses were performed by using Mann–Whitney test; alpha = 0.05. ns non-significant. C, E, G Bar graphs represent mean ± s.e.m.
Fig. 3
Fig. 3. IAP inhibition promotes TAM-MG proinflammatory phenotype.
A Representative experiment of 3 independent experiments of IAP expression levels analyzed by Western blotting after 72 h of vehicle or SMg treatment in C8B4 microglia cell line. B Quantification of GL261-DsRed spheroids area upon vehicle (n = 10) and SMg treatment (n = 9) and in the presence or not of the C8B4 cells (n = 10). Statistical analyses were performed by using ANOVA test and ANOVA post-hoc Tukey test; alpha = 0.05, bilateral p-value: ***p < 0.0005. C Concentrations of CD14 and CCL17/TARC quantified in the supernatant of C8B4 and GL261-DsRed co-cultures by ELISA assay after 72 h of vehicle or SMg treatments (n = 6 independent experiments). Statistical analyses were performed by using Mann–Whitney test; alpha = 0.05, bilateral p-value: **p < 0.005. D Quantification of GL261-DsRed spheroids area in the presence of the C8B4 cells expressing ML-IAP (siCTRL) or down-expressing ML-IAP (siML-IAP) (n = 10) after 72 h of treatment vehicle (n = 10) and SMg treatment (n = 9). Data from three independent experiments. Statistical analyses were performed by using ANOVA test and ANOVA post-hoc Tukey test; alpha = 0.05, bilateral p-value: *p < 0.05 ; **p < 0.005 ; ****p < 0.0001. E Quantification of GL261-DsRed spheroid area in the presence of C8B4 cells treated with vehicle and SMg for 72 h. C8B4 cells were pre-treated for 24 h with ZVAD (vehicle n = 23, SMg n = 23) and TNFαi (vehicle n = 27, SMg n = 23) or without pre-treatment (vehicle n = 28, SMg n = 25). Statistical analyses were performed by using ANOVA test and ANOVA post-hoc Tukey test; alpha = 0.05, bilateral p-value: ***p < 0.0005. F Representative experiment (n = 2) of IAP expression levels analyzed by western blotting after 72 h of vehicle or SMg treatment in C8B4 microglia cell line. C8B4 cells were pre-treated for 24 h with ZVAD and TNFαi. G Representative experiment (n = 2) of expression levels of p65, phospho-p65, IκBα, phospho IκB, caspase-3, cleaved caspase-3 analyzed by Western blotting in C8B4 microglia cell line after 24 h of vehicle or SMg treatment. H Representative experiment out of 3 experiments of expression levels of CD206 and iNOS analyzed by Western blotting after 24 h of vehicle or SMg treatment. C8B4 cells were pre-treated for 24 h with ZVAD and TNFαi. Expression level of actin β served as loading control. I iNOS/CD206 ratio in C8B4 microglia cell line after 24 h of vehicle or SMg treatment. C8B4 cells were pre-treated for 24 h with ZVAD and TNFαi. Quantification was performed from 3 independent experiments using ImageJ software and data presented were normalized to actin β expression. iNOS/CD206 ratio fold changes were normalized on vehicle condition. BE, I Bar graphs represent mean ± s.e.m.
Fig. 4
Fig. 4. SMg increases CD45+ immune cell density and promotes their infiltration.
A 3D reconstitution of cleared hemi-brains 15, 21 and 28 days-post GL261-DsRed cells graft (D15, D21 and D28) of vehicle (n = 11) and SMg-treated (n = 10) mice. Tumor cells were labelled with an anti-RFP antibody (red), immune cells with an anti-CD45 antibody (yellow). Scale bar = 500 µm. Representative images are shown. B Quantification of CD45+ cell density in tumors (vehicle, D15 n = 4, D21 n = 3 and D28 n = 4; SMg, D15 n = 4, D21 n = 3 and D28 n = 3). Data were normalized to the respective tumor volume. Bar graphs represent mean ± s.e.m. Statistical analyses were performed by using the Kruskal–Wallis test; alpha = 0.05, bilateral p-value: D15 vehicle-SMg = 0.083; D21 vehicle-SMg = 0.057; D28 vehicle-SMg = 0.248; ¤ = tendency. C Survival curves were estimated by the Kaplan–Meier method (vehicle n = 8, SMg n = 9); **p-value < 0.005. D Heat map representing the repartition of the CD45+ cells between tumor border and tumor center. Representative axial images are shown. E Quantification of the repartition of the CD45+ cells between tumor border and tumor center. For each condition and time points, 2 tumors were pooled for the CD45+ cells analysis. D15 (vehicle n = 18164, SMg n = 14750), D21 (vehicle n = 174678, SMg n = 243797), D28 (vehicle n = 2083336, SMg n = 11346604). Data are expressed as % of the total number of CD45+ cells. Statistical analyses were performed with Khi² test; alpha = 0.05, bilateral p-value: ****p < 0.0001. F Confocal images of D28 tumors. and CD45+ (white) cells. GL261-DsRed tumor cells appear in red, laminin in green and immune cells in white (scale bar=100 µm). White rectangles represent zoomed area. Representative images are shown. G Heat map representing the distance of the CD45+ cells from vessels at D15, D21, D28. Reconstituted vessels are represented in white. H Quantification of the distance of each CD45+ cell from vessels. For each condition and time points, all tumors were pooled for the CD45+ cells analysis (for each time point respectively vehicle and SMg; D15: 5 and 4; D21: 3 and 4; D28: 3 and 3). D15 (vehicle n = 271,072, SMg n = 169,128), D21 (vehicle n = 954,805, SMg n = 1,135,285) and D28 (vehicle n = 1,003,163, SMg n = 3,201,000). Data are expressed as % of the total number of CD45+ cells. Statistical analyses were performed with Khi² test; alpha = 0.05, bilateral p-value: ****p < 0.0001).
Fig. 5
Fig. 5. SMg modulates TAM density, spatial distribution and function.
A Two-photon images at D21 and D28 of EGFP+ cells (green), EYFP+ cells (yellow) and EGFP+/ EYFP+ cells (blue). Tumors are outlined in red (scale bar = 300 µm). Representative images are shown. B Quantification of EGFP+, EYFP+ and EGFP+/EYFP+ cell densities in vehicle (n = 9) and SMg (n = 3) treated tumors. Statistical analyses were performed by using the Mann-Whitney test; alpha = 0.05, bilateral p-value: *p < 0.05; **p < 0.005; ***p < 0.0005; ****p < 0.0001). C Violin Plot representing the distance of the EGFP+, EYFP+ and EGFP+/EYFP+ cells from vessels at D21 and D28 for each condition. Each dot represents a cell with a distance from tumor vessels expressed in µm. Statistical analyses were performed by using un-paired t-test; alpha = 0.05, bilateral p-value: **p < 0.005; ***p < 0.0005; ****p < 0.0001. D Confocal images of EGFP+ (green), EYFP+ (yellow), MHC-II+ (white) cells and GL261-DsRed tumor cells (red) (scale bar = 20 µm). Representative images of D28 tumors are shown. E Dot plot representing the number of cells expressing EGFP+, EYFP+, EGFP+/EYFP+ and co-expressing MHC-II in vehicle (n = 6) and SMg-treated (n = 6) tumors at D28. Statistical analyses were performed by using Mann–Whitney test; alpha=0.05, bilateral p-value: *=< 0.05; **p < 0.005. A 3D reconstitution and image analyses were performed by using Imaris software. B, E Bar graphs represent mean ± s.e.m.
Fig. 6
Fig. 6. SMg decreases basal TAM-MG density, promote their infiltration and their activation.
A Representative 3D reconstitution of GL261-DsRed tumors at D21 and D28 in vehicle and SMg-treated mice. Basal TAM-MG were labelled with an anti-TMEM119 antibody (green), and tumors are represented in red (scale bar = 500 µm). White squares identify zoomed areas shown in lower panels. These are Maximum Intensity Projection (MIP) of 1000 µm (scale bar = 100 µm). B Quantification of TMEM119+ cell densities in vehicle and SMg-treated tumors at D21 (n = 4) and D28 (n = 4). Bar graphs represent mean ± s.e.m. Statistical analyses were performed by using Mann-Whitney test; alpha = 0.05. C Heat map representing the distance of TMEM119+ cells from vessels. Each TMEM119+ cell (green) is represented by one spot statistically coded by the shortest distance from vessels (heat map: from 0 µm to vessels in blue to >50 µm in red). Representative images are shown. D Quantification of distance from vessels for each TMEM119+ cell. TMEM119+ cells were separated into 3 categories according to their distance from vessels (1 = 0–10 µm, 2 ≥ 10–50 µm, 3 ≥ 50) at D21 (vehicle n = 249602, SMg n = 175,272) and D28 (vehicle n = 764,564, GDC-0152 n = 157,996). Data are expressed as % of the total number of TMEM119+ cells. Statistical analyses were performed by using the Khi² test; alpha=0.05, bilateral p-value: ***p < 0.0005). E Confocal images of TMEM119 and MHC-II co-stainings of D28 tumors (scale bar = 300 µm). Representative images obtained from 2 tumors per condition are shown. A, C Acquisitions were performed by using 4× optical objective and 2.5× numeric zoom.
Fig. 7
Fig. 7. SMg treatment decreases TAM-MG and CD8 T cell crosstalk.
A Representative 3D reconstitution of CD8+ T cells (purple) in GL261-DsRed tumor (red) at D21 and D28 upon vehicle and SMg treatment (scale bar = 500 µm). B Quantification of CD8+ T cell densities in vehicle and SMg-treated tumors at D21 (n = 4) and D28 (n = 4). Bar graphs represent mean ± s.e.m. Statistical analyses were performed by using Mann–Whitney test; alpha = 0.05, bilateral p-value: *p < 0.05. C Heat map representing the distance of CD8+ T cells from vessels at D21 and D28. Each CD8+ T cell is represented by one spot statistically coded by the shortest distance from vessels (heat map: from 0 µm to vessels in blue to > 50 µm in red). Representative images are shown. D Quantification of the distance of each CD8+ T cell from vessels. Each CD8+ T cells were classified in 3 categories according to their distance from vessels (1 = 0–10 µm, 2 = > 10–50 µm, 3 = > 50) at D21 (vehicle n = 21996, SMg n = 123,557) and D28 (vehicle n = 47952, SMg n = 47838). Data were normalized by 100% of total number of CD8+ T cells. Statistical analyses were performed by using the Khi² test; alpha=0.05, bilateral p-value: ***p < 0.0005). E 3D representation of cell contacts between TMEM119+ (green) and CD8+ T (purple) cells in tumor at D21 and D28 upon vehicle and SMg treatment (scale bar = 100 µm). Representative images of whole mount stainings are shown. F Quantification of the TMEM119+ cells in contact or not with the CD8+ T cells at D21 (vehicle n = 33,938, SMg n = 152,295) and D28 (vehicle n = 90176, SMg n = 63,458). Statistical analyses were performed by using the Khi² test; alpha = 0.05, bilateral p-value: ***p < 0.0005. A, C, E Acquisitions were performed by using 4× optical objective and 2.5× numeric zoom.
Fig. 8
Fig. 8. SMg reshapes immune blood-derived cells and brain-resident immune cells.
A Heatmap representing the level of expression of each antigen in the different immune cell subsets. B Multivariate data analysis by SIMCA of vehicle (D21 n = 2, D28 n = 3) and SMg-treated (D21 n = 2, D28 n = 3) samples. C t-SNE unsupervised clustering of each immune population and annotated legend. D Heat map of the different immune cell clusters projected onto a t-SNE map for vehicle and SMg-treated tumors at D21 and D28. E Pie charts demonstrating the distribution of the identified immune cell subsets across conditions. The black dotted lines show the most affected immune cell subsets. F Percentage of TAM-MG expressing PD1 among the CD45+ cells (basal TAM-MG n = 8; active TAM-MG n = 8) upon vehicle or SMg treatment. The data from independent CYTOF experiments were pooled as well as those from D21 and D28 conditions. Statistical analyses were performed by using Mann-Whitney test; alpha = 0.05, bilateral p-value: *p < 0.05. G Ratio corresponding to CD8 total cells/TAM-MG expressing PD1 cells among the CD45+ cells upon vehicle or SMg treatment. The data from independent CYTOF experiments were pooled as well as D21 and D28 conditions (basal TAM-MG n = 22; active TAM-MG n = 22). Statistical analyses were performed by using Mann-Whitney test; alpha = 0.05, bilateral p-value: **p < 0.005. F, G Bar graphs represent mean ± s.e.m.

References

    1. Schito L, Rey S. Hypoxia: Turning vessels into vassals of cancer immunotolerance. Cancer Lett. 2020;487:74–84. 10.1016/j.canlet.2020.05.015 - DOI - PubMed
    1. Schaaf MB, Garg AD, Agostinis P. Defining the role of the tumor vasculature in antitumor immunity and immunotherapy. Cell Death Dis. 2018;9:115. 10.1038/s41419-017-0061-0 - DOI - PMC - PubMed
    1. Mathivet T, Bouleti C, Van Woensel M, Stanchi F, Verschuere T, Phng LK, et al. Dynamic stroma reorganization drives blood vessel dysmorphia during glioma growth. EMBO Mol Med. 2017;9:1629–45. 10.15252/emmm.201607445 - DOI - PMC - PubMed
    1. Quail DF, Joyce JA. The microenvironmental landscape of brain tumors. Cancer Cell. 2017;31:326–41. 10.1016/j.ccell.2017.02.009 - DOI - PMC - PubMed
    1. Klemm F, Maas RR, Bowman RL, Kornete M, Soukup K, Nassiri S, et al. Interrogation of the microenvironmental landscape in brain tumors reveals disease-specific alterations of immune cells. Cell. 2020;181:1643–60 e17. 10.1016/j.cell.2020.05.007 - DOI - PMC - PubMed

MeSH terms

Substances

LinkOut - more resources