. 2024 Sep 15;15(1):8079.
doi: 10.1038/s41467-024-52381-8.

Mammals show faster recovery from capture and tagging in human-disturbed landscapes

Jonas Stiegler  1   2 Cara A Gallagher  3 Robert Hering  3   4 Thomas Müller  5   6   7 Marlee Tucker  8 Marco Apollonio  9 Janosch Arnold  10 Nancy A Barker  11 Leon Barthel  12 Bruno Bassano  13 Floris M van Beest  14 Jerrold L Belant  15 Anne Berger  12 Dean E Beyer Jr  15 Laura R Bidner  16   17 Stephen Blake  18   19 Konstantin Börner  12 Francesca Brivio  9 Rudy Brogi  9 Bayarbaatar Buuveibaatar  20 Francesca Cagnacci  21   22 Jasja Dekker  23 Jane Dentinger  24 Martin Duľa  25 Jarred F Duquette  15 Jana A Eccard  26 Meaghan N Evans  27   28 Adam W Ferguson  17   29 Claudia Fichtel  30 Adam T Ford  31 Nicholas L Fowler  15 Benedikt Gehr  32 Wayne M Getz  33   34 Jacob R Goheen  35 Benoit Goossens  27   28 Stefano Grignolio  36 Lars Haugaard  14 Morgan Hauptfleisch  37 Morten Heim  38 Marco Heurich  39   40   41 Mark A J Hewison  42 Lynne A Isbell  16   43 René Janssen  23 Anders Jarnemo  44 Florian Jeltsch  3 Jezek Miloš  45 Petra Kaczensky  38   46 Tomasz Kamiński  47 Peter Kappeler  30   48 Katharina Kasper  47 Todd M Kautz  15 Sophia Kimmig  12 Petter Kjellander  49 Rafał Kowalczyk  47 Stephanie Kramer-Schadt  12   50 Max Kröschel  40 Anette Krop-Benesch  12 Peter Linderoth  10 Christoph Lobas  3 Peter Lokeny  29 Mia-Lana Lührs  30   51 Stephanie S Matsushima  52 Molly M McDonough  29 Jörg Melzheimer  12 Nicolas Morellet  42 Dedan K Ngatia  17 Leopold Obermair  53   54   55 Kirk A Olson  38 Kidan C Patanant  56 John C Payne  20 Tyler R Petroelje  15 Manuel Pina  57 Josep Piqué  57 Joseph Premier  39   40 Jan Pufelski  3 Lennart Pyritz  30 Maurizio Ramanzin  58 Manuel Roeleke  3 Christer M Rolandsen  38 Sonia Saïd  59 Robin Sandfort  53 Krzysztof Schmidt  47 Niels M Schmidt  14   60 Carolin Scholz  3   12 Nadine Schubert  61 Nuria Selva  62   63   64 Agnieszka Sergiel  62 Laurel E K Serieys  65 Václav Silovský  45 Rob Slotow  66   67 Leif Sönnichsen  12   47 Erling J Solberg  38 Mikkel Stelvig  68 Garrett M Street  69 Peter Sunde  14 Nathan J Svoboda  70 Maria Thaker  71 Maxi Tomowski  3   72 Wiebke Ullmann  3 Abi T Vanak  11   73   74 Bettina Wachter  12 Stephen L Webb  24 Christopher C Wilmers  52 Filip Zieba  75 Tomasz Zwijacz-Kozica  75 Niels Blaum  3
Affiliations

Mammals show faster recovery from capture and tagging in human-disturbed landscapes

Jonas Stiegler et al. Nat Commun. .

Abstract

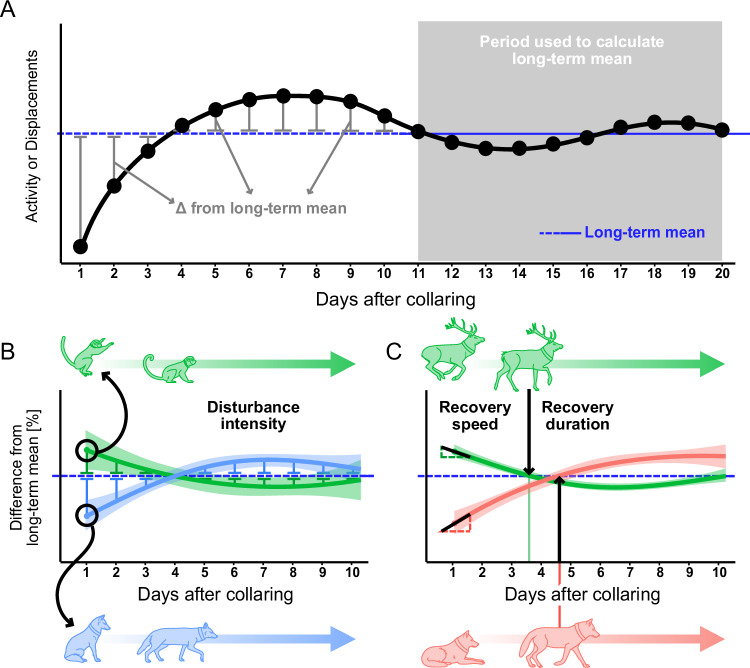
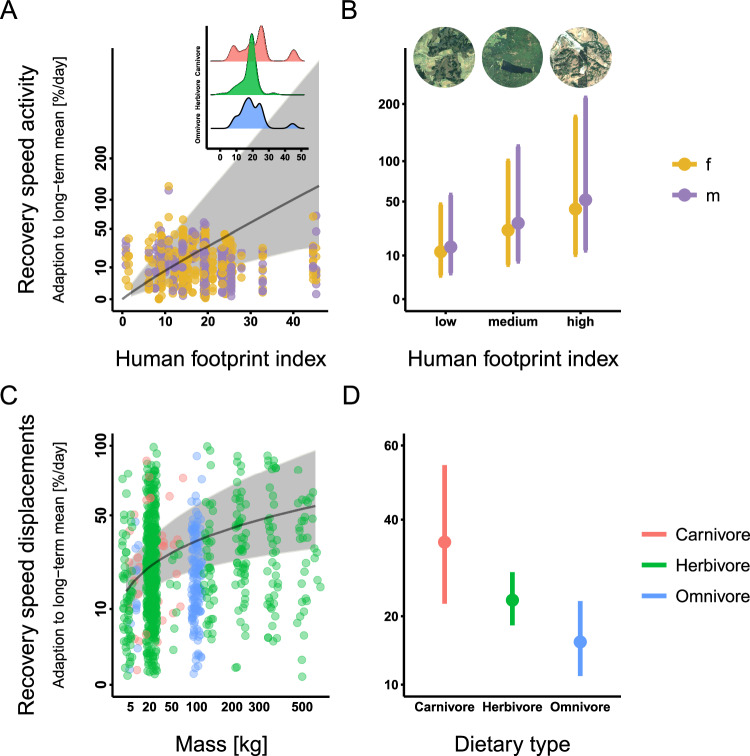
Wildlife tagging provides critical insights into animal movement ecology, physiology, and behavior amid global ecosystem changes. However, the stress induced by capture, handling, and tagging can impact post-release locomotion and activity and, consequently, the interpretation of study results. Here, we analyze post-tagging effects on 1585 individuals of 42 terrestrial mammal species using collar-collected GPS and accelerometer data. Species-specific displacements and overall dynamic body acceleration, as a proxy for activity, were assessed over 20 days post-release to quantify disturbance intensity, recovery duration, and speed. Differences were evaluated, considering species-specific traits and the human footprint of the study region. Over 70% of the analyzed species exhibited significant behavioral changes following collaring events. Herbivores traveled farther with variable activity reactions, while omnivores and carnivores were initially less active and mobile. Recovery duration proved brief, with alterations diminishing within 4-7 tracking days for most species. Herbivores, particularly males, showed quicker displacement recovery (4 days) but slower activity recovery (7 days). Individuals in high human footprint areas displayed faster recovery, indicating adaptation to human disturbance. Our findings emphasize the necessity of extending tracking periods beyond 1 week and particular caution in remote study areas or herbivore-focused research, specifically in smaller mammals.


Conflict of interest statement

The authors declare no competing interests.

Figures

Fig. 1
Fig. 1. Methods calculating the disturbance intensity, recovery speed and duration with specific examples.
A Illustrates the difference of daily activity (ODBA) and displacements (days 1–10) from the long-term means (days 11–20). First, we calculated daily (days 1–10) activity (ODBA) and displacements. Subsequently, we related derived values to the long-term mean (days 11–20). The analysis was conducted identically for activity and displacements. B To calculate the disturbance intensity, we related daily averaged values (displacement, activity) to the respective mean during days 11–20. The upper example illustrates the disturbance intensity of Propithecus verreauxi, with increased displacements on the first days, before converging towards the long-term mean; the lower illustrates the disturbance intensity in activity of Canis aureus, with decreased activity during the initial days of tracking. C Recovery speed was calculated as the ∣slope∣ on day one post-release, and recovery duration was determined as the time when animals reverted to their long-term mean for the first time post-release. The upper example illustrates the recovery speed and duration in activity of Cervus elaphus, the lower one of Canis lupus.
Fig. 2
Fig. 2. Disturbance intensity: Impacts of collaring on activity and displacements during the initial 10 days post-release.
Daily differences to the long-term mean of activity (upper) and displacements (lower) split by diet: herbivores (left), omnivores (middle), and carnivores (right) for 42 mammal species, n = 1585. All species with p ≤ 0.05 are shown as solid lines and species with p > 0.05 or n < 5 as dotted lines. Activity: R2 = 0.374, Dev. explained = 46.4%, displacements: R2 = 0.25, Dev. explained = 37.6%. Predictions are derived from two Generalized Additive Mixed Models with Gamma error distributions to assess the effect of disturbance intensity on activity and displacements of the focal species over time. The dotted blue line represents the long-term mean (average for days 11−20). In the legend following each species name, the first number refers to the number of individuals for activity and the second for displacements.
Fig. 3
Fig. 3. Recovery speed described in relation to dietary type, an individual’s sex, and the human Footprint index of the study area.
A, B Recovery speed (of activity) described in relation to sex and the Human Footprint index (HFi), n = 1241. High recovery speed values indicate a fast recovery. High HFi values indicate a strong anthropogenic influence, and low values indicate a high degree of remoteness. The inset (A) shows the density plots of the sample size distribution for each dietary guild in regard to HFi. B Predictions are presented for values of the lower (12.37), median (18.68), and upper (25) quartiles of HFi. Insets here (B) present exemplary satellite imagery of sites with differing HFi; left to right: an area with little infrastructure and some habitat fragmentation [HFi: 10]; agricultural fields with small forest patches, road infrastructure, and some settlements [HFi: 17]; a more degraded landscape with a quarry and an adjacent solar park [HFi: 25] (ⓒLandsat / Copernicus, GoogleEarth 2020-2023). Landscapes with extreme HFi values (close to zero: representing pristine, undisturbed areas; close to 50: representing dense populated urban areas) were less present in the dataset and, as such, examples are not shown. C, D Recovery speed (of displacements) described in relation to body mass (C) and dietary type (D), n = 1014. Recovery speed describes the speed of change in activity or displacements as a percentage of the respective long-term mean on day one. Dots (A, C) represent calculated values. Dots (B, D) and the solid lines (A, C) represent mean modeled values, and bars (B, D) as well as the gray shaded area (A, C) are 95% confidence intervals. Note that the y-axis is sqrt-transformed.

References

    1. Hebblewhite, M. & Haydon, D. T. Distinguishing technology from biology: a critical review of the use of GPS telemetry data in ecology. Philos. Trans. R. Soc. B Biol. Sci.365, 2303–2312 (2010). 10.1098/rstb.2010.0087 - DOI - PMC - PubMed
    1. Nathan, R. et al. A movement ecology paradigm for unifying organismal movement research. Proc. Natl Acad. Sci. USA105, 19052–19059 (2008). 10.1073/pnas.0800375105 - DOI - PMC - PubMed
    1. Jeltsch, F. et al. Integrating movement ecology with biodiversity research—exploring new avenues to address spatiotemporal biodiversity dynamics. Mov. Ecol.1, 6 (2013). 10.1186/2051-3933-1-6 - DOI - PMC - PubMed
    1. Schlägel, U. E. et al. Movement-mediated community assembly and coexistence. Biol. Rev.95, 1073–1096 (2020). 10.1111/brv.12600 - DOI - PubMed
    1. Allen, A. M. & Singh, N. J. Linking movement ecology with wildlife management and conservation. Front. Ecol. Evol.3, 155 (2016).

Publication types