

Morphometry of medial temporal lobe subregions using high-resolution T2-weighted MRI in ADNI3: Why, how, and what's next?
- PMID: 39279366
- PMCID: PMC11567830
- DOI: 10.1002/alz.14161
Morphometry of medial temporal lobe subregions using high-resolution T2-weighted MRI in ADNI3: Why, how, and what's next?
Abstract
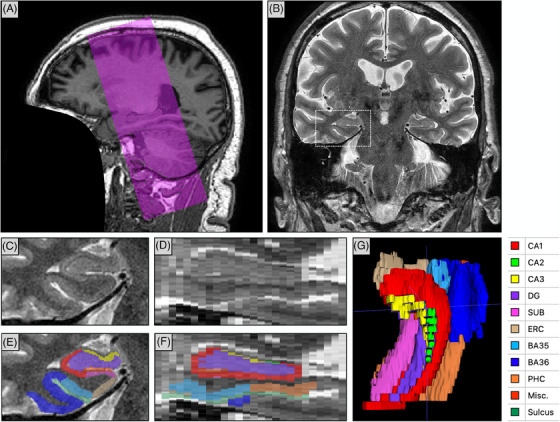
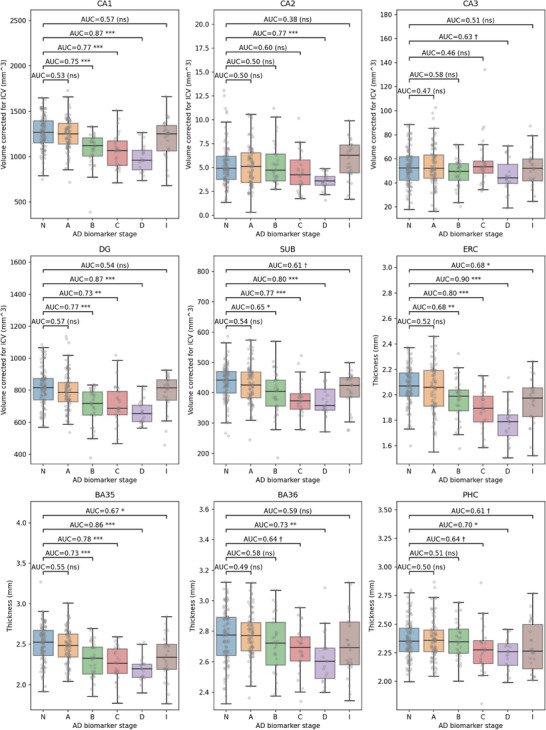
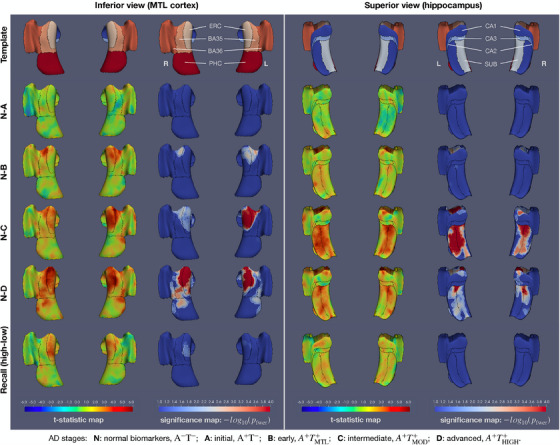
This paper for the 20th anniversary of the Alzheimer's Disease Neuroimaging Initiative (ADNI) provides an overview of magnetic resonance imaging (MRI) of medial temporal lobe (MTL) subregions in ADNI using a dedicated high-resolution T2-weighted sequence. A review of the work that supported the inclusion of this imaging modality into ADNI Phase 3 is followed by a brief description of the ADNI MTL imaging and analysis protocols and a summary of studies that have used these data. This review is supplemented by a new study that uses novel surface-based tools to characterize MTL neurodegeneration across biomarker-defined AD stages. This analysis reveals a pattern of spreading cortical thinning associated with increasing levels of tau pathology in the presence of elevated amyloid beta, with apparent epicenters in the transentorhinal region and inferior hippocampal subfields. The paper concludes with an outlook for high-resolution imaging of the MTL in ADNI Phase 4. HIGHLIGHTS: As of Phase 3, the Alzheimer's Disease Neuroimaging Initiative (ADNI) magnetic resonance imaging (MRI) protocol includes a high-resolution T2-weighted MRI scan optimized for imaging hippocampal subfields and medial temporal lobe (MTL) subregions. These scans are processed by the ADNI core to obtain automatic segmentations of MTL subregions and to derive morphologic measurements. More detailed granular examination of MTL neurodegeneration in response to disease progression is achieved by applying surface-based modeling techniques. Surface-based analysis of gray matter loss in MTL subregions reveals increasing and spatially expanding patterns of neurodegeneration with advancing stages of Alzheimer's disease (AD), as defined based on amyloid and tau positron emission tomography biomarkers in accordance with recently proposed criteria. These patterns closely align with post mortem literature on spread of pathological tau in AD, supporting the role of tau pathology in the presence of elevated levels of amyloid beta as the driver of neurodegeneration.
Keywords: Alzheimer's Disease Neuroimaging Initiative; hippocampal subfields; medial temporal lobe; morphometry; segmentation.
© 2024 The Author(s). Alzheimer's & Dementia published by Wiley Periodicals LLC on behalf of Alzheimer's Association.
Conflict of interest statement
David A. Wolk has served as a paid consultant to Eli Lilly, GE Healthcare, and Qynapse. He serves on DSMBs for Functional Neuromodulation and Glaxo Smith Kline. He is a site investigator for a clinical trial sponsored by Biogen. Sandhitsu R. Das received consultation fees from Rancho Biosciences and Nia Therapeutics. Long Xie is a paid employee of Siemens Healthineers. The other authors have nothing to disclose. Author disclosures are available in the supporting information.
Figures
References
Publication types
MeSH terms
Grants and funding
- R01-AG070592/AG/NIA NIH HHS/United States
- CAPMC/ CIHR/Canada
- R01 AG070592/AG/NIA NIH HHS/United States
- AbbVie
- Transition Therapeutics
- Cogstate
- Meso Scale Diagnostics
- Fred A. and Barbara M. Erb Family Foundation
- EuroImmun
- Biogen
- U19-AG024904/AG/NIA NIH HHS/United States
- AACSF-23-1152241/The Alzheimer's Association
- Alzheimer's Drug Discovery Foundation
- P30-AG072979/AG/NIA NIH HHS/United States
- Servier
- R25-NS065745/NS/NINDS NIH HHS/United States
- Lumosity
- Bristol-Myers Squibb Company
- U01 AG024904/AG/NIA NIH HHS/United States
- Piramal Imaging
- Takeda Pharmaceutical Company
- Araclon Biotech
- RF1-AG056014/AG/NIA NIH HHS/United States
- RF1 AG056014/AG/NIA NIH HHS/United States
- Novartis Pharmaceuticals Corporation
- CereSpir, Inc.
- BioClinica, Inc.
- R01 AG056014/AG/NIA NIH HHS/United States
- U19 AG024904/AG/NIA NIH HHS/United States
- UE5 NS065745/NS/NINDS NIH HHS/United States
- GE Healthcare
- R01 AG069474/AG/NIA NIH HHS/United States
- EB/NIBIB NIH HHS/United States
- Johnson & Johnson Pharmaceutical Research & Development LLC
- Pfizer Inc.
- Elan Pharmaceuticals, Inc.
- RF1 AG069474/AG/NIA NIH HHS/United States
- Eli Lilly and Company
- R01-AG069474/AG/NIA NIH HHS/United States
- F. Hoffmann-La Roche Ltd.
- IXICO Ltd.
- R25 NS065745/NS/NINDS NIH HHS/United States
- NeuroRx Research
- Merck & Co., Inc.
- Janssen Alzheimer Immunotherapy Research & Development, LLC
- Neurotrack Technologies
- Foundation for the National Institutes of Health (FNIH)
- Fujirebio
- Lundbeck
- Eisai Inc.
- P30 AG072979/AG/NIA NIH HHS/United States
LinkOut - more resources
Full Text Sources
Medical
Research Materials
