. 2024 Nov;11(41):e2403105.
doi: 10.1002/advs.202403105. Epub 2024 Sep 16.

Epigenetic Dynamics in Reprogramming to Dopaminergic Neurons for Parkinson's Disease

Affiliations

Epigenetic Dynamics in Reprogramming to Dopaminergic Neurons for Parkinson's Disease

Byounggook Cho et al. Adv Sci (Weinh). 2024 Nov.

Abstract

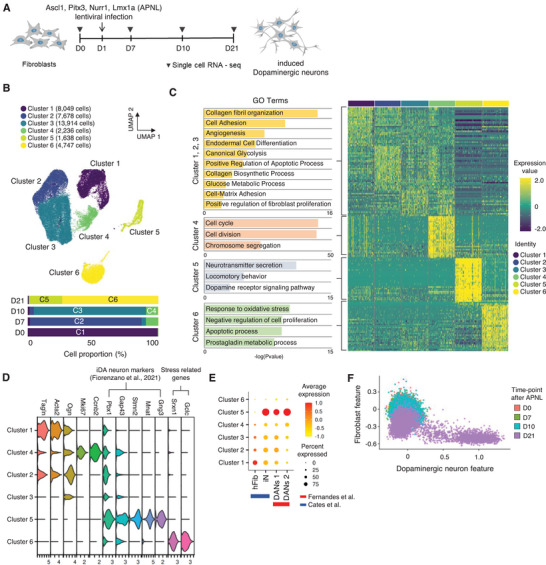
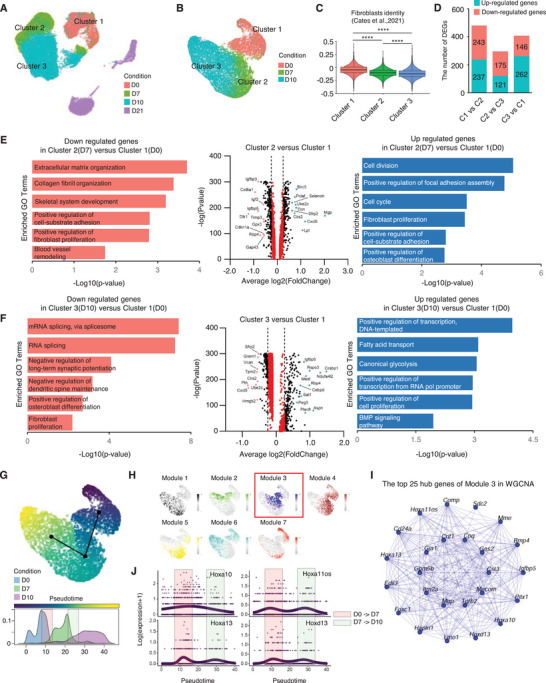
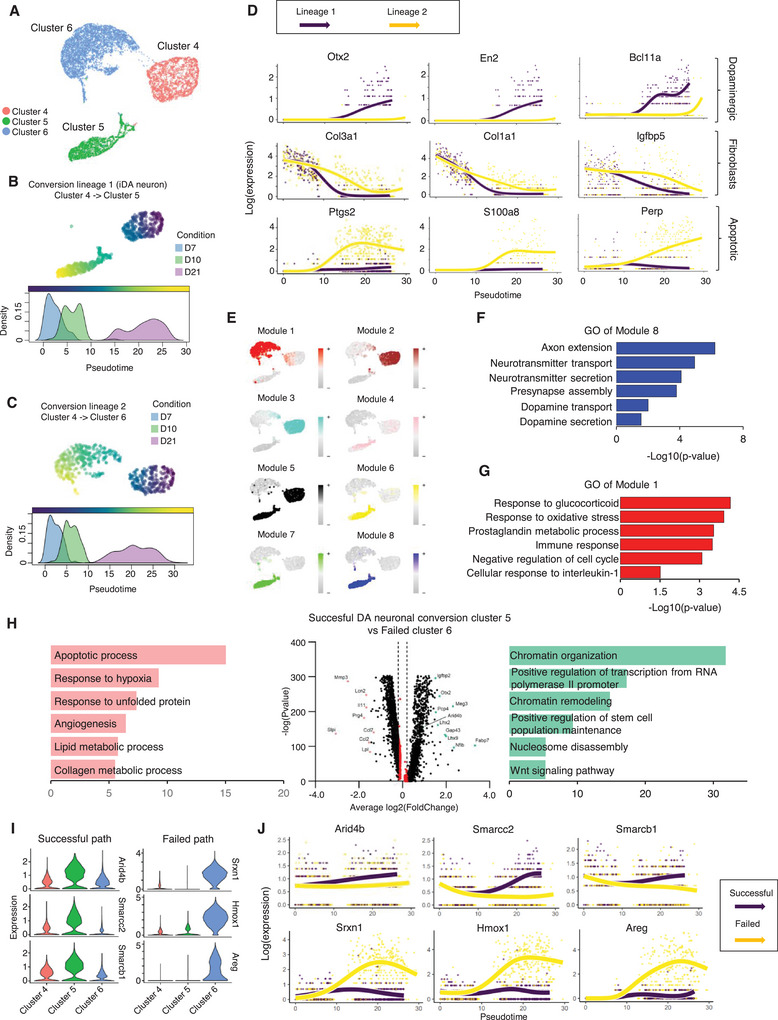
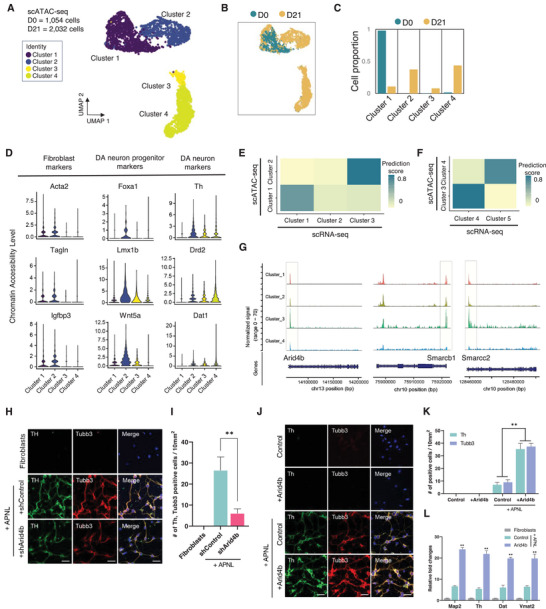
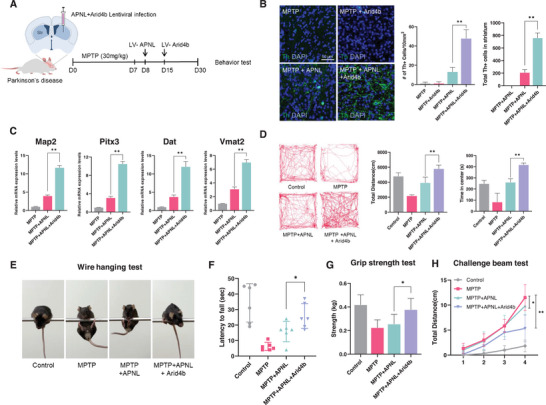
Direct lineage reprogramming into dopaminergic (DA) neurons holds great promise for the more effective production of DA neurons, offering potential therapeutic benefits for conditions such as Parkinson's disease. However, the reprogramming pathway for fully reprogrammed DA neurons remains largely unclear, resulting in immature and dead-end states with low efficiency. In this study, using single-cell RNA sequencing, the trajectory of reprogramming DA neurons at multiple time points, identifying a continuous pathway for their reprogramming is analyzed. It is identified that intermediate cell populations are crucial for resetting host cell fate during early DA neuronal reprogramming. Further, longitudinal dissection uncovered two distinct trajectories: one leading to successful reprogramming and the other to a dead end. Notably, Arid4b, a histone modifier, as a crucial regulator at this branch point, essential for the successful trajectory and acquisition of mature dopaminergic neuronal identity is identified. Consistently, overexpressing Arid4b in the DA neuronal reprogramming process increases the yield of iDA neurons and effectively reverses the disease phenotypes observed in the PD mouse brain. Thus, gaining insights into the cellular trajectory holds significant importance for devising regenerative medicine strategies, particularly in the context of addressing neurodegenerative disorders like Parkinson's disease.

Keywords: Parkinson disease; cellular trajectory; direct reprogramming; induced dopaminergic neuron.


Conflict of interest statement

The authors declare no conflict of interest.

Figures

Figure 1
Figure 1
Distinct conversion state of mouse embryonic fibroblasts to dopaminergic neuron by APNL. A) Experimental scheme for studying cellular dynamics of direct neuronal reprogramming by Ascl1, Pitx3, Nurr1, Lmx1a (APNL). B) UMAP visualization of 38262 cells, color‐coded into 6 clusters, from the D0(MEFs), D7, D10, and D21 batch after APNL infection (upper). Cell proportion of clusters across time points (below). C) Hierarchical clustering heatmap of scRNA‐seq data and gene ontology analysis for each cluster. D) A violin plot displaying expression levels of entire clusters through validated markers.[ 39 ] E) A dot plot validates iDA cluster through module scoring analysis using the public fibroblasts, induced neuron, and dopaminergic neurons markers[ 12 , 20 ] F) A Scatter plot showing cell distribution (D0, D7, D10, and D21) across fibroblast and DN features.
Figure 2
Figure 2
Erasure of fibroblast fate at the early onset of iDA Conversion. A) UMAP plot showing cell distribution across time points of direct reprogramming (D0, D7, D10, and D21). B) UMAP plot showing re‐clustering of sorted cluster 1, 2, and 3 in initial reprogramming (D0, D7, and D10). C) Violin plot displaying gradual reduction of fibroblast module score during initial reprogramming. D) A bar graph showing the total number of differential expression genes based on the comparison of clusters. E) Volcano plot showing differentially expressed genes in Cluster 2 compared with Cluster 1(Wilcoxon rank sum test; two‐sided, log(fc) threshold > 0.25 and log(fc) threshold < −0.25). F) Volcano plot showing differentially expressed genes in Cluster 3 compared with Cluster 1(Wilcoxon rank sum test; two‐sided, log(fc) threshold > 0.25 and log(fc) threshold < −0.25). G) Continuous initial reprogramming trajectory by slingshot‐based UMAP plot (upper). Density plot of initial reprogramming across three‐time points (below). H) Module feature plot showing each co‐expression module colored by each module's uniquely assigned color. I) Network plot showing co‐regulatory top 25 hub genes in the blue module. J) Visualization of smoothed expression patterns of hub genes in blue module, plotted on pseudotime.
Figure 3
Figure 3
Divergent reprogramming paths during the late stage of iDA conversion. A) UMAP plot showing re‐clustering of sorted clusters 4, 5, and 6 in end point reprogramming (D7, D10, and D21). B) Successful iDA reprogramming trajectory by slingshot‐based UMAP plot (upper). Density plot of Successful iDA reprogramming across three‐time points (below). C) Failed reprogramming trajectory by slingshot‐based UMAP plot (upper). Density plot of failed reprogramming across three‐time points (below). D) Visualization of smoothed expression patterns of representative signatures associated with dopaminergic neuron pathway, fibroblasts, and apoptotic process, plotted on pseudotime. E) Module feature plot showing each co‐expression module colored by each module's uniquely assigned color. F) A bar graph displaying GO terms of the blue module (module 8). G) A bar graph displaying GO terms of the red module (module 1). H) Volcano plot showing differentially expressed genes in Cluster 5 compared with Cluster 6 (Wilcoxon rank sum test; two‐sided, log(fc) threshold > 0.1 and log(fc) threshold < −0.1). I) Violin plot showing the expression level of three chromatin remodelers in the successful path and three representative genes of failed path. J) Visualization of smoothed expression patterns of three chromatin remodelers in successful iDA reprogramming trajectory and three representative genes of failed trajectory.
Figure 4
Figure 4
Single‐cell chromatin accessibility landscape in iDA conversion. A) UMAP visualization of 3086 cells in scATAC‐seq, color‐coded into five clusters, from the D0(MEFs), D7 batch after APNL infection. B) UMAP plot of scATAC‐seq displaying cell distribution across time points of direct reprogramming (D0, D7). C) Cell proportion of clusters across time points (D0, D7). D) Violin plot showing chromatin accessibility level of validated genes associated with pan‐fibroblast, dopaminergic neuron progenitor, and mature dopaminergic neuron markers. E) Heatmap showing annotation of scATAC‐seq clusters (Cluster 1, 2) based on label transfer of scRNA‐seq dataset (Cluster 1, 2, and 3). F) Heatmap showing annotation of scATAC‐seq clusters (Cluster 3, 4) based on label transfer of scRNA‐seq dataset (Cluster 4, 5). (G) Coverage plot showing normalized open chromatin signal in each cluster on Arid4b, Smarcb1, and Smarcc2 gene track. H) Immunofluorescence of DA neuronal marker Th and neuronal maker Tubb3 in iDAs at 20days after Ascl1, Nurr1, Pitx3, and Lmx1a (collectively, ANPL) along with shArid4b infection. Scale bar = 50 µm (Left). I) The bar chart shows the quantification data of Figure 4H. J) Immunofluorescence of DA neuronal marker Th and neuronal maker Tubb3 in iDAs at 20 days after FUW‐APNL along with FUW‐Arid4b infection. Scale bar = 50 µm. K) The bar chart shows the quantification data of Figure 4K. L) qRT‐PCR analysis of DA neuronal markers (Map2, Th, Dat, and Vmat2). Data represent mean ± SEM; two‐tailed Student's t‐test, * p < 0.05 and ** p < 0.005 (n = 3, independent samples per group).
Figure 5
Figure 5
Arid4b overexpression efficiently rescues Parkinson's disease phenotypes in MPTP‐induced PD mice by in vivo direct reprogramming. A) The schematic diagram depicts the procedures for direct reprogramming into induced dopaminergic neurons using Arid4b overexpression in the MPTP‐PD model. B) Representative image of the Th staining in the stratum treated with MPTP, MPTP/APNL, MPTP/Arid4b, and MPTP + ANPL/Arid4b. Scale bar = 25 µm (Left). The bar chart shows the quantification data (Right). C) qRT‐PCR analysis of DA neuronal markers (Map2, Pitx3, Dat, and Vmat2) in the APNL with Arid4b overexpressed in the striatum of the MPTP PD mouse. Expression levels are normalized to Gapdh. D) Digitally tracking the distance traveled and time spent in the central zone by mice subjected to the open field test. E) MPTP PD mouse behaviors after overexpression of APNL with Arid4b in the wire‐hanging test. Different views of a mouse during the test. F) The latency to fall in the wire‐hanging test. G) Values were measured using the forelimb grip strength test in mice treated with MPTP, MPTP/APNL, MPTP/Arid4b, and MPTP + ANPL/Arid4b. H) Number of errors per step on the challenging beam traversal in Control (Saline), MPTP, MPTP + ANPL, and MPTP + ANPL + Arid4b. Data represent mean ± SEM; two‐tailed Student's t‐test, * p < 0.05 and ** p < 0.005 (n = 3, independent samples per group).

Similar articles

Cited by

References

    1. Poewe W., Seppi K., Tanner C. M., Halliday G. M., Brundin P., Volkmann J., Schrag A.‐E., Lang A. E., Nat. Rev. Dis. Primers 2017, 3, 17013. - PubMed
    1. Davie C. A., Br. Med. Bull. 2008, 86, 109. - PubMed
    1. Armstrong M. J., Okun M. S., JAMA, J. Am. Med. Assoc. 2020, 323, 548. - PubMed
    1. Kim J., Su S. C., Wang H., Cheng A. W., Cassady J. P., Lodato, Lengner C. J., Chung C.‐Y., Dawlaty M. M., Tsai L.‐H., Jaenisch R., Cell Stem Cell 2011, 9, 413. - PMC - PubMed
    1. Pfisterer U., Kirkeby A., Torper O., Wood J., Nelander J., Dufour A., Björklund A., Lindvall O., Jakobsson J., Parmar M., Proc. Natl. Acad. Sci. USA 2011, 108, 10343. - PMC - PubMed

MeSH terms

Substances

LinkOut - more resources