Biallelic PTPMT1 variants disrupt cardiolipin metabolism and lead to a neurodevelopmental syndrome
- PMID: 39279645
- PMCID: PMC11788212
- DOI: 10.1093/brain/awae268
Biallelic PTPMT1 variants disrupt cardiolipin metabolism and lead to a neurodevelopmental syndrome
Abstract
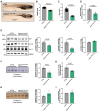
Primary mitochondrial diseases (PMDs) are among the most common inherited neurological disorders. They are caused by pathogenic variants in mitochondrial or nuclear DNA that disrupt mitochondrial structure and/or function, leading to impaired oxidative phosphorylation (OXPHOS). One emerging subcategory of PMDs involves defective phospholipid metabolism. Cardiolipin, the signature phospholipid of mitochondria, resides primarily in the inner mitochondrial membrane, where it is biosynthesized and remodelled via multiple enzymes and is fundamental to several aspects of mitochondrial biology. Genes that contribute to cardiolipin biosynthesis have recently been linked with PMD. However, the pathophysiological mechanisms that underpin human cardiolipin-related PMDs are not fully characterized. Here, we report six individuals, from three independent families, harbouring biallelic variants in PTPMT1, a mitochondrial tyrosine phosphatase required for de novo cardiolipin biosynthesis. All patients presented with a complex, neonatal/infantile onset neurological and neurodevelopmental syndrome comprising developmental delay, microcephaly, facial dysmorphism, epilepsy, spasticity, cerebellar ataxia and nystagmus, sensorineural hearing loss, optic atrophy and bulbar dysfunction. Brain MRI revealed a variable combination of corpus callosum thinning, cerebellar atrophy and white matter changes. Using patient-derived fibroblasts and skeletal muscle tissue, combined with cellular rescue experiments, we characterized the molecular defects associated with mutant PTPMT1 and confirmed the downstream pathogenic effects that loss of PTPMT1 has on mitochondrial structure and function. To further characterize the functional role of PTPMT1 in cardiolipin homeostasis, we created a ptpmt1 knockout zebrafish. This model had abnormalities in body size, developmental alterations, decreased total cardiolipin levels and OXPHOS deficiency. Together, these data indicate that loss of PTPMT1 function is associated with a new autosomal recessive PMD caused by impaired cardiolipin metabolism, highlighting the contribution of aberrant cardiolipin metabolism towards human disease and emphasizing the importance of normal cardiolipin homeostasis during neurodevelopment.
Keywords: cardiolipin; mitochondria; mitochondrial dynamics; neurodevelopmental syndrome; primary mitochondrial disease.
© The Author(s) 2024. Published by Oxford University Press on behalf of the Guarantors of Brain.
Conflict of interest statement
The authors report no competing interests.
Figures


References
-
- Chinnery PF. Primary mitochondrial disorders overview. In: Adam MP, Feldman J, Mirzaa GM, et al., eds. GeneReviews®. University of Washington; 1993-2024. https://www.ncbi.nlm.nih.gov/books/NBK1224/ - PubMed
-
- Keller MA. Interpreting phospholipid and cardiolipin profiles in rare mitochondrial diseases. Curr Opin Syst Biol. 2021;28:100383.
MeSH terms
Substances
Grants and funding
- Brain Research UK
- National Institute for Health Research
- Newcastle upon Tyne Hospitals NHS Foundation Trust
- Canada Research Chairs
- Muscular Dystrophy Canada
- BB_/Biotechnology and Biological Sciences Research Council/United Kingdom
- BRC-1215-20014/NIHR Cambridge Biomedical Research Centre
- Muscular Dystrophy Association
- Lily Foundation
- 203105/Z/16/Z/Wellcome Trust Centre for Mitochondrial Research
- Health Education England Genomics Education Programme
- G100142/Addenbrooke's Charitable Trust
- Muscular Dystrophy UK
- Action for A-T
- Multiple System Atrophy Trust
- OSR/0280/BENC/0048/Newcastle University
- 216S771/Newton-Katip Çelebi Fund
- G0800674/Wellcome Centre for Mitochondrial Research Patient Cohort
- University College London
- 109915/Z/15/Z/WT_/Wellcome Trust/United Kingdom
- CFI-JELF 38412/Canada Foundation for Innovation
- 950-232279/Canada Research Chair in Neuromuscular Genomics and Health
- Royal Free Charity
- MR/W019027/1/MRC_/Medical Research Council/United Kingdom
- Pathological Society of Great Britain and Ireland
- Stoneygate Trust
- MR/S002065/1/MRC_/Medical Research Council/United Kingdom
- Low and Middle Income Country award
- Official Development Assistance
- WT_/Wellcome Trust/United Kingdom
- NIHR Newcastle Biomedical Research Centre
- Clore Duffield Foundation
- Evelyn Trust
- Mito Foundation
- MR/N027302/1/Newton Fund
- Royal Free London NHS Foundation Trust
- MC_UU_00015/7/MRC_/Medical Research Council/United Kingdom
- LifeArc
- Turkish Academy of Sciences
- Rosetrees Trust
- 220S734/Türkiye Bilimsel ve Teknolojik Araştırma Kurumu (
- FDN-167281/CAPMC/ CIHR/Canada
- Fundación Ramón Areces
LinkOut - more resources
Full Text Sources
Medical
Molecular Biology Databases

