. 2024 Oct 11;135(9):910-932.
doi: 10.1161/CIRCRESAHA.124.324387. Epub 2024 Sep 16.

Chronic Activation of Tubulin Tyrosination Improves Heart Function

Affiliations

Chronic Activation of Tubulin Tyrosination Improves Heart Function

Niels Pietsch et al. Circ Res. .

Abstract

Background: Hypertrophic cardiomyopathy (HCM) is the most common cardiac genetic disorder caused by sarcomeric gene variants and associated with left ventricular hypertrophy and diastolic dysfunction. The role of the microtubule network has recently gained interest with the findings that microtubule detyrosination (dTyr-MT) is markedly elevated in heart failure. Acute reduction of dTyr-MT by inhibition of the detyrosinase (VASH [vasohibin]/SVBP [small VASH-binding protein] complex) or activation of the tyrosinase (TTL [tubulin tyrosine ligase]) markedly improved contractility and reduced stiffness in human failing cardiomyocytes and thus posed a new perspective for HCM treatment. In this study, we tested the impact of chronic tubulin tyrosination in an HCM mouse model (Mybpc3 knock-in), in human HCM cardiomyocytes, and in SVBP-deficient human engineered heart tissues (EHTs).

Methods: Adeno-associated virus serotype 9-mediated TTL transfer was applied in neonatal wild-type rodents, in 3-week-old knock-in mice, and in HCM human induced pluripotent stem cell-derived cardiomyocytes.

Results: We show (1) TTL for 6 weeks dose dependently reduced dTyr-MT and improved contractility without affecting cytosolic calcium transients in wild-type cardiomyocytes; (2) TTL for 12 weeks reduced the abundance of dTyr-MT in the myocardium, improved diastolic filling, compliance, cardiac output, and stroke volume in knock-in mice; (3) TTL for 10 days normalized cell area in HCM human induced pluripotent stem cell-derived cardiomyocytes; (4) TTL overexpression activated transcription of tubulins and other cytoskeleton components but did not significantly impact the proteome in knock-in mice; (5) SVBP-deficient EHTs exhibited reduced dTyr-MT levels, higher force, and faster relaxation than TTL-deficient and wild-type EHTs. RNA sequencing and mass spectrometry analysis revealed distinct enrichment of cardiomyocyte components and pathways in SVBP-deficient versus TTL-deficient EHTs.

Conclusions: This study provides the first proof of concept that chronic activation of tubulin tyrosination in HCM mice and in human EHTs improves heart function and holds promise for targeting the nonsarcomeric cytoskeleton in heart disease.

Keywords: cardiomyopathy, hypertrophic; induced pluripotent stem cells; microtubules; myocardium.


Conflict of interest statement

L. Carrier is a member of Scientific Advisory Board of and has shares in the company DiNAQOR AG (https://www.dinaqor.com/). B.L. Prosser is an inventor on a pending US patent application number 15/959181 for “Composition and Methods for Improving Heart Function and Treating Heart Failure.” The other authors report no conflicts.

Figures

Figure 1.
Figure 1.
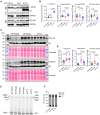
Effect of chronic TTL (tubulin tyrosine ligase) overexpression in wild-type rodents and analysis of isolated cardiomyocytes. A, Protocol: wild-type neonatal male mice (postnatal day 2 [P2]) received either an adeno-associated virus serotype 9 (AAV9) encoding TTL-dsRed at a low (1.75E11 vg/g, N=3) or high dose (9E11 vg/g, N=3) or a sham injection (N=2). After 6 weeks, ventricular myocardium was harvested. B, Representative Western blot of crude proteins stained for detyrosinated tubulin (dTyr-tub), total α-tubulin, TTL, dsRed (Discosoma sp. red fluorescent protein), and GAPDH as a loading control, and quantification of TTL/GAPDH, α-tubulin/GAPDH, dTyr-tub/GAPDH, and dTyr-tub/α-tubulin; molecular weight units are given in kDa. C, Correlation between dsRed protein level (measured via Western blot) and dTyr-tub levels from the same hearts in B. D, Percentage of cardiomyocytes expressing no/low, medium, or high dsRed intensity after application of AAV9-TTL-dsRed of 4.4E11 vg/g in mice. E, Protocol: wild-type neonatal Sprague-Dawley rats (P4) received an AAV9 encoding TTL-dsRed at an intermediate dose (4.4E11 vg/g, N=3). After 6 weeks, single ventricular myocytes were isolated and functionally assessed. Following assessment, myocytes were binned into tertiles based on no/low, medium, or high level of TTL (indicated by dsRed fluorescence intensity). F, Myocyte stiffness (elastic modulus) measured via transverse nanoindentation. G, Sarcomere shortening representative traces and quantification of fractional shortening, contraction, and relaxation velocity. H, Calcium transient representative traces and quantification of amplitude, rise time, and decay time. Data are expressed as mean±SEM with N/n representing the number of analyzed mice and cardiomyocytes, respectively. Statistical significance was assessed with the Kruskal-Wallis test and Dunn multiple comparisons test (B) or with 1-way ANOVA and Dunnett multiple comparisons test (F–H). ns, P>0.05. N/n indicates number of analyzed mice and cardiomyocytes, respectively.
Figure 2.
Figure 2.
Evaluation of the cardiac phenotype by echocardiography after AAV9-TTL/-Empty treatment. A, Protocol: 3-week-old wild-type (WT) and Mybpc3-targeted knock-in (KI) mice were included in the study. Mice received a dose of 2.25E11 vg/g of either AAV9-Empty (no insert) or AAV9-TTL (hemagglutinin [HA]-tagged human TTL) under the control of human cTnT (TNNT2 [tropinin T2, cardiac type]) promoter for 12 weeks. B, Cardiac output (CO) over time. C, Left ventricular mass (LVM)/body weight (BW) ratio over time. Evaluation after 12 weeks of (D) CO, (E) Stroke volume (SV) and (F) Ejection fraction (EF). Difference in value per mouse between the last and basal echocardiography for (G) CO (ΔCO), (H) SV (ΔSV), and (I) EF (ΔEF). J, Left ventricular area in end diastole after 12 weeks. K, Left ventricular area in end systole after 12 weeks. Data are expressed as mean±SEM. Statistical significance was assessed vs KI-Empty by fitting a mixed-effect model with the Geisser-Greenhouse correction (B and C) or by 1-way ANOVA (D–K), followed by Dunnett multiple comparisons test, with N/F/M=12/7/5 (WT-Empty) and N/F/M=12/10/2 (KI-Empty). AAV9 indicates adeno-associated virus serotype 9; N/F/M, number of mice/female/male; TTL, tubulin tyrosine ligase; and Tx, treatment.
Figure 3.
Figure 3.
Evaluation of the cardiac phenotype by hemodynamics after a 12-week AAV9-TTL/-Empty treatment. Three-week-old wild-type (WT) and Mybpc3-targeted knock-in (KI) mice received either AAV9-Empty (no insert) or AAV9-TTL (HA-tagged human TTL). Global function is represented by (A) cardiac output (CO), (B) stroke volume (SV), and (C) stroke work (SW). Contractility is represented by (D) ejection fraction (EF) and (E) maximum rate of left ventricular (LV) pressure change (dP/dtmax). Relaxation is represented by (F) minimal rate of LV pressure change (dP/dtmin) and (G) time constant of active relaxation (τ), calculated with the Weiss method. LV filling is represented by (H) minimal rate of LV volume change (dV/dtmin), (I) LV end-diastolic volume (LVEDV), and (J) LV end-systolic volume (LVESV). Stiffness is represented by (K) LV end-diastolic pressure (LVEDP) and (L) compliance. M, Pressure/volume (PV) loop traced after increasing occlusion in a representative mouse of each performed group. N, End-diastolic pressure-volume relation (EDPVR) calculated with a linear fit. Data are expressed as mean±SEM. Statistical significance was assessed in A through L with 1-way ANOVA and Dunnett multiple comparisons test (A–L), with N/F/M=9/5/4 (WT-Empty), 9/7/2 (KI-Empty), and 11/6/5 (KI-TTL); to pass the normality test, some outliers (robust regression and outlier removal [ROUT] 1%) were removed: 1 KI-TTL (H), 2 KI-Empty, and 1 KI-TTL (K). Statistical significance was assessed in N with Kruskal-Wallis test and Dunn multiple comparisons test with N/F/M=5/3/2 (WT-Empty), 5/4/1 (KI-Empty), and 7/3/4 (KI-TTL). ns, P>0.05. AAV9 indicates adeno-associated virus serotype 9; HA, hemagglutinin; N/F/M, number of mice/female/male; and TTL, tubulin tyrosine ligase.
Figure 4.
Figure 4.
Molecular evaluation of tubulin detyrosination and titin isoforms in mice. A, Representative Western blot of cardiac soluble (cytosolic) proteins stained for α-tubulin, TTL (tubulin tyrosine ligase), detyrosinated tubulin (dTyr-tub), and GAPDH as a loading control in WT-Empty (WT-E), KI-Empty (KI-E), and KI-TTL mice; dashed line indicates where the blots were cut. B, Protein levels of TTL/GAPDH, α-tubulin/GAPDH, dTyr-tub/GAPDH, and dTyr-tub/α-tubulin in WT-Empty (N/F/M=11/7/4), KI-Empty (N/F/M=9/8/1), and KI-TTL (N/F/M=11/6/5). C, Representative Western blot of cardiac insoluble proteins (SDS extracted) stained for dTyr-tub, α-tubulin, and H3 (histone H3) as a loading control, and the respective Ponceau staining. D, Protein levels of α-tubulin/H3, dTyr-tub/H3, and dTyr-tub/α-tubulin in WT-Empty (N/F/M=11/7/4), KI-Empty (N/F/M=9/8/1), and KI-TTL (N/F/M=11/6/5) samples. E, Representative SYPRO Ruby–stained agarose gel of cardiac crude protein fractions showing titin (isoforms N2BA, N2B, and T2) and myosin heavy chain (MHC). F, Percentage of N2BA, N2B, and T2 isoforms normalized to MHC, with N=5, 8, and 8 in WT-Empty, KI-Empty, and KI-TTL, respectively. Data are expressed as mean±SEM and relative to the mean of WT-Empty. Statistical significance vs KI-Empty was assessed with 1-way ANOVA and Dunnett multiple comparisons test. Two KI-Empty samples were removed for the quantification (B and D) because the insoluble proteins were degraded. ns, P>0.05. KI indicates knock-in; MW, molecular weight; N/F/M, number of mice/female/male; and WT, wild type.
Figure 5.
Figure 5.
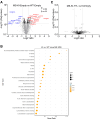
RNA-sequencing (RNA-seq) analysis in mouse hearts. RNA-seq analysis was performed in female mouse LV tissue extracts (N=3). Volcano plots show the −log10 (Padj value) vs the magnitude of change (log2 ratio=log2[case]−log2[reference]) of (A) mRNA levels in KI-Empty vs WT-Empty and (B) mRNA levels in KI-TTL vs KI-Empty. Light gray dots indicate Padj>0.05, and black dots indicate Padj<0.05. Dot plot of the gene ontology (GO) pathway enrichment map based on RNA-seq with significantly overrepresented pathways (Padj<0.05) in (C) KI-Empty vs WT-Empty (log2 ratio, >0.58) and (D) KI-TTL vs KI-Empty (log2 ratio, >0.58 or <−0.58). The dot size is proportional to the number of gene counts, the x axis shows the gene ratio, and the heatmap color shows the extent of Padj values from the lowest (orange) to the highest (blue). Specific mRNA levels of (E) tubulins, (F) tubulin detyrosinases, (G) tubulin polyglutamylases, (H) dyneins, (I) dynactins, (J) kinesins, (K) CLIPs (CAP-Gly domain-containing linker proteins), (L) MAPs (microtubule-associated proteins), and microtubule-associated protein RP/EB family members (MAPREs). Data are expressed as log2±SEM over mean of WT-Empty. Statistical significance was assessed for each gene of interest vs KI-Empty with Kruskal-Wallis test and Dunn multiple comparisons. ns, P>0.08. KI indicates knock-in; LV, left ventricle; N, number of mice; TTL, tubulin tyrosine ligase; and WT, wild type.
Figure 6.
Figure 6.
Proteomic analysis in mouse hearts. Mass spectrometry (MS) analyses were performed in insoluble protein fraction from LV tissue of WT-Empty (N/F/M=11/7/4), KI-Empty (N/F/M=9/8/1), and KI-TTL (N/F/M=10/5/5). A, Volcano plots show the −log10 (Padj value) vs the magnitude of change (log2 ratio=log2[case]−log2[reference]) of protein levels in KI-Empty vs WT-Empty. Light gray dots indicate Padj>0.05, and black dots indicate Padj<0.05. B, Dot plot of the gene ontology (GO) pathway enrichment map based on MS performed on insoluble LV protein fractions with significantly overrepresented pathways (Padj<0.05) in KI-Empty vs WT-Empty (log2 ratio, >0.58). The dot size is proportional to the number of gene counts, the x axis shows the gene ratio, and the heatmap color shows the extent of Padj values from the lowest (orange) to the highest (blue). C, Volcano plots show the −log10(Padj value) vs log2 ratio of protein levels in KI-TTL vs KI-Empty. KI indicates knock-in; LV, left ventricle; N/F/M, number of mice/female/male; TTL, tubulin tyrosine ligase; and WT, wild type.
Figure 7.
Figure 7.
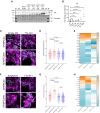
Evaluation of adeno-associated virus serotype 9 (AAV9)–mediated TTL (tubulin tyrosine ligase) transfer in MYBPC3 isogenic control (MYBPC3ic) and heterozygous MYBPC3 (MYBPC3het) human induced pluripotent stem cell (hiPSC)–derived cardiomyocytes. MYBPC3ic hiPSC line was differentiated into cardiomyocytes for 2 weeks and then nontransduced (NT), transduced with AAV9-Empty (multiplicity of infection [MOI], 30 k), or transduced with AAV9-TTL (MOI, 3 k to 100 k) for 7 days. A, Representative Western blot of MYBPC3ic crude protein fractions stained for TTL and respective Ponceau. B, Quantification of TTL protein levels normalized to Ponceau and related to NT mean in MYBPC3ic hiPSC-CMs (n/d=3/1). MYBPC3ic and MYBPC3het hiPSC lines were differentiated into cardiomyocytes for 2 weeks and then transduced with AAV9-Empty or AAV9-TTL (MOI, 100 k) for 10 days in the presence of H2O (control [ctrl]; C–E) or 100 nmol/L ET1 (endothelin-1; F–H) for the last 3 days. Representative immunofluorescence analysis of MYBPC3ic and MYBPC3het hiPSC-CMs transduced with AAV9-Empty or AAV9-TTL for 10 days in (C) basal condition or (F) after stimulation with ET1; hiPSC-CMs were stained for ACTN2 (α-actinin-2; purple), N-cadherin (N-Cad; green), and DAPI (4′,6-diamidino-2-phenylindole; blue). Scale bar=100 µm. Quantification of cell area in hiPSC-CMs (n/d=3/1) in (D) basal condition (N/n/d=758/3/1 [MYBPC3ic-Empty], 869/3/1 [MYBPC3ic-TTL], 336/3/1 [MYBPC3het-Empty], and 375/3/1 [MYBPC3het-TTL]) or (G) after stimulation with ET1 (N/n/d=705/3/1 [MYBPC3ic-Empty], 860/3/1 [MYBPC3ic-TTL], 210/3/1 [MYBPC3het-Empty], and 315/3/1 [MYBPC3het-TTL]). Selected hits of dysregulated RNA counts obtained with the nanostring analysis in (E) basal condition (ctrl) or (H) after stimulation with ET1 (N/n/d=9/3/3). Data are expressed as mean±SEM. Statistical significance was assessed with the Kruskal-Wallis test and Dunn multiple comparisons test. ns, P>0.05. N/n/d indicates number of cells/wells/differentiations; and NT, nontransduced.
Figure 8.
Figure 8.
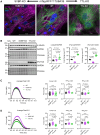
Evaluation of SVBP-KO and TTL-KO human induced pluripotent stem cell (hiPSC)–derived cardiomyocytes and engineered heart tissues (EHTs). SVBP-KO and TTL-KO hiPSC lines were created from a control wild-type (WT) hiPSC line (mTag-RFP-T-TUBA1B [tubulin alpha 1b]) with CRISPR/Cas9 (clustered regularly interspaced short palindromic repeats/clustered regularly interspaced short palindromic repeat–associated protein 9) genetic tools and differentiated into cardiomyocytes and EHTs. A, Immunofluorescence analysis of 30-day-old SVBP-KO, WT, and TTL-KO hiPSC-derived cardiomyocytes stained for ACTN2 (α-actinin-2; purple), detyrosinated tubulin (dTyr-tub; green), and DAPI (4′,6-diamidino-2-phenylindole; blue). Scale bar=50 µm. B, Western blot was performed on crude protein fractions of 30-day-old hiPSC-derived cardiomyocytes and stained for α-tubulin, dTyr-tub, GAPDH, and Ponceau. Quantification of protein levels of α-tubulin/GAPDH, dTyr-tub/GAPDH, and dTyr-tub/α-tubulin relative to WT mean; N/d=10/2 (WT), 8/2 (SBBP-KO), and 8/2 (TTL-KO). hiPSC-derived cardiomyocytes were cast in EHTs and cultivated for 60 days. Measurements of average peak, force amplitude, time to 50% of peak (TTP50), and time to 50% relaxation (RT50) of 60-day-old EHTs cast on (C) standard posts (0.28 mN/mm; N/d=75/6 [WT], 33/5 [SVBP-KO], and 17/2 [TTL-KO]) or on (D) afterload enhanced posts (0.8 mN/mm; N/d=54/6 [WT], 33/5 [SVBP-KO], and 38/5 [TTL-KO]). Data are expressed as mean±SEM. Statistical significance was assessed with Brown-Forsythe and Welch ANOVA test and Dunnett T3 multiple comparisons test (B) and with Kruskal-Wallis test and Dunn multiple comparisons test (C and D). ns, P>0.05. KO indicates knockout; N/d, number of samples/differentiations; SVBP, small vasohibin-binding protein; and TTL, tubulin tyrosine ligase.

Update of

References

    1. Carrier L. Targeting the population for gene therapy with MYBPC3. J Mol Cell Cardiol. 2021;150:101–108. doi: 10.1016/j.yjmcc.2020.10.003 - PubMed
    1. Robison P, Caporizzo MA, Ahmadzadeh H, Bogush AI, Chen CY, Margulies KB, Shenoy VB, Prosser BL. Detyrosinated microtubules buckle and bear load in contracting cardiomyocytes. Science. 2016;352:aaf0659. doi: 10.1126/science.aaf0659 - PMC - PubMed
    1. Schuldt M, Pei J, Harakalova M, Dorsch LM, Schlossarek S, Mokry M, Knol JC, Pham TV, Schelfhorst T, Piersma SR, et al. Proteomic and functional studies reveal detyrosinated tubulin as treatment target in sarcomere mutation-induced hypertrophic cardiomyopathy. Circ Heart Fail. 2021;14:e007022. doi: 10.1161/CIRCHEARTFAILURE.120.007022 - PMC - PubMed
    1. Sanyal C, Pietsch N, Ramirez Rios S, Peris L, Carrier L, Moutin MJ. The detyrosination/re-tyrosination cycle of tubulin and its role and dysfunction in neurons and cardiomyocytes. Semin Cell Dev Biol. 2023;137:46–62. doi: 10.1016/j.semcdb.2021.12.006 - PubMed
    1. Caporizzo MA, Chen CY, Prosser BL. Cardiac microtubules in health and heart disease. Exp Biol Med (Maywood). 2019;244:1255–1272. doi: 10.1177/1535370219868960 - PMC - PubMed