. 2024 Sep 13;14(9):e70262.
doi: 10.1002/ece3.70262. eCollection 2024 Sep.

Mitonuclear and phenotypic discordance in an Atlantic Forest frog hybrid zone

Affiliations

Mitonuclear and phenotypic discordance in an Atlantic Forest frog hybrid zone

Fábio P de Sá et al. Ecol Evol. .

Abstract

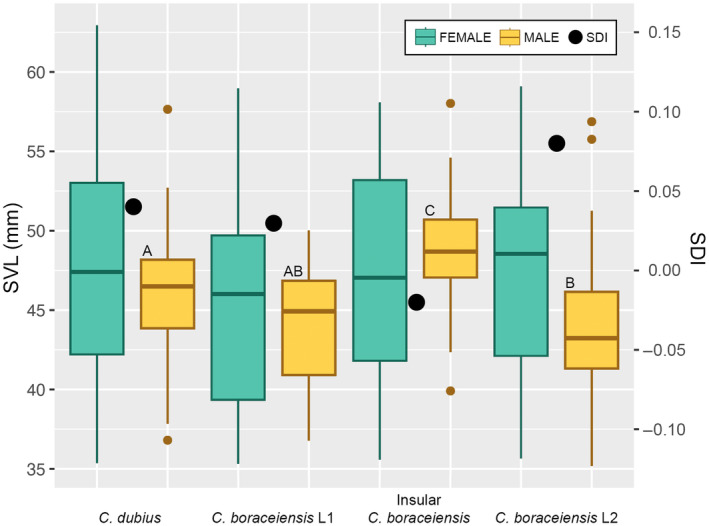
Discordance between mitochondrial and nuclear DNA is common among animals and can be the result of a number of evolutionary processes, including incomplete lineage sorting and introgression. Particularly relevant in contact zones, mitonuclear discordance is expected because the mitochondrial genome is haploid and primarily uniparentally inherited, whereas nuclear loci are evolving at slower rates. In addition, when closely related taxa come together in hybrid zones, the distribution of diagnostic phenotypic characters and their concordance with the mitochondrial or nuclear lineages can also inform on historical and ongoing dynamics within hybrid zones. Overall, genetic and phenotypic discordances provide evidence for evolutionary divergence and processes that maintain boundaries among sister species or lineages. In this study, we characterized patterns of genetic and phenotypic variation in a contact zone between Cycloramphus dubius and Cycloramphus boraceiensis, two sister species of frogs endemic to the Atlantic Coastal Forest of Brazil. We examined genomic-scale nuclear diversification across 19 populations, encompassing the two parental forms and a contact zone between them. We compared the distribution of genomic DNA variability with that of a mitochondrial locus (16S) and two morphological traits (dorsal tubercles and body size). Our results reveal multiple divergent lineages with ongoing admixture. We detected discordance in patterns of introgression across the three data types. Cycloramphus dubius males are significantly larger than C. boraceiensis males, and we posit that competition among males in the hybrid zone, coupled with mate choice by females, may be one mechanism leading to patterns of introgression observed between the species.

Keywords: anuran; body size; intrasexual competition; introgression; mitonuclear discordance; sexual selection.


Conflict of interest statement

The authors declare that there are no conflicts of interest.

Figures

FIGURE 1
FIGURE 1
Population sampling of Cycloramphus dubius and Cycloramphus boraceiensis in the states of São Paulo and Rio de Janeiro, southeastern Brazil. Based on mtDNA and nuDNA, C. dubius occurs at sites 1–11, lineage C. boraceiensis L1 at sites 12–13, insular C. boraceiensis population at site 14, and C. boraceiensis L2 at sites 15–19. Numbered populations are defined in Table 1. Images are representatives of each species, which are distinguished based on dorsal morphology (Heyer, 1983). Cycloramphus dubius lacks distinct dorsal white tubercles that are present in C. boraceiensis (white arrow points to a white tubercle). Numbered circles represent sampled populations and are color‐coded according to the proportions of the three dorsal morphologies: Orange represents the morphology typical of C. dubius, blue represents the morphology typical of C. boraceiensis, and black represents the intermediate morphology. Numbered circles are sized according to the sample sizes of specimens examined for dorsal morphology (Table 1). Populations 9, 10, and 11 exhibit the three dorsal morphologies, so their circles are enlarged inside the white box for easier visualization.
FIGURE 2
FIGURE 2
TCS haplotype network based on the alignment of 615 bps of the mitochondrial gene 16S, showing the relationships among all haplotypes of Cycloramphus dubius and Cycloramphus boraceiensis (C. boraceiensis L1 + insular population and C. boraceiensis L2). Open circles correspond to missing (or hypothetical) haplotypes and each line between two haplotypes represents one mutational step. Circle sizes depict frequency of haplotypes. The three main haplogroups are encompassed by the light gray boxes. Numbered populations are defined in Table 1.
FIGURE 3
FIGURE 3
Summary of nuDNA population genetic structure of Cycloramphus dubius and Cycloramphus boraceiensis (C. boraceiensis L1, C. boraceiensis insular population, and C. boraceiensis L2) based on principal component axis one (PC1) and axis two (PC2) for (a) the full dataset, and (b) dataset with the insular site 14 (IBEL) removed. These axes combined explain over a third of the genotypic variation estimated for 5972 variable nucleotides (SNPs). Points denote individuals and are colored based on majority membership to one of four demes. (c) Bar plot of admixture proportions for K = 4. Each bar corresponds to an individual and each colored segment depicts the proportion of an individual genome inherited from one of the inferred source populations. White vertical spaces separate sampling sites. Numbered populations are defined in Table 1.
FIGURE 4
FIGURE 4
Pairwise hybrid ancestry plots showing the relationship between admixture proportion (x‐axes; q) and the fraction of loci at which individuals have ancestry from one of two parental populations (y‐axes; Q12) for Cycloramphus dubius and two lineages of Cycloramphus boraceiensis (C. boraceiensis L1 and C. boraceiensis L2). Points denote individuals and are colored based on majority membership to one of three demes. F1 hybrids are intermediate in their hybrid ancestry but heterozygous at most of the loci, and therefore fall toward the top of the triangles. Similarly, F2 hybrids have a similar genome‐wide level of ancestry, but lower interpopulation ancestry, and fall within the center of the triangle. Backcrossed individuals fall toward the left and right sides of the triangle. Individuals that fall along the x‐axis (intermediate admixture proportions, with no interpopulation ancestry) are interpreted as geographic isolation by distance (Gompert & Buerkle, 2016). Numbered populations are defined in Table 1.
FIGURE 5
FIGURE 5
Populations trees for Cycloramphus dubius and Cycloramphus boraceiensis (C. boraceiensis L1, C. boraceiensis insular population, and C. boraceiensis L2) using a reduced SNP dataset and with only 48 individuals. (a) The posterior distribution of gene trees indicate overall ambiguous relationships among populations, as showed in our cloudogram. (b) SNAPP provides full posterior support only for the insular C. boraceiensis and C. boraceiensis L2, as showed our MCC tree. Populations are fully defined in Table 1.
FIGURE 6
FIGURE 6
Body sizes by sex and SDIs (=size dimorphism indices; see 2. Materials and Methods for details), all grouped by recovered genetic clusters. Cycloramphus dubius occurs from PTOL to BIRI (sites 1–11); southwestern Cycloramphus boraceiensis lineage (C. boraceiensis L1) occurs in SALE and SSEB (sites 12–13); insular C. boraceiensis population occurs in IBEL (site 14); and northeastern C. boraceiensis lineage (C. boraceiensis L2) occurs from CARA to PARA (sites 15–19). See Figure 1 for site location on map. Numbered populations and sample sizes are fully defined in Table 1. Whereas females are all the same size, males show more variability and statistical differences (different sizes separated by letters A, B, and C on boxes; see results for details).
FIGURE 7
FIGURE 7
Best‐supported cline models for mitochondrial haplotypes (in red; mtDNA haplotype), genome‐wide admixture proportions based on K = 1 (in yellow; SNP admixture, q), and (in blue) dorsal morphologies of Cycloramphus dubius and Cycloramphus boraceiensis. Dotted lines indicate cline centers, and colored shaded areas indicate the confidence intervals.

References

    1. Akopyan, M. , Gompert, Z. , Klonoski, K. , Vega, A. , Kaiser, K. , Mackelprang, R. , Rosenblum, E. B. , & Robertson, J. M. (2020). Genetic and phenotypic evidence of a contact zone between divergent colour morphs of the iconic red‐eyed treefrog. Molecular Ecology, 29(22), 4442–4456. 10.1111/mec.15639 - DOI - PubMed
    1. Amaral, F. R. , Albers, P. K. , Edwards, S. V. , & Miyaki, C. Y. (2013). Multilocus tests of Pleistocene refugia and ancient divergence in a pair of Atlantic Forest antbirds (Myrmeciza). Molecular Ecology, 22(15), 3996–4013. 10.1111/mec.12361 - DOI - PubMed
    1. Amaral, F. R. , Alvarado‐Serrano, D. F. , Maldonado‐Coelho, M. , Pellegrino, K. C. M. , Miyaki, C. Y. , Montesanti, J. A. C. , Lima‐Ribeiro, M. S. , Hickerson, M. J. , & Thom, G. (2018). Climate explains recent population divergence, introgression, and persistence in tropical mountains: Phylogenomic evidence from Atlantic Forest warbling finches. bioRxiv, 2018, 439265. 10.1101/439265. - DOI
    1. Amaro, R. C. , Rodrigues, M. T. , Yonenaga‐Yassuda, Y. , & Carnaval, A. C. (2012). Demographic processes in the montane Atlantic rainforest: Molecular and cytogenetic evidence from the endemic frog Proceratophrys boiei . Molecular Phylogenetics and Evolution, 62(3), 880–888. 10.1016/j.ympev.2011.11.004 - DOI - PubMed
    1. Anderson, E. (1948). Hybridization of the habitat. Evolution, 2(1), 1–9. 10.2307/2405610 - DOI

LinkOut - more resources