. 2024 Mar 22;86(4):1013-1044.
doi: 10.1093/jrsssb/qkae023. eCollection 2024 Sep.

Interpretable discriminant analysis for functional data supported on random nonlinear domains with an application to Alzheimer's disease

Collaborators, Affiliations

Interpretable discriminant analysis for functional data supported on random nonlinear domains with an application to Alzheimer's disease

Eardi Lila et al. J R Stat Soc Series B Stat Methodol. .

Abstract

We introduce a novel framework for the classification of functional data supported on nonlinear, and possibly random, manifold domains. The motivating application is the identification of subjects with Alzheimer's disease from their cortical surface geometry and associated cortical thickness map. The proposed model is based upon a reformulation of the classification problem as a regularized multivariate functional linear regression model. This allows us to adopt a direct approach to the estimation of the most discriminant direction while controlling for its complexity with appropriate differential regularization. Our approach does not require prior estimation of the covariance structure of the functional predictors, which is computationally prohibitive in our application setting. We provide a theoretical analysis of the out-of-sample prediction error of the proposed model and explore the finite sample performance in a simulation setting. We apply the proposed method to a pooled dataset from Alzheimer's Disease Neuroimaging Initiative and Parkinson's Progression Markers Initiative. Through this application, we identify discriminant directions that capture both cortical geometric and thickness predictive features of Alzheimer's disease that are consistent with the existing neuroscience literature.

Keywords: functional classification; manifold data analysis; neuroimaging; shape data analysis.


Conflict of interest statement

Conflict of interest: None declared.

Figures
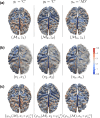
Figure 1.
Figure 1.
Panel a: FoSs of three subjects in the training sample, where gi{C,AD} denotes the disease state of the ith individual (C, Control; AD, Alzheimer’s Disease), Mi is a two-dimensional manifold encoding the geometry of the cerebral cortex, and zi:MiR is a real function, supported on Mi, describing cortical thickness (in mm). Panel b: Linear representation (vi,xi) of each FoS (Mi,zi) shown in Panel a. Here vi:R3R3 is a vector-valued function encoding the geometry of the ith individual. This is depicted as a collection of 3D vectors {vi(pj)} for a dense set of points {pj}R3. For clarity, the function vi is displayed only on half of its domain R3. The function xi:MR describes the spatially normalized thickness map of the ith individual on the fixed template M. Panel c: FoS (φvi(M),xiφvi1) parametrized by the associated functions (vi,xi) in Panel b. This is a close approximation of the FoS (Mi,zi) in Panel a.
Figure 2.
Figure 2.
On the left-hand side, we show an element of the FE basis {ψl:MTR,l=1,,s}. This is a scalar affine function within each triangle of the mesh MT that takes value 1 on a fixed vertex and value 0 on every other vertex. On the right-hand side, we show an element of the basis {R3KR3(p,)vi(p)dp,i=1,,n}. This is a smooth vector-valued function from R3 to R3.
Figure 3.
Figure 3.
On the left-hand side, we show the most discriminant geometric and thickness directions as estimated from the linear representations {(viv¯,xix¯)}. These are a vector field β^G:R3R3, representing the most predictive geometric pattern of AD, and a function β^F:MR, representing the most predictive cortical thickness pattern of AD. For a new FoS, with linear representation (v*,x*), we compute the score v*v¯,β^G+x*x¯,β^F and predict whether the subject has AD by comparing the score value with a predetermined threshold cth. On the right-hand side, we depict the process of mapping back the estimates β^G and β^F to the space of FoSs. On the same space, we also pictorially map the classification rule adopted. In the β^F figure, the blue regions represent the areas of the cortical surface where a thinner cortex, relative to the population average, is indicative of AD. These are mostly localized in the lateral temporal, entorhinal, inferior parietal, precuneus, and posterior cingulate cortices. The red arrows in the β^G figure represent the regions where differences in the morphological configuration of the cerebral cortex, compared to the population average, are most predictive of AD. The specific types of morphological changes can be inspected by comparing the surfaces φv¯c1β^G(M) and φv¯+c1β^G(M), on the right hand side diagram.
Figure 4.
Figure 4.
On the left side, we show the discriminant direction derived from applying a ridge logistic regression model to the thickness maps. In the centre, we show the discriminant direction resulting from fitting the proposed model in equation (10) to the thickness maps. Although it does not account for subject-specific geometric variations, this model enforces smoothness. On the right side, we have the cortical thickness discriminant direction obtained by fitting the model in equation (15), which explicitly accounts for inter-subject geometric differences. The results of the logistic regression are more difficult to interpret due to the high spatial variability. The model in equation (10) provides more interpretable results thanks to its smoothness penalty, but suggests that a thicker cortex in the red areas is indicative of AD, which is not physiologically plausible. When we explicitly model geometric differences, this evidence seems to disappear. This suggests that there is a non-negligible dependence structure between the predictors modelling geometry and those modelling thickness. Differences that seemed to be related to cortical thickness in the model without the geometric component are now captured by the term that models cortical geometric variations. Furthermore, when we model inter-subject geometric differences the entorhinal cortex atrophy in the medial temporal lobe is identified as the strongest predictor of AD. This is consistent with pathological findings and staging of early AD (Braak et al., 2006).
Figure A1.
Figure A1.
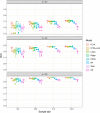
Results of the simulation study to assess the performance of our proposed method, under the assumption of homogeneous covariances, for various sample sizes (n=128,256,512,1024) and signal-to-noise ratios (α=0.2,0.4,0.6), where α reflects the strength of the discriminant signal. Prediction accuracy is measured using AUC and the simulations were repeated 50 times for each setting.
Figure A2.
Figure A2.
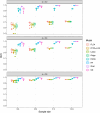
Results of the simulation study for heterogeneous covariance structures across different sample sizes (n=128,256,512,1024) and signal-to-noise ratios (α=0.2,0.4,0.6), where α reflects the strength of the discriminant signal. The prediction accuracy was evaluated through AUC and the simulations were repeated 50 times for each setting.
Figure A3.
Figure A3.
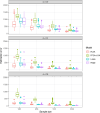
Results of the simulation study to compare the performance of the different linear methods considered, using homogeneous covariances, for various sample sizes (n=128,256,512,1024) and signal-to-noise ratios (α=0.2,0.4,0.6). Here, we measure the performance using the estimation error β^β0L2(M)2, with β^ an appropriately normalized version of the estimate of the true functional parameter β0.

References

    1. Arguillère S., Miller M. I., & Younes L. (2016). Diffeomorphic surface registration with atrophy constraints. SIAM Journal on Imaging Sciences, 9(3), 975–1003. 10.1137/15M104431X - DOI - PMC - PubMed
    1. Berlinet A., & Thomas-Agnan C (2004). Reproducing kernel Hilbert spaces in probability and statistics. Springer US. 10.1007/978-1-4419-9096-9 - DOI
    1. Berrendero J. R., Cuevas A., & Torrecilla J. L. (2018). On the use of reproducing kernel Hilbert spaces in functional classification. Journal of the American Statistical Association, 113(523), 1210–1218. 10.1080/01621459.2017.1320287 - DOI
    1. Biffi C., De Marvao A., Attard M. I., Dawes T. J., Whiffin N., Bai W., Shi W., Francis C., Meyer H., Buchan R., Cook S. A., Rueckert D., & O’Regan D. P. (2018). Three-dimensional cardiovascular imaging-genetics: A mass univariate framework. Bioinformatics, 34(1), 97–103. 10.1093/bioinformatics/btx552 - DOI - PMC - PubMed
    1. Blanchard, G., & Krämer, N. (2010). Optimal learning rates for kernel conjugate gradient regression. In Proceedings of the 23rd international conference on neural information processing systems – volume 1 (NIPS'10) (pp. 226–234). Curran Associates Inc., Red Hook, NY, USA. 10.5555/2997189.2997215 - DOI

LinkOut - more resources