. 2024 Aug 31;15(4):1723-1745.
doi: 10.21037/jgo-24-426. Epub 2024 Aug 22.

Liquid-liquid phase separation-related features of PYGB/ACTR3/CCNA2/ITGB1/ATP8A1/RAP1GAP2 predict the prognosis of pancreatic cancer

Affiliations

Liquid-liquid phase separation-related features of PYGB/ACTR3/CCNA2/ITGB1/ATP8A1/RAP1GAP2 predict the prognosis of pancreatic cancer

Xiaofeng Li et al. J Gastrointest Oncol. .

Abstract

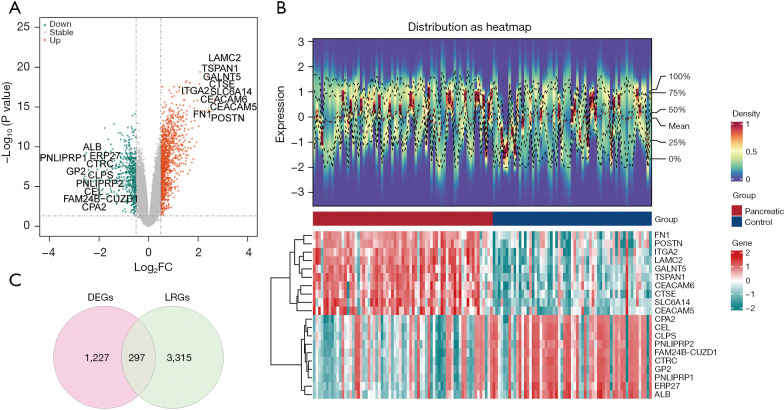
Background: The growth and metastasis of pancreatic cancer (PC) has been found to be closely associated with liquid-liquid phase separation (LLPS). This study sought to identify LLPS-related biomarkers in PC to construct a robust prognostic model.

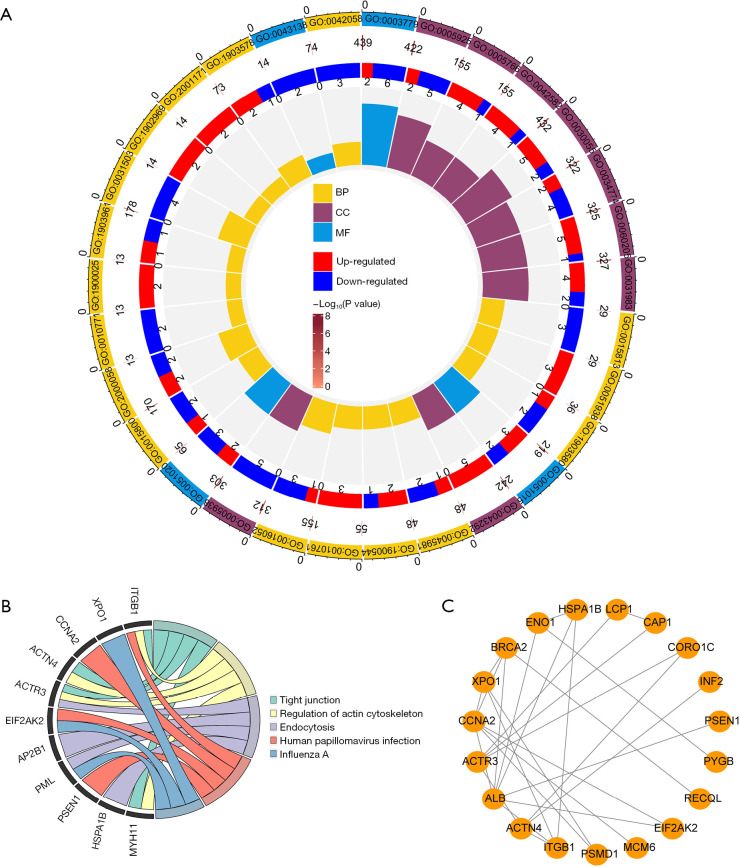
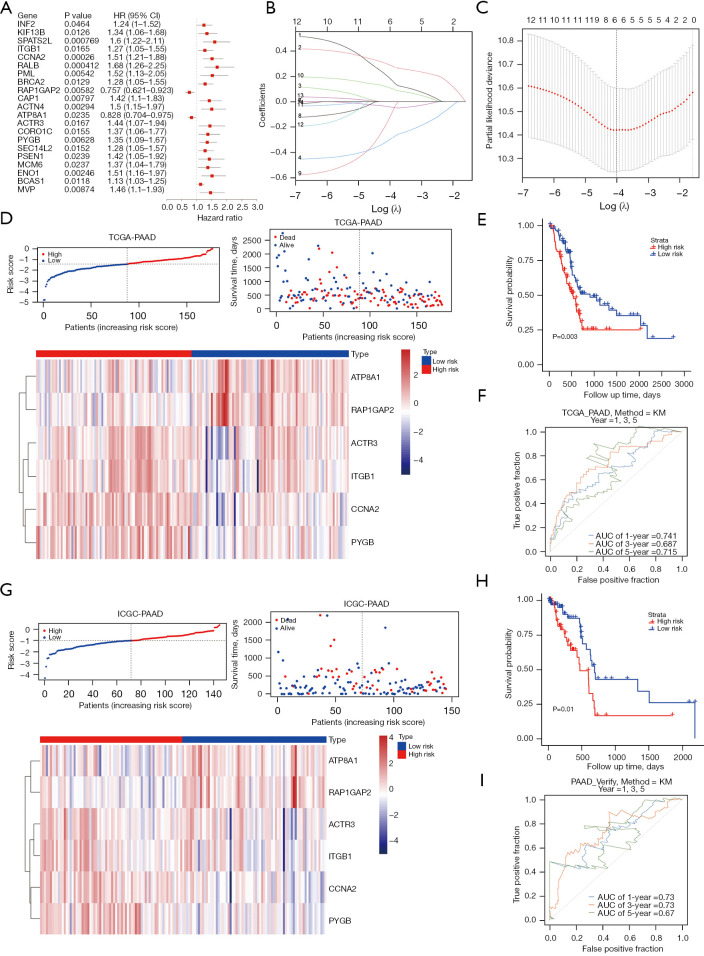
Methods: Transcriptomic data and clinical information related to PC were retrieved from publicly accessible databases. The PC-related data set was subjected to differential expression, Mendelian randomization (MR), univariate Cox, and least absolute selection and shrinkage operator analyses to identify biomarkers. Using the biomarkers, we subsequently constructed a risk model, identified the independent prognostic factors of PC, established a nomogram, and conducted an immune analysis.

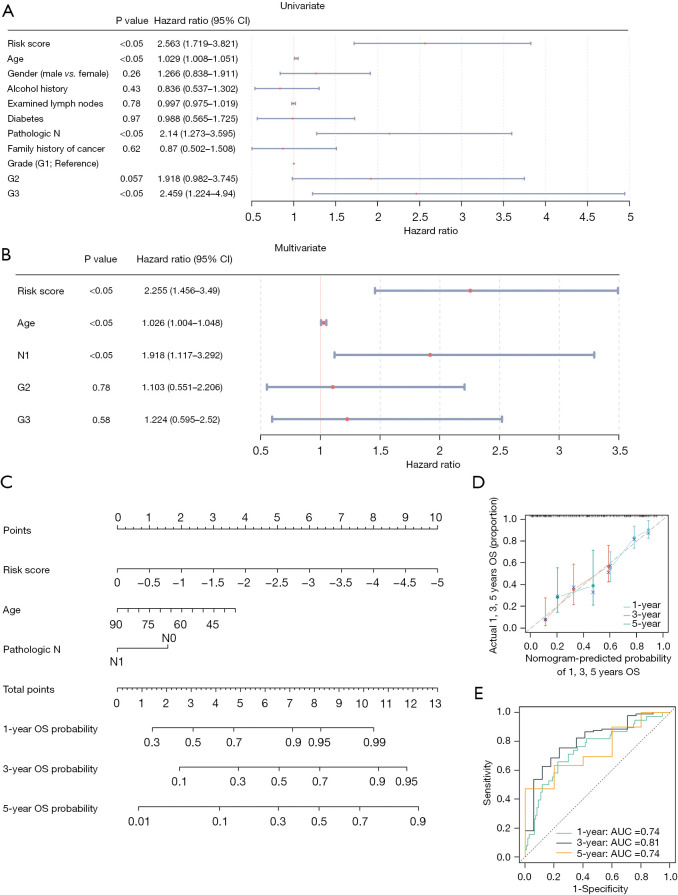
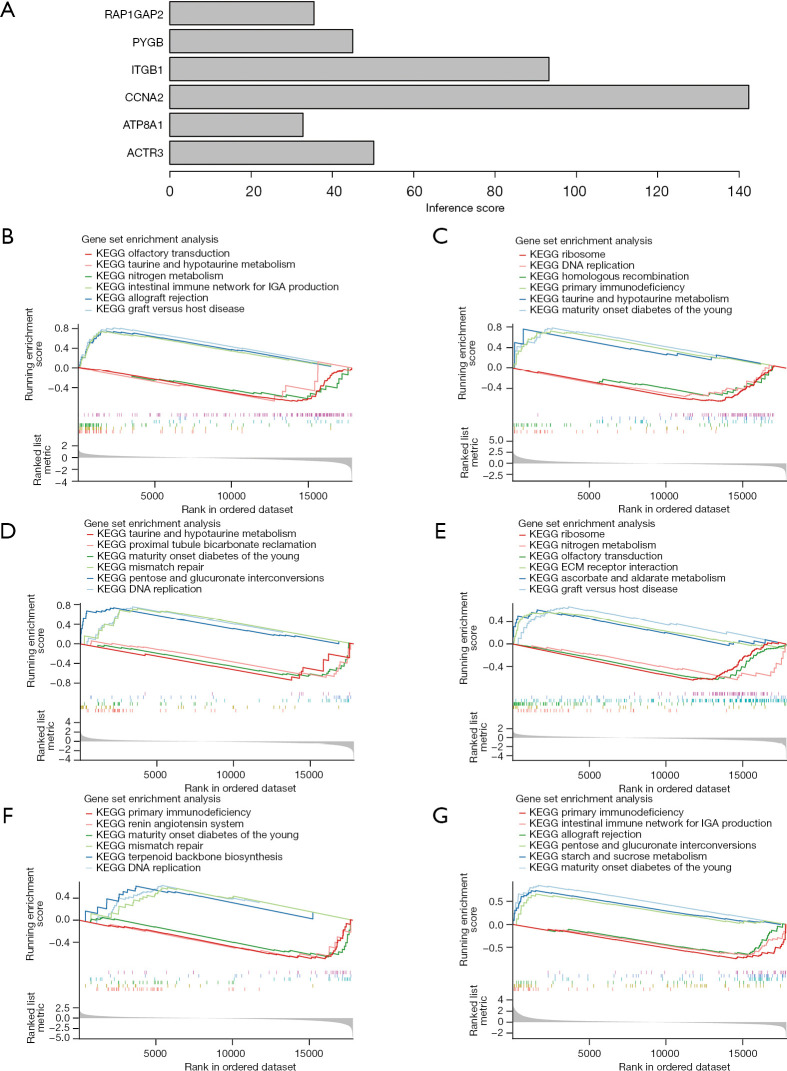
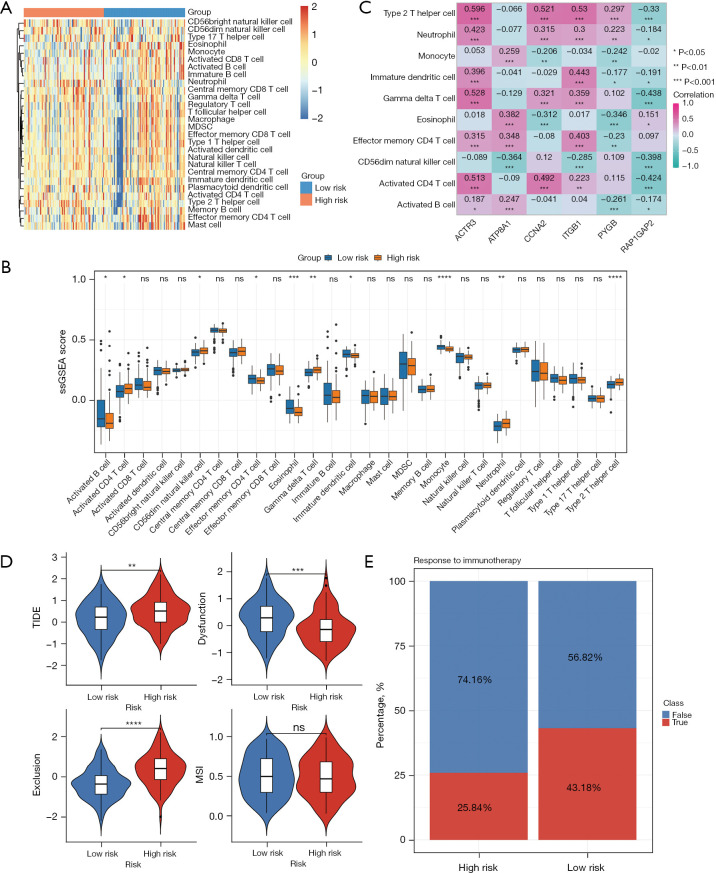
Results: The study identified four genes linked with an increased risk of PC; that is, PYGB, ACTR3, CCNA2, and ITGB1. Conversely, ATP8A1, and RAP1GAP2 were found to provide protection against PC. These findings contributed significantly to the development of a highly precise risk model in which risk, age, and pathology N stage were categorized as independent factors in predicting the prognosis of PC patients. Using these factors, a nomogram was established to predict survival outcomes accurately. An immune analysis revealed varying levels of eosinophils, gamma delta T cells, and other immune cells between the distinct risk groups. The high-risk patients exhibited increased potential for immune escape, while the low-risk patients showed a higher response to immunotherapy.

Conclusions: Six genes were identified as having potential causal relationships with PC. These genes were integrated into a prognostic risk model, thereby serving as unique prognostic signatures. Our findings provide novel insights into predicting the prognosis of PC patients.

Keywords: Mendelian randomization (MR); Pancreatic cancer (PC); biomarkers; liquid-liquid phase separation (LLPS); prognosis.


Conflict of interest statement

Conflicts of Interest: All authors have completed the ICMJE uniform disclosure form (available at https://jgo.amegroups.com/article/view/10.21037/jgo-24-426/coif). The authors have no conflicts of interest to declare.

Figures

Figure 1
Figure 1
Identification of the DEGs in the GSE62452 data set. (A) Volcano plot of the DEGs between the PC and control samples. (B) Heatmap of the expression patterns of the DEGs. (C) Venn diagram illustrating the DE-LRGs by overlapping the DEGs and LRGs. FC, fold-change; DEGs, differentially expressed genes; LRGs, liquid-liquid phase separation-related genes; PC, pancreatic cancer; DE-LRGs, differentially expressed-LRGs.
Figure 2
Figure 2
Functional enrichment analysis and construction of PPI networks. (A) GO analysis of the candidate genes. (B) KEGG analysis of the candidate genes. (C) PPI network of the candidate genes. BP, biological process; CC, cellular components; MF, molecular function; PPI, protein-protein interaction; GO, Gene Ontology; KEGG, Kyoto Encyclopedia of Genes and Genomes.
Figure 3
Figure 3
Assessment and validation of risk models. (A) Univariate Cox regression analysis was conducted to screen the potential prognostic-related genes. (B,C) LASSO regression analysis was conducted to identify biomarkers. (D) Distribution of the training cohort (left) risk scores, (right) survival status, (down) heatmap of the expression patterns of biomarkers between the high- and low-risk groups in the training cohort. (E) K-M survival curve of the high- and low-risk groups in the training cohort. (F) ROC curve of the training cohort. (G) Distribution of the testing cohort (left) risk scores, (right) survival status, (down) heatmap of the expression patterns of the biomarkers between the high- and low-risk groups in the testing cohort. (H) K-M survival curve of the high- and low-risk groups in the testing cohort. (I) ROC curve of the testing cohort. HR, hazard ratio; CI, confidence interval; TCGA, The Cancer Genome Atlas; PAAD, pancreatic adenocarcinoma; K-M, Kaplan-Meier; AUC, area under the curve; ICGC, International Cancer Genome Consortium; LASSO, least absolute selection and shrinkage operator; ROC, receiver operating characteristic.
Figure 4
Figure 4
Independent prognostic analysis and construction of a nomogram. (A,B) Univariate and multivariate Cox regression analyses to identify independent prognostic factors. (C) Construction of a nomogram using independent prognostic factors. (D) Calibration curve of the nomogram. (E) ROC curve of the nomogram. CI, confidence interval; OS, overall survival; AUC, area under the curve; ROC, receiver operating characteristic.
Figure 5
Figure 5
Correlation and enrichment analyses. (A) Correlation analysis between biomarkers and PC. (B-G) GSEAs of ACTR3, ATP8A1, CCNA2, ITGB1, PYGB, and RAP1GAP2, respectively. KEGG, Kyoto Encyclopedia of Genes and Genomes; PC, pancreatic cancer; GSEAs, gene set enrichment analyses.
Figure 6
Figure 6
Immune infiltration and immunotherapy analyses. (A) Heatmap of the proportions of 28 immune cells between the high- and low-risk groups in the training cohort. (B) ssGESA scores between the high- and low-risk groups in the training cohort. (C) Correlations between the biomarkers and differential immune cells. (D) TIDE scores, dysfunction scores, exclusion scores and MSI scores between the high- and low-risk groups in the training cohort. (E) Immunotherapy response rates between the high- and low-risk groups in the training cohort. *, P<0.05; **, P<0.01; ***, P<0.001; ****, P<0.0001; ns, P>0.05. ssGESA, single-sample gene set enrichment analysis; TIDE, Tumor Immune Dysfunction and Exclusion; MSI, microsatellite instability.
Figure 7
Figure 7
Biomarker-related regulatory network. (A) GGI network of the biomarkers. (B) TF-mRNA regulatory network. (C) ceRNA regulatory network. GGI, gene-gene interaction; TF, transcription factor; mRNA, messenger RNA; ceRNA, competitive endogenous RNA.
Figure 8
Figure 8
Biomarker-related potential drugs. (A) ACTR3. (B) ATP8A1. (C) CCNA2. (D) ITGB1. (E) PYGB. (F) RAP1GAP2. Cor, correction; Rev, reversibility.

Similar articles

References

    1. Klein AP. Pancreatic cancer epidemiology: understanding the role of lifestyle and inherited risk factors. Nat Rev Gastroenterol Hepatol 2021;18:493-502. 10.1038/s41575-021-00457-x - DOI - PMC - PubMed
    1. Halbrook CJ, Lyssiotis CA, Pasca di Magliano M, et al. Pancreatic cancer: Advances and challenges. Cell 2023;186:1729-54. 10.1016/j.cell.2023.02.014 - DOI - PMC - PubMed
    1. Kleeff J, Korc M, Apte M, et al. Pancreatic cancer. Nat Rev Dis Primers 2016;2:16022. 10.1038/nrdp.2016.22 - DOI - PubMed
    1. Aslanian HR, Lee JH, Canto MI. AGA Clinical Practice Update on Pancreas Cancer Screening in High-Risk Individuals: Expert Review. Gastroenterology 2020;159:358-62. 10.1053/j.gastro.2020.03.088 - DOI - PubMed
    1. Duan H, Li L, He S. Advances and Prospects in the Treatment of Pancreatic Cancer. Int J Nanomedicine 2023;18:3973-88. 10.2147/IJN.S413496 - DOI - PMC - PubMed

LinkOut - more resources