. 2024 Sep 15;15(9):1916-1931.
doi: 10.4239/wjd.v15.i9.1916.

Corilagin alleviates podocyte injury in diabetic nephropathy by regulating autophagy via the SIRT1-AMPK pathway

Affiliations

Corilagin alleviates podocyte injury in diabetic nephropathy by regulating autophagy via the SIRT1-AMPK pathway

Yu Lou et al. World J Diabetes. .

Abstract

Background: Diabetic nephropathy (DN) is the most frequent chronic microvascular consequence of diabetes, and podocyte injury and malfunction are closely related to the development of DN. Studies have shown that corilagin (Cor) has hepatoprotective, anti-inflammatory, antibacterial, antioxidant, anti-hypertensive, anti-diabetic, and anti-tumor activities.

Aim: To explore the protective effect of Cor against podocyte injury in DN mice and the underlying mechanisms.

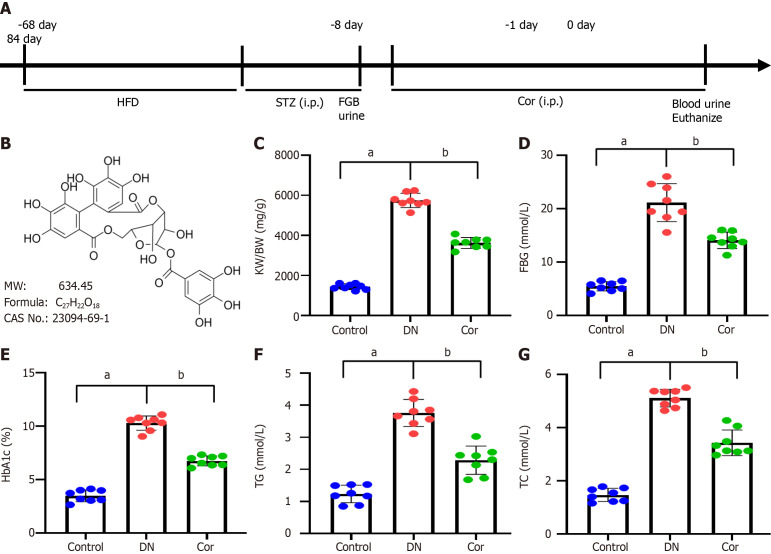
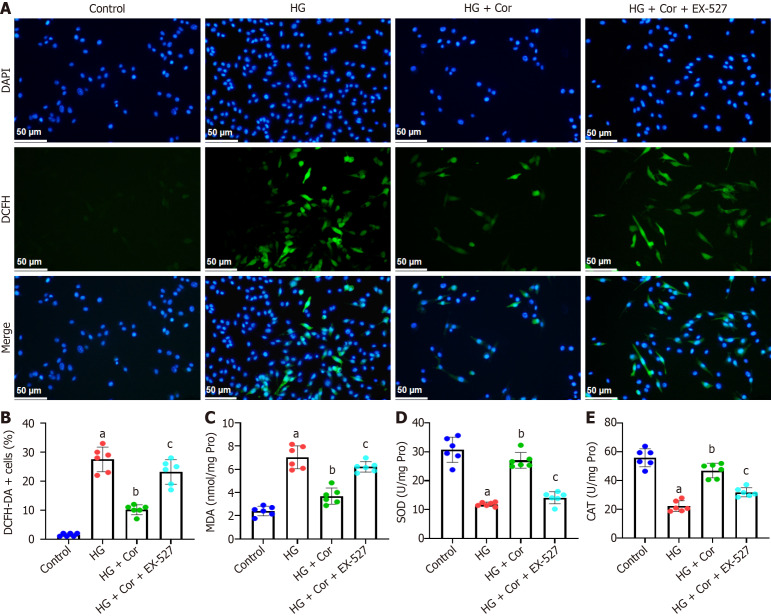
Methods: Streptozotocin and a high-fat diet were combined to generate DN mice models, which were then divided into either a Cor group or a DN group (n = 8 in each group). Mice in the Cor group were intraperitoneally injected with Cor (30 mg/kg/d) for 12 wk, and mice in the DN group were treated with saline. Biochemical analysis was used to measure the blood lipid profiles. Hematoxylin and eosin staining was used to detect pathological changes in kidney tissue. Immunohistochemistry and Western blotting were used to assess the protein expression of nephrin and podocin. Mouse podocyte cells (MPC5) were cultured and treated with glucose (5 mmol/L), Cor (50 μM), high glucose (HG) (30 mmol/L), and HG (30 mmol/L) plus Cor (50 μM). Real-time quantitative PCR and Western blotting were performed to examine the effects of Cor on podocyte autophagy.

Results: Compared with the control group, the DN mice models had increased fasting blood glucose, glycosylated hemoglobin, triglycerides, and total cholesterol, decreased nephrin and podocin expression, increased apoptosis rate, elevated inflammatory cytokines, and enhanced oxidative stress. All of the conditions mentioned above were alleviated after intervention with Cor. In addition, Cor therapy improved SIRT1 and AMPK expression (P < 0.001), inhibited reactive oxygen species and oxidative stress, and elevated autophagy in HG-induced podocytes (P < 0.01).

Conclusion: Cor alleviates podocyte injury by regulating autophagy via the SIRT1-AMPK pathway, thereby exerting its protective impact on renal function in DN mice.

Keywords: Autophagy; Corilagin; Diabetic nephropathy; High glucose; Podocyte injury; SIRT1-AMPK pathway.


Conflict of interest statement

Conflict-of-interest statement: The authors declare that they have no known competing financial interests or personal relationships that could have appeared to influence the work reported in this paper.

Figures

Figure 1
Figure 1
Effects of corilagin on blood glucose and lipids in diabetic mice. A: Timeline of procedure for corilagin (Cor) intervention; B: Structural formula, molecular weight, chemical formula, and CAS number of Cor. A diabetic nephropathy mouse model was induced by high-fat diet feeding followed by streptozotocin injections. Cor was intraperitoneally injected (30 mg/kg/d) for 12 wk; C: Renal hypertrophy index kidney weight (KW)/body weight (BW) was calculated from KW (mg) divided by BW (g); D: Fasting blood glucose (mmol/L) detected with a glucose meter; E: ELISA analysis of glycosylated hemoglobin (%); F and G: Triglycerides and total cholesterol detected by the GPO-PAP colourimetric method. Data are presented as the mean ± SD (n = 8 in each group). Data were analyzed using one-way ANOVA, and the Bonferroni test was used for the post hoc test. aP < 0.001 vs control group; bP < 0.001 vs DN group. Cor: Corilagin; DN: Diabetic nephropathy; HFD: High-fat diet; FBG: Fasting blood glucose; TG: Triglycerides; TC: Total cholesterol.
Figure 2
Figure 2
Corilagin improves histopathological injury and renal function of diabetic nephropathy mice. A: Pathological changes of renal tissues assessed by hematoxylin and eosin staining in mice (magnification 400 ×); B and C: Serum creatinine and blood urea nitrogen in mice detected using an automated biochemical analyzer; D: ELISA detection of urine microalbuminuria to calculate 24-h urinary albumin excretion rate; E: Western blot showing representative bands of Nephrin and Podocin in mouse kidney tissues; F: Quantification analysis of Nephrin and Podocin protein bands. Protein expression was normalized to GADPH. Data are presented as the mean ± SD (n = 8 in each group). aP < 0.001 vs control group; bP < 0.001 vs DN group. Scr: Serum creatinine; BUN: Blood urea nitrogen; 24-h UAER: 24-h urinary albumin excretion rate; Cor: Corilagin; DN: Diabetic nephropathy.
Figure 3
Figure 3
Corilagin reduces apoptosis in kidney tissue of mice. A: Representative images of TUNEL staining in the kidney (magnification 200 ×); B: Quantification analysis of renal tissue apoptosis by calculating the percentage of TUNEL-positive cells; C and D: Real-time quantitative PCR was performed to determine the mRNA levels of BAX and BCL-2 in kidney tissue. GAPDH was used as the internal control. Data are presented as the mean ± SD (n = 8 in each group). aP < 0.001 vs control group; bP < 0.001 vs DN group. Cor: Corilagin; DN: Diabetic nephropathy.
Figure 4
Figure 4
Corilagin attenuates inflammatory infiltration in the kidneys of diabetic nephropathy mice. A: Representative images of immunohistochemical staining for IL-1β in kidney tissue of mice (magnification 200 ×); B-D: The levels of inflammatory factors (IL-1β, TNF-α, and IL-6) measured by ELISA in kidney tissue; E-G: Real-time quantitative PCR was carried out to determine the mRNA expression of IL-1β, TNF-α, and IL-6 in kidney tissue of mice. Data are presented as the mean ± SD (n = 8 in each group). aP < 0.001 vs control group; bP < 0.001 vs DN group. Cor: Corilagin; DN: Diabetic nephropathy.
Figure 5
Figure 5
Corilagin reduces oxidative stress in kidney tissue of diabetic nephropathy mice. A: Representative images of dihydroethidium (DHE) staining for renal superoxide; B: Quantification of DHE intensity in kidney tissue; C-E: Colorimetry was used to measure the levels of MDA, SOD, and CAT in kidney tissue lysate. Data are presented as the mean ± SD (n = 8 in each group). aP < 0.001 vs control group; bP < 0.001 vs DN group. Cor: Corilagin; DN: Diabetic nephropathy.
Figure 6
Figure 6
Corilagin attenuates podocyte damage induced by hyperglycemia and modulates SIRT1 and AMPK protein expression. MPC5 cells were treated with corilagin (50 μM) and high glucose (D-glucose 30 mM) for 48 h. A: The effect of Cor on cell viability was assessed by 3-(4,5-dimethylthiazol-2-yl)-2,5-diphenyltetrazolium bromide assay; B: Cell apoptosis was assessed by Annexin V-FITC/propidium iodide double staining using flow cytometry; C: Representative images of flow cytometry. The upper left quadrant represents necrotic cells, the upper right quadrant represents late apoptotic cells, the lower left quadrant represents normal cells, and the lower right quadrant represents early apoptotic cells; D: Western blot showing representative bands of SIRT1 and AMPK in podocytes; E: Quantification analysis of SIRT1 and p-AMPK protein bands normalized to GAPDH and AMPK, respectively. Data are presented as the mean ± SD. aP < 0.001 vs control group; bP < 0.001 vs HG group. HG: High glucose; Cor: Corilagin; DN: Diabetic nephropathy.
Figure 7
Figure 7
Corilagin suppresses cellular reactive oxygen species production and oxidative stress in hyperglycemia-induced podocytes via SIRT1. MPC5 cells were pretreated with a SIRT1 inhibitor (EX-527, 10 μM) for 2 h, and then incubated with corilagin (50 μM) and high glucose (D-glucose 30 mM) for a further 48 h. A: Representative images of 2,7-dichlorodihydrofluorescein diacetate (DCFH-DA) staining of MPC5 cells; B: Quantification of DCFH-DA positive cells relative to DAPI positive cells; C-E: The colourimetric method was applied to analyze oxidative stress indicators in the lysate of MPC5 cells, and the levels of malondialdehyde, superoxide dismutase, and catalase were quantified. Data are presented as the mean ± SD (n = 8 in each group). aP < 0.001 vs control group; bP < 0.001 vs HG group; cP < 0.001 vs HG + Cor group. HG: High glucose; Cor: Corilagin; DN: Diabetic nephropathy; MDA: Malondialdehyde; SOD: Superoxide dismutase; CAT: Catalase.
Figure 8
Figure 8
Corilagin promotes hyperglycemia-induced podocyte autophagy via SIRT1. A: Cells were stained for LC3-II and nuclei. The nuclei of surviving cells were stained with DAPI and showed blue fluorescence. The cytoplasm of autophagic cells was stained for LC3-II and shows green fluorescence; B: Quantitative analysis of autophagic cells in each group; C: Real-time quantitative PCR was performed to determine the expression of autophagy-related proteins; D: Quantification analysis of LC3 II and p62 protein bands normalized to GAPDH. Data are presented as the mean ± SD. aP < 0.001 vs control group; bP < 0.001 vs HG group; cP < 0.001 vs HG + Cor group. HG: High glucose; Cor: Corilagin.
Figure 9
Figure 9
Corilagin attenuates podocyte damage induced by hyperglycemia by enhancing autophagy. MPC5 cells were treated with the autophagy inhibitor 3-MA (1 mg/mL), corilagin (50 μM), and high glucose (D-glucose 30 mM) for 48 h. A: The effect of corilagin on cell viability was assessed by 3-(4,5-dimethylthiazol-2-yl)-2,5-diphenyltetrazolium bromide assay; B: Cell apoptosis was assessed by Annexin V-FITC/propidium iodide double staining using flow cytometry; C: Representative images of flow cytometry. Data are presented as the mean ± SD. aP < 0.001 vs control group; bP < 0.001 vs HG group; cP < 0.001 vs HG + Cor group. HG: High glucose; Cor: Corilagin.

Similar articles

References

    1. Reidy K, Kang HM, Hostetter T, Susztak K. Molecular mechanisms of diabetic kidney disease. J Clin Invest. 2014;124:2333–2340. - PMC - PubMed
    1. Lassén E, Daehn IS. Molecular Mechanisms in Early Diabetic Kidney Disease: Glomerular Endothelial Cell Dysfunction. Int J Mol Sci. 2020;21 - PMC - PubMed
    1. Yang D, Livingston MJ, Liu Z, Dong G, Zhang M, Chen JK, Dong Z. Autophagy in diabetic kidney disease: regulation, pathological role and therapeutic potential. Cell Mol Life Sci. 2018;75:669–688. - PMC - PubMed
    1. Cao Z, Cooper ME. Pathogenesis of diabetic nephropathy. J Diabetes Investig. 2011;2:243–247. - PMC - PubMed
    1. Fu H, Liu S, Bastacky SI, Wang X, Tian XJ, Zhou D. Diabetic kidney diseases revisited: A new perspective for a new era. Mol Metab. 2019;30:250–263. - PMC - PubMed

LinkOut - more resources