. 2024 Aug 28:42:52-67.
doi: 10.1016/j.bioactmat.2024.08.021. eCollection 2024 Dec.

Vascular wall microenvironment: Endothelial cells original exosomes mediated melatonin-suppressed vascular calcification and vascular ageing in a m6A methylation dependent manner

Affiliations

Vascular wall microenvironment: Endothelial cells original exosomes mediated melatonin-suppressed vascular calcification and vascular ageing in a m6A methylation dependent manner

Su-Kang Shan et al. Bioact Mater. .

Abstract

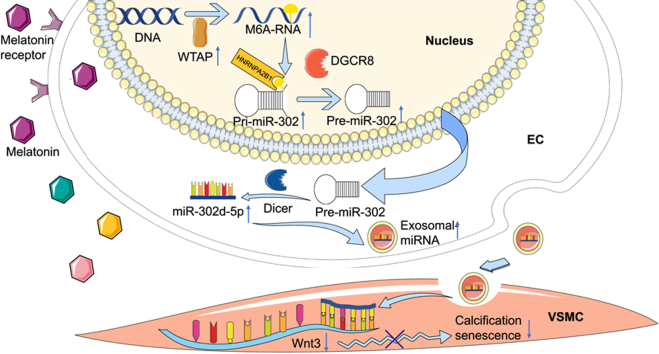
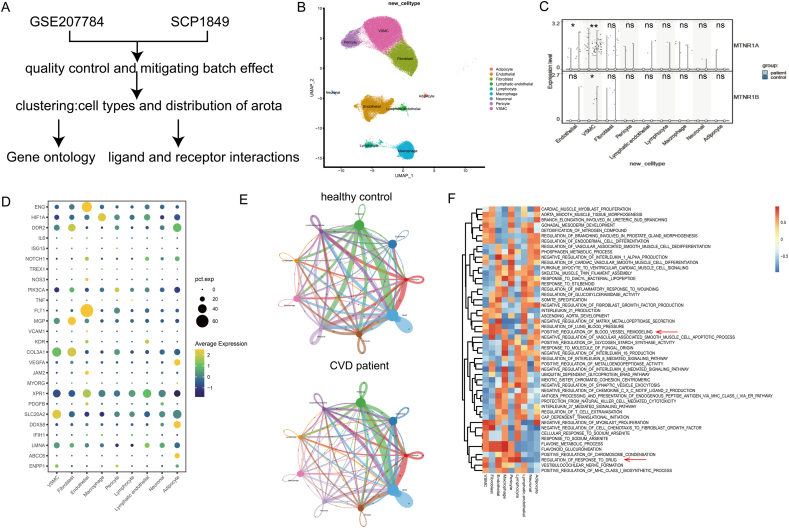
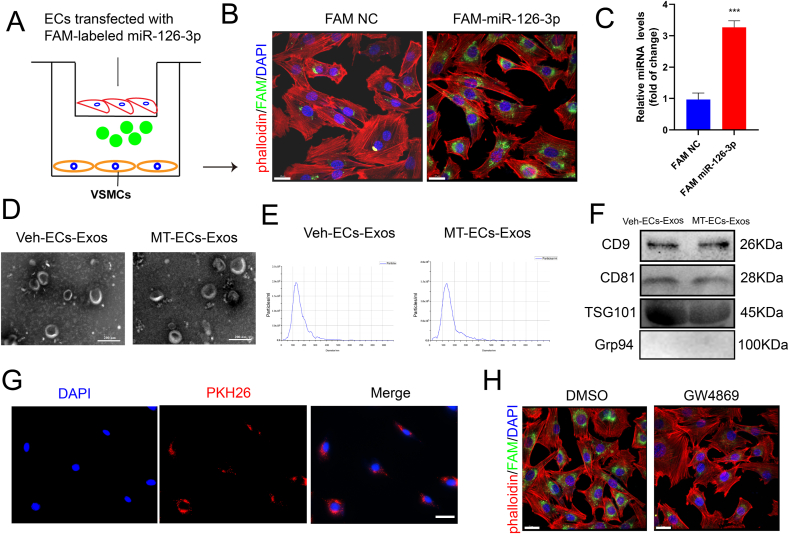
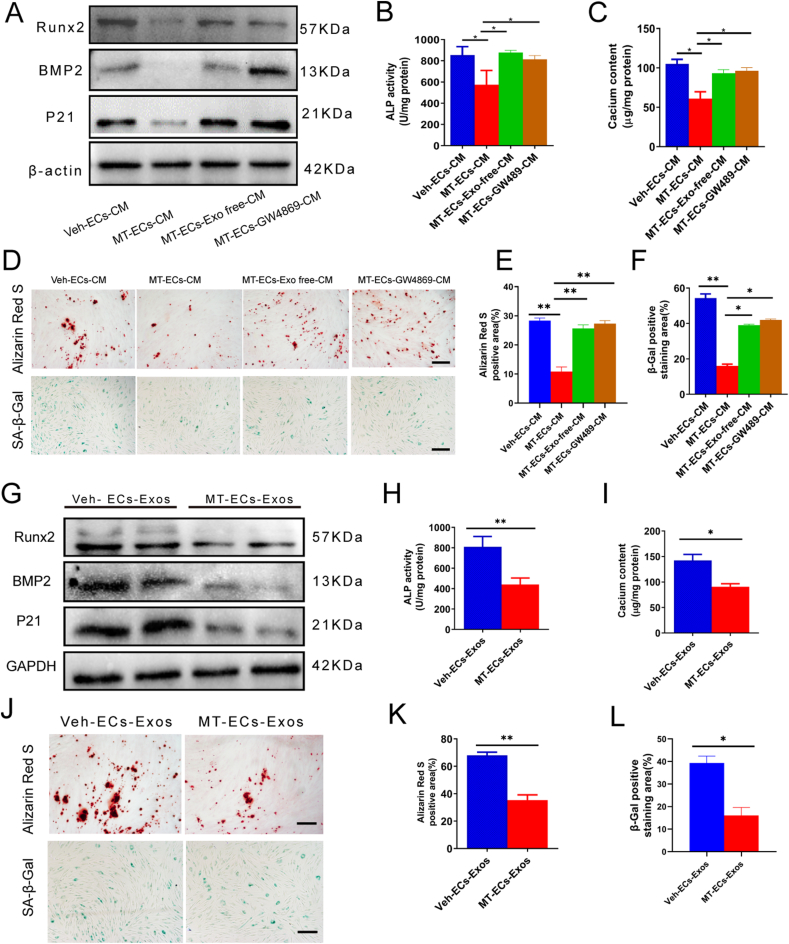
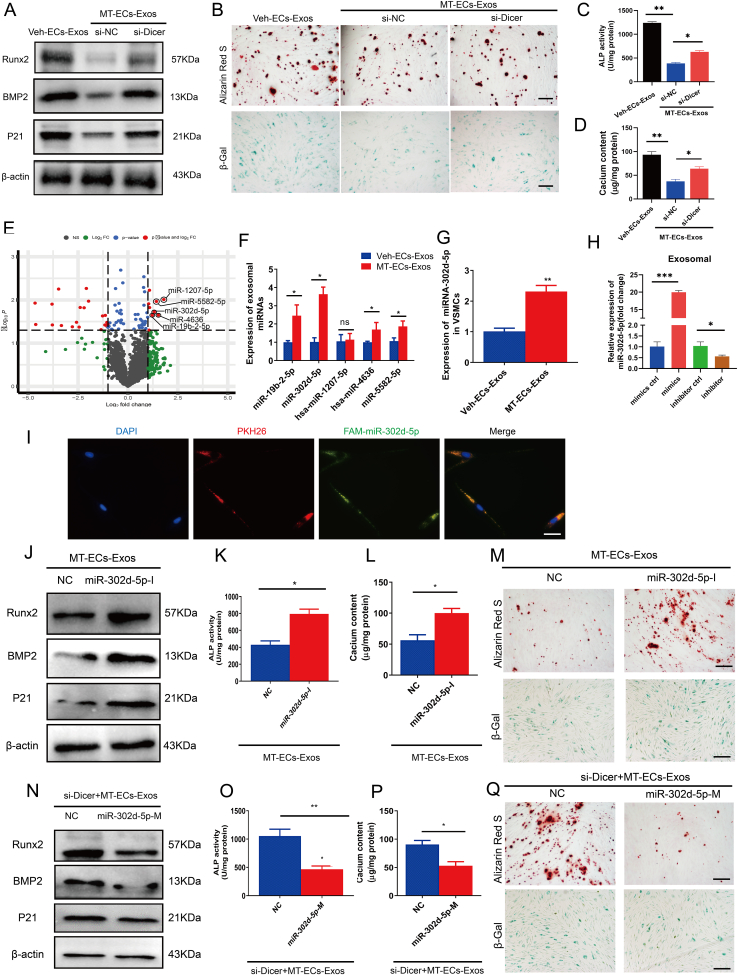
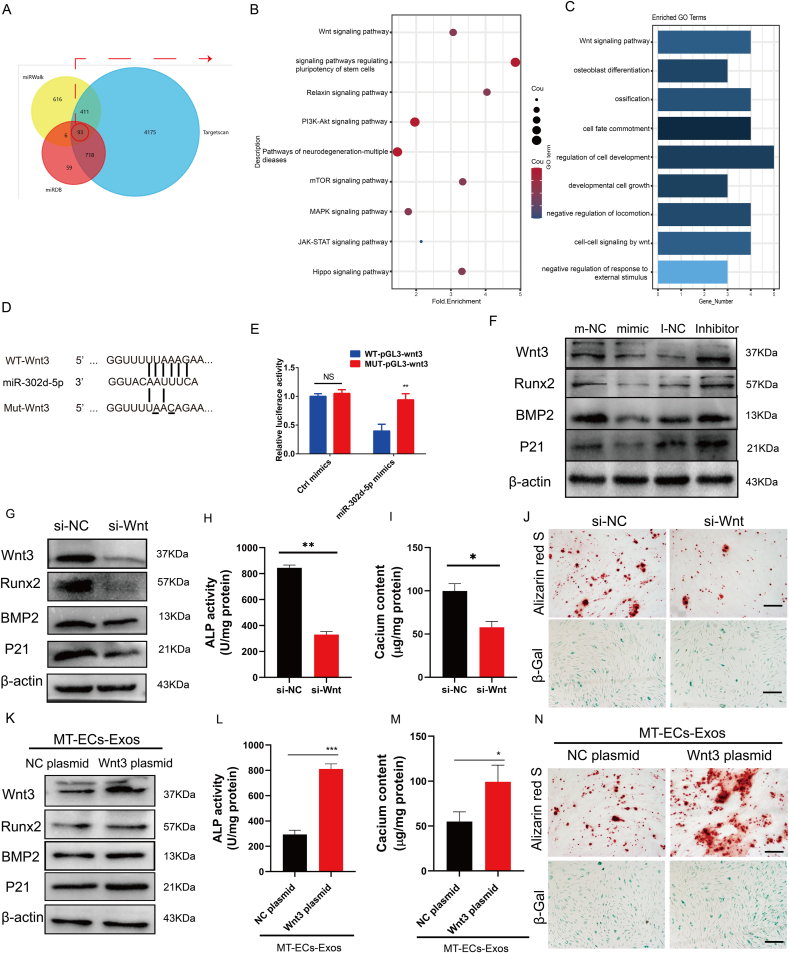
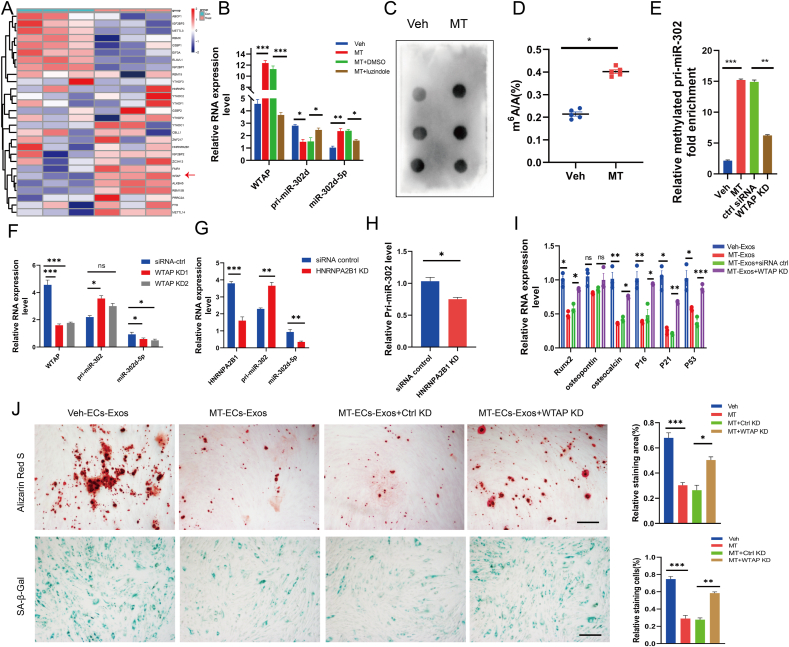
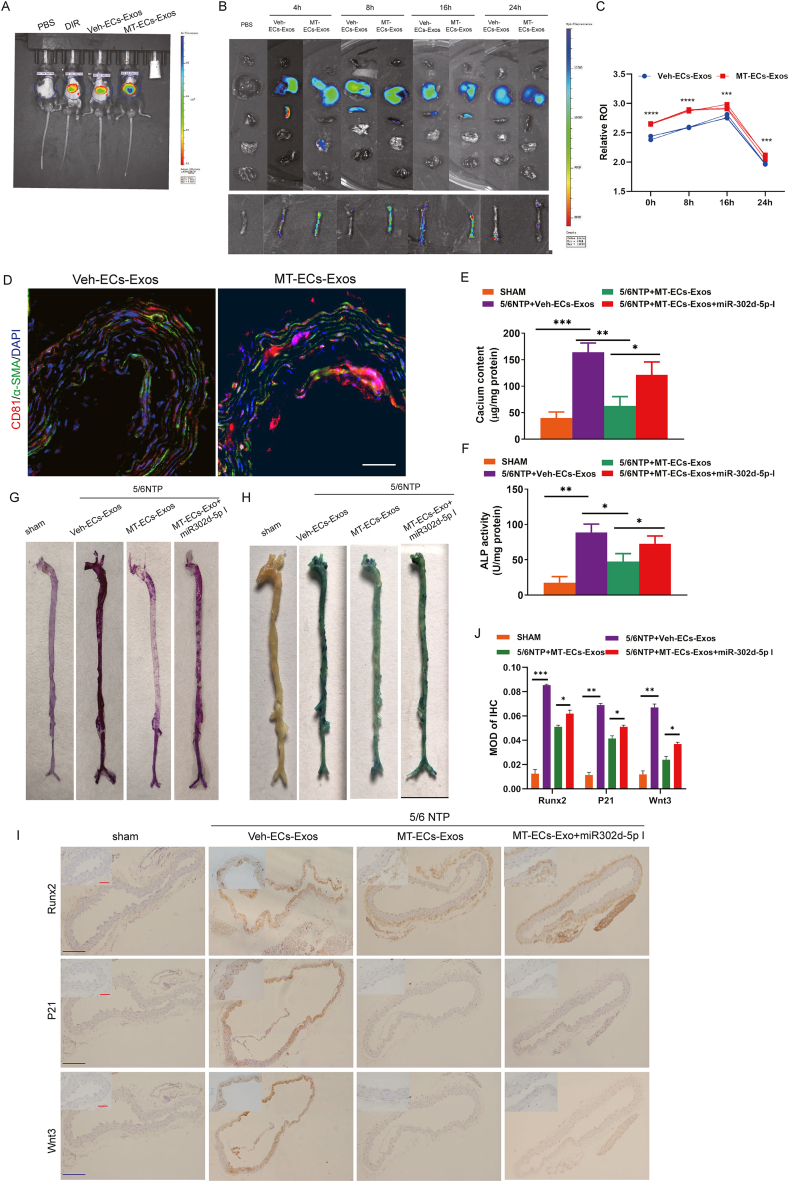
Vascular calcification and vascular ageing are "silent" diseases but are highly prevalent in patients with end stage renal failure and type 2 diabetes, as well as in the ageing population. Melatonin (MT) has been shown to induce cardiovascular protection effects. However, the role of MT on vascular calcification and ageing has not been well-identified. In this study, the aortic transcriptional landscape revealed clues for MT related cell-to-cell communication between endothelial cells (ECs) and vascular smooth muscle cells (VSMCs) in vascular calcification and vascular ageing. Furthermore, we elucidated that it was exosomes that participate in the information transportation from ECs to VSMCs. The exosomes secreted from melatonin-treated ECs (MT-ECs-Exos) inhibited calcification and senescence of VSMCs. Mechanistically, miR-302d-5p was highly enriched in MT-ECs-Exos, while depletion of miR-302d-5p blocked the ability of MT-ECs-Exos to suppress VSMC calcification and senescence. Notably, Wnt3 was a bona fide target of miR-302d-5p and modulated VSMC calcification and senescence. Furthermore, we found that maturation of endothelial derived exosomal miR-302d-5p was promoted by WTAP in an N6-methyladenosine (m6A)-dependent manner. Interestingly, MT alleviated vascular calcification and ageing in 5/6-nephrectomy (5/6 NTP) mice, a chronic kidney disease (CKD) induced vascular calcification and vascular ageing mouse model. MT-ECs-Exos was absorbed by VSMCs in vivo and effectively prevented vascular calcification and ageing in 5/6 NTP mice. ECs-derived miR-302d-5p mediated MT induced anti-calcification and anti-ageing effects in 5/6 NTP mice. Our study suggests that MT-ECs-Exos alleviate vascular calcification and ageing through the miR-302d-5p/Wnt3 signaling pathway, dependent on m6A methylation.

Keywords: Exosomes; Melatonin; N6-methyladenosine; Vascular ageing; Vascular calcification.


Figures

Image 1
A proposed model of exosomes from melatonin-induced ECs in ameliorating vascular calcification and ageing. Melatonin triggered miR-302d-5p maturation through HNRNPA2B1/DGCR8 pathway in a m6A dependent manner and thereby promoted secretion of exosomes that enriched in miR-302d-5p. Subsequently, these exosomes were uptaken by adjacent VSMCs and miR-302d-5p was transferred into VSMCs. In VSMCs, miR-302d-5p alleviated vascular calcification and ageing by targeting Wnt3.
Fig. 1
Fig. 1
Single-Cell RNA-Seq revealed aortic transcriptional landscape and melatonin related EC-VSMC communication in CVD and healthy controls. (A)Schematic diagram of the experimental design. (B) Uniform Manifold Approximation and Projection (UMAP)representation of aligned gene expression data in single cells extracted from control (n = 15) and CVD (n = 13) aortas. (C) Violin plots for gene expression of melatonin receptors in cell populations of aorta from patients with CVD and controls. (D) Cell-specific expression of genes with known coding mutations associated with CVD. (E) Cell-Cell communication analysis of cells between CVD patients and control volunteers by cellphone DB.(F) GO analysis of top 50 differentially expressed genes in patients with CVD and controls (ordered by decreasing p value).
Fig. 2
Fig. 2
Exosomes transferred from ECs to VSMCs. (A) Schematic diagram of transwell co-culture system. VSMCs were co-cultured with ECs transfected with FAM-labeled miR-126–3p or FAM alone. (B) Fluorescence signal detection in VSMCs within co-culture system by confocal microscope (scale bar = 20 μm). (C) The expression level of miR-126–3p in co-cultured VSMCs by qRT-PCR. (D) Morphologic detection of exosomes by laser electron microscope (scale bar = 200 nm). (E) Particle diameter and concentration of exosomes detected by Malvern's NanoSight NS300. (F) The protein expression level of CD9, CD81, TSG101 and Grp94 detected by Western blot. (G) VSMCs were treated with PKH26 (red) labeled exosomes, and the fluorescence signal was detected by inverted fluorescence microscope (scale bar = 100 μm). (H) VSMCs co-cultured with ECs treated with DMSO or GW4869 prior to transfection with FAM labeled miR-126–3p or FAM alone. Fluorescence signal detection in VSMCs by confocal microscope (scale bar = 20 μm). Three independent experiments were performed, and representative images were shown. Data were shown as mean ± SEM. ***p < 0.001.
Fig. 3
Fig. 3
Exosomes derived from MT-treated ECs were responsible for the anti-calcification and anti-senescence effects of melatonin. (A–F) VSMCs were cultured with EC's vehicle-induced CM (Veh-ECs-CM), melatonin-induced CM (MT-ECs-CM), and EVs-depleted MT-CM (MT-ECs-Exo free-CM), and GW4869 pretreated MT-CM (MT-ECs-GW4869-CM). (A)The expression of Runx2, BMP2, P21 of VSMCs was determined by Western blot. (B) The ALP activity in VSMCs was measured by an ALP kit. (C) The calcium content in VSMCs was measured by the o-cresolphthalein method. (D) The calcium nodules in VSMCs was measured by Alizarin red S staning (upper panel, scale bar = 200 μm), and the senescence VSMCs was measured by SA-β-Gal staining (lower panel, scale bar = 200 μm). (E) The quantification results of mineralized nodules staining in figure D. (F) The quantification results of senescence VSMCs in figure D. (G) The expression of Runx2, BMP2, P21 of VSMCs incubated with Veh-ECs-Exos and MT-ECs-Exos was determined by Western blot. (H) The ALP activity in VSMCs incubated with Veh-ECs-Exos or MT-ECs-Exos was measured by an ALP kit. (I) The calcium content in VSMCs treated with Veh-ECs-Exos or MT-ECs-Exos was measured by the o-cresolphthalein method. (J) The calcium nodules in VSMCs treated with Veh-ECs-Exos or MT-ECs-Exos was measured by Alizarin red S staining (upper panel, scale bar = 200 μm), the senescence VSMCs was measured by SA-β-Gal staining (lower panel, scale bar = 200 μm). (K) The quantification results of mineralized nodules staining in figure J. (L) The quantification results of senescence VSMCs in figure J. Three independent experiments were performed, and representative images were shown. Data are shown as mean ± SEM. Statistical analysis was performed by one-way ANOVA with Tukey's multiple-comparison test (B-F) and unpaired two-tailed Student's t-test(H-L). ns: no significance, *p < 0.05, **p < 0.01.
Fig. 4
Fig. 4
MT-upregulated exosomal miR-302d-5p antagonized VSMC calcification and senescence. (A–D) Dicer, an essential enzyme for miRNAs maturation was silenced in ECs before MT treatment, then Veh-ECs-Exos and MT-ECs-Exos were harvested for VSMCs incubation. (A) The expression levels of Runx2, BMP2, P21 of VSMCs treated by Veh-ECs-Exos or MT-ECs-Exos with or without miRNAs knock-down were detected by Western blot. (B) The calcium nodules in VSMCs treated by Veh-ECs-Exos or MT-ECs-Exos with or without miRNAs knock-down was measured by Alizarin red S staning (upper panel, scale bar = 200 μm), the senescence VSMCs were measured by SA-β-Gal staining (lower panel, scale bar = 200 μm). (C) The ALP activity in VSMCs incubated with Veh-ECs-Exos or MT-ECs-Exos with or without miRNAs knock-down was measured by an ALP kit. (D) The calcium content in VSMCs treated with Veh-ECs-Exos or MT-ECs-Exos with or without miRNAs knock-down was measured by the o-cresolphthalein method. (E) The differentially expressed miRNAs (a cut-off of absolute fold change ≥2.0 and p < 0.05) between Veh-ECs-Exos and MT-ECs-Exos according to microarray analysis. (F) qRT-PCR quantitative results of miRNAs expression levels of Veh-ECs-Exos and MT-ECs-Exos. (G) Expression levels of miR-302d-5p in VSMCs treated with Veh-ECs-Exos and MT-ECs-Exos. (H) Expression levels of miR-302d-5p in exosomes derived from miR-302d-5p over-expressed or down-expressed ECs. (I) Microscopy analysis was used to verify the florescent signal colocalization of FAM-miR-302d-5p in green, PKH26 in red and DAPI in blue (scale bar = 50 μm). (J) The expression level of Runx2, BMP2, P21 of VSMCs incubated with miR-302d-5p knockdown MT-ECs-Exos was determined by Western blot. (K) The ALP activity in VSMCs incubated with miR-302d-5p knockdown MT-ECs-Exos was measured by an ALP kit. (L) The calcium content in VSMCs treated with miR-302d-5p knockdown MT-ECs-Exos was measured by the o-cresolphthalein method. (M) The calcium nodules in VSMCs treated with miR-302d-5p knockdown MT-ECs-Exos was measured by Alizarin red S staning (upper panel, scale bar = 200 μm), the senescence VSMCs was measured by SA-β-Gal staining (lower panel, scale bar = 200 μm). (N) The expression level of Runx2, BMP2, P21 of VSMCs incubated with miR-302d-5p knock-in Exos was determined by Western blot. (O) The ALP activity in VSMCs incubated with miR-302d-5p knock-in Exos was measured by an ALP kit. (P) The calcium content in VSMCs treated with miR-302d-5p knock-in Exos was measured by the o-cresolphthalein method. (Q) The calcium nodules in VSMCs treated with miR-302d-5p knock-in Exos was measured by Alizarin red S staining (upper panel, scale bar = 200 μm), the senescence VSMCs was measured by SA-β-Gal staining (lower panel, scale bar = 200 μm). Three independent experiments were performed, and representative data were shown. Data were shown as mean ± SEM. *p < 0.05, **p < 0.01, ***p < 0.0001.
Fig. 5
Fig. 5
miR-302d-5p inhibits VSMCs calcification and senescence by targeting Wnt3 (A) The Venn diagram of target genes of miR-302d-5p predicted by TargetScan, miRwalk and miRDB. (B) Gene Ontology analysis of overlapping target genes of miR-302d-5p. (C) Kyoto Encyclopedia of Genes and Genomes (KEGG) analysis of overlapping target genes of miR-302d-5p. (D) Schematic representation of miR-302d-5p putative target sites in Wnt3 3′-UTR and alignment of miR-302d-5p with WT and MUT Wnt3 3′-UTR showing pairing. (E) Luciferase activity was performed using luciferase constructs carrying a wild type or mutant Wnt3 3′-UTR co-transfected into HEK293T cells with miR-302d-5p mimics compared with empty vector control. (F)The expression level of Wnt3, Runx2, BMP2, P21 in VSMCs treated with miR-302d-5p mimic or inhibitor. (G–J) VSMCs were incubated with Wnt3 silencing by siRNA interference. Then, the expression level of Wnt3, Runx2, P16, P21(G), ALP activity (H), calcium content (I) and mineralized nodules (J, upper panel, scale bar = 200 μm) as well as senescence cells (J, lower panel, scale bar = 200 μm) was measured in VSMCs. (K–N) VSMCs were transfected with Wnt3 overexpression plasmid before MT-ECs-Exos incubation. Then, the expression level of Wnt3, Runx2, P16, P21(K), ALP activity (L), calcium content (M) and mineralized nodules (N, upper panel) as well as senescence cells (N, lower panel) was measured in VSMCs (scale bar = 200 μm). Results are represented by mean ± SEM for each group. *p < 0.05. **p < 0.01, ***p < 0.001.
Fig. 6
Fig. 6
MT suppresses VSMC calcification and aging by inducing ECs derived exosomes secretion in a m6A dependent manner. (A) Expression heatmap of m6A-related genes in ECs before and after MT treatment. (B) qRT-PCR confirmed that the expression level of WTAP, pri-miR-302, miR-302d-5p of ECs treated with Veh, MT, MT plus DMSO, MT plus luzindole respectively. (C) Dot blot identified m6A modification levels of total RNA in ECs undergoing Veh and MT interventions. (D) The m6A content of total RNA from ECs treated with Veh or MT was measured by ELISA using an EpiQuik m6A RNA methylation quantification kit. (E) The expression level of methylated pri-miR-302 was measured by MeRIP-PCR. (F)qRT-PCR confirmed that the expression level of WTAP, pri-miR-302, miR-302d-5p of ECs after knock-down of WTAP. (G) qRT-PCR confirmed that the expression level of HNRNPA2B1, pri-miR-302, miR-302d-5p of ECs after knock-down of HNRNPA2B1. (H) Detection of pri-miR-302 binding to DGCR8 by immunoprecipitation experiments in control and HNRNPA2B1 down-expression ECs. (I)The expression level of Runx2, osteopontin, osteocalcin, P16, P21, P53 in Veh-ECs-Exos, MT-ECs-Exos, MT-ECs-Exos plus siRNA ctrl and MT-ECs-Exos plus WTAP KD treated ECs.(J) The calcium nodules in VSMCs was measured by Alizarin red S staining (upper panel, scale bar = 200 μm), the senescence VSMCs was measured by SA-β-Gal staining (lower panel, scale bar = 200 μm). Results are represented by mean ± SEM. *p < 0.05. **p < 0.01, ***p < 0.001.
Fig. 7
Fig. 7
Exosomes derived from melatonin-treated ECs alleviated vascular calcification and vascular aging in 5/6 NTP mice model. (A) Spectrum in vivo imaging results of mice injected with PBS, fluorescent dye DIR, and DIR-labeled exosome via tail vein, respectively (n = 6). (B) Spectrum imaging results of organs harvested from mice injected intravenously with PBS, and DIR-labeled exosome for 4h, 8h, 16h, 24h, respectively (n = 6). (C) Quantitation of relative florescent ROI between organs from Veh-ECs-Exos and MT-Exo infused mice at 0h, 8h, 16h, 24h (n = 6). (D) The thoracic aorta was obtained to analyze the uptake of endothelial exosomes in the slices after injection 24h. Blue fluorescence (DAPI)-labeled cell nuclei, green fluorescence (Alexa 488)-labeled α-SMA, and red fluorescence (Alexa 555)-labeled CD81 indicating exosomes (n = 6, scale bar = 50 μm). (E–H) Veh-ECs-Exos, MT-ECs-Exos, and MT-ECs-Exos transfected with miR-302d-5p inhibitor (MT-ECs-Exos + miR-302d-5p-I) were injected to 5/6 NTP mice. (E) Calcium content of thoracic aorta of mice was measured by o-cresolphthalein method. (F) The ALP activity level among four groups measured by ALP kit (n = 6). (G) thoracic aorta calcification was analyzed by Alizarin Red S staining (n = 6). (H) SA-β-gal-stained micrographs were presented to reveal aorta senescence (n = 6). (I) Immunohistochemistry analysis of Runx2, P21and Wnt3 in thoracic aorta(n = 5). Scare bar 50 μm (Red) and 500 μm (Blue). (J) Quantitation of middle OD of IHC. Results were represented by mean ± SEM. *p < 0.05, **p < 0.01, ***p < 0.001, ****p < 0.0001.

References

    1. Onnis C., Virmani R., Kawai K., et al. Coronary artery calcification: current concepts and clinical implications. Circulation. 2024;149(3):251–266. - PMC - PubMed
    1. Lanzer P., Hannan F.M., Lanzer J.D., et al. Medial arterial calcification: JACC state-of-the-art review. J. Am. Coll. Cardiol. 2021;78(11):1145–1165. - PMC - PubMed
    1. Wu Y.Y., Shan S.K., Lin X., et al. Cellular crosstalk in the vascular wall microenvironment: the role of exosomes in vascular calcification. Front Cardiovasc Med. 2022;9 - PMC - PubMed
    1. Rashdan N.A., Sim A.M., Cui L., et al. Osteocalcin regulates arterial calcification via altered Wnt signaling and glucose metabolism. J. Bone Miner. Res. : the official journal of the American Society for Bone and Mineral Research. 2020;35(2):357–367. - PubMed
    1. Wang C., Xu W., An J., et al. Poly(ADP-ribose) polymerase 1 accelerates vascular calcification by upregulating Runx2. Nat. Commun. 2019;10(1):1203. - PMC - PubMed

LinkOut - more resources