. 2024 Aug 18;27(9):110734.
doi: 10.1016/j.isci.2024.110734. eCollection 2024 Sep 20.

Single-cell multi-omics identify novel regulators required for osteoclastogenesis during aging

Affiliations

Single-cell multi-omics identify novel regulators required for osteoclastogenesis during aging

Hao Li et al. iScience. .

Abstract

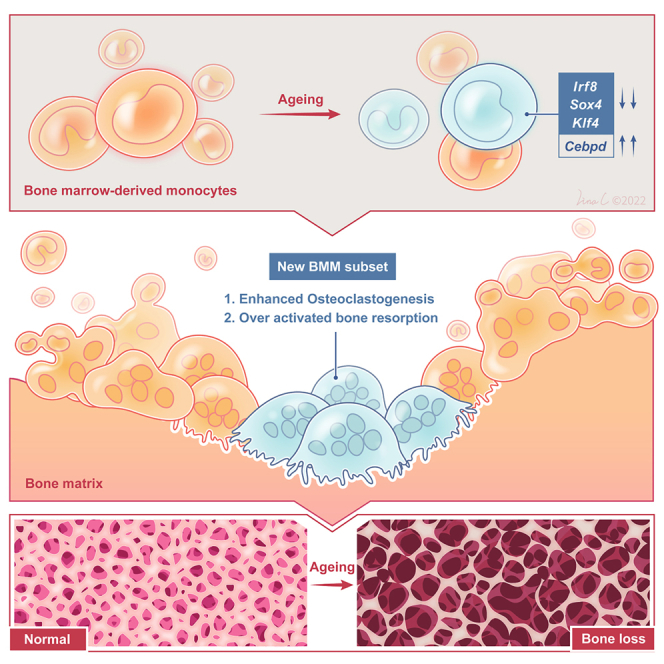
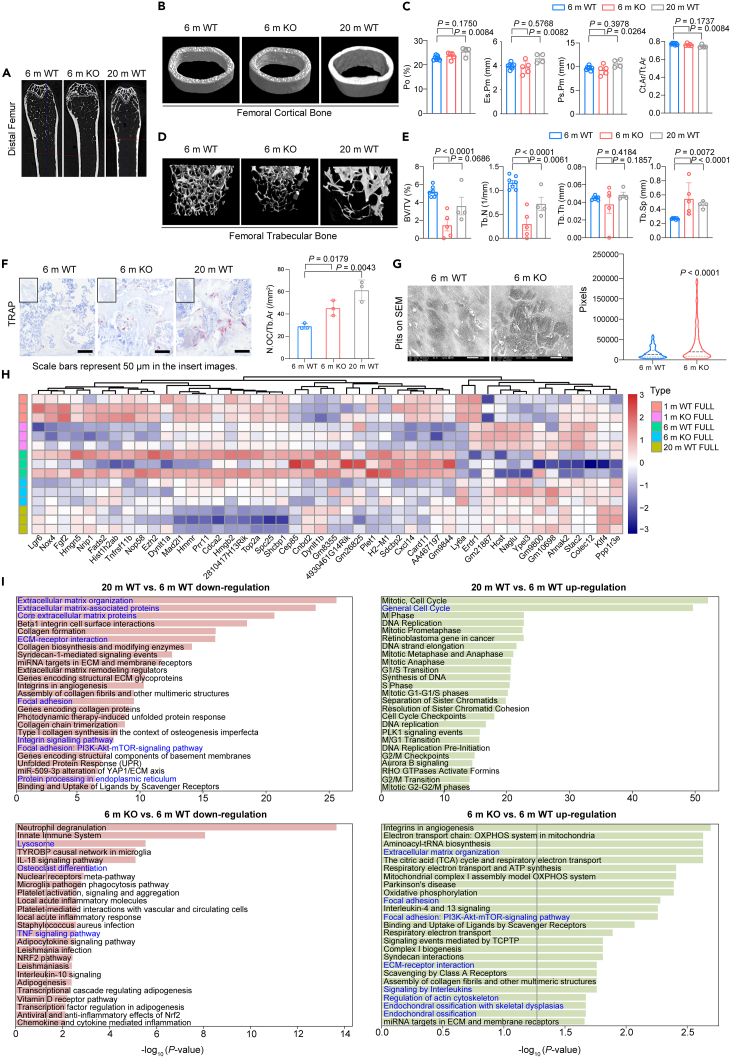
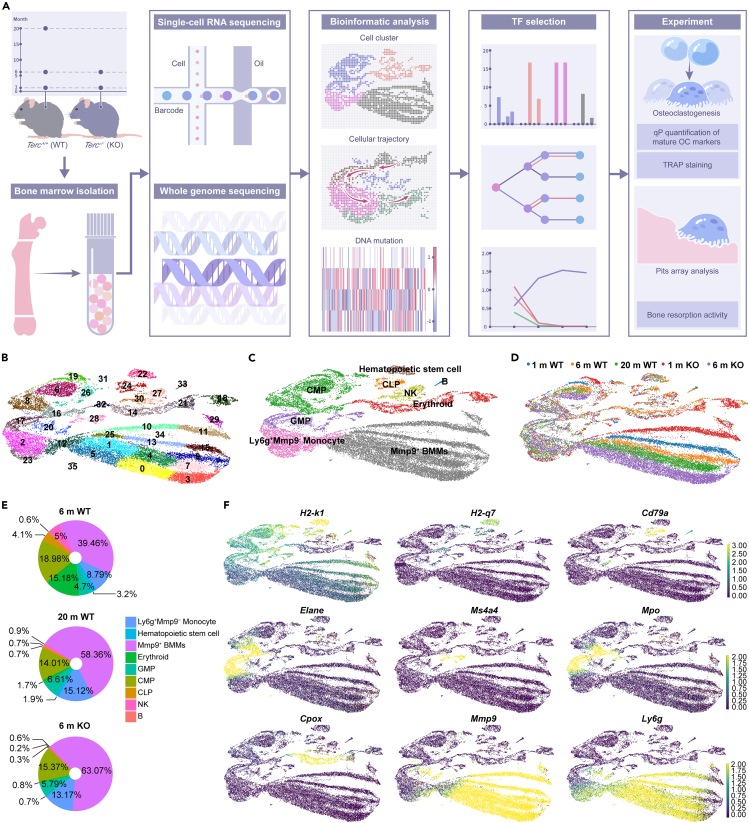
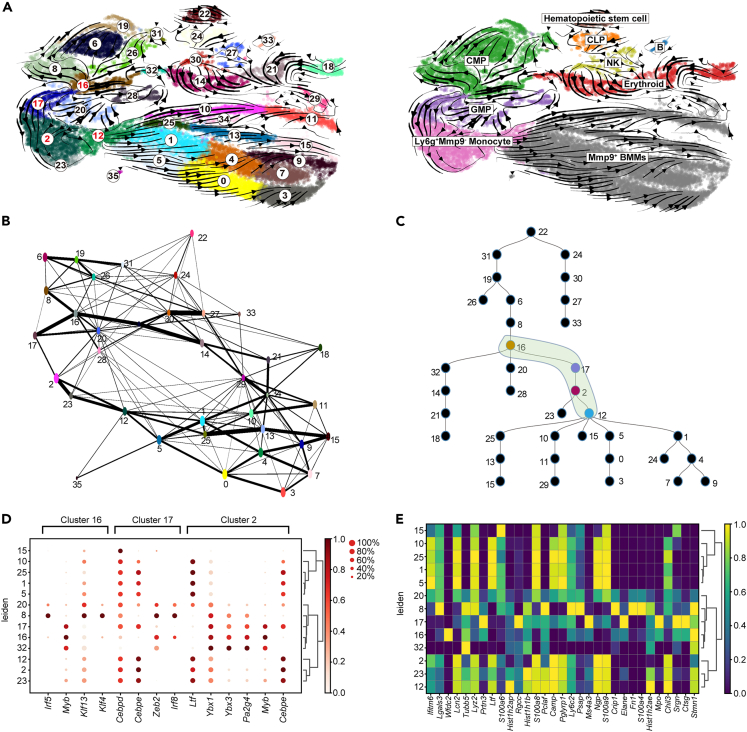
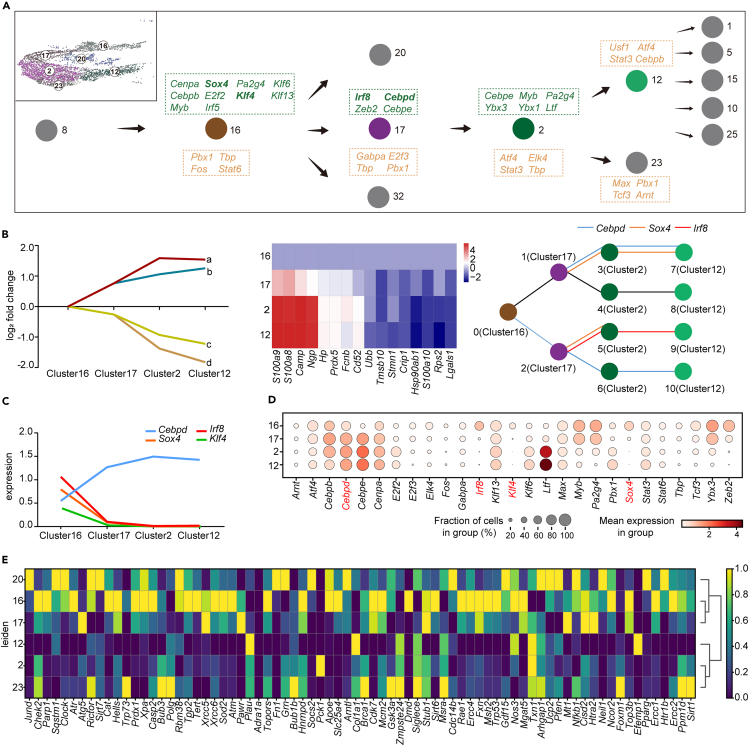
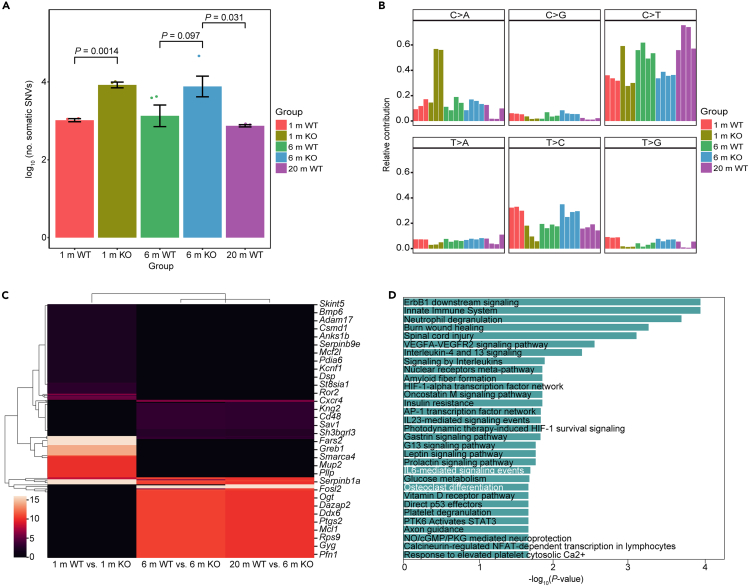
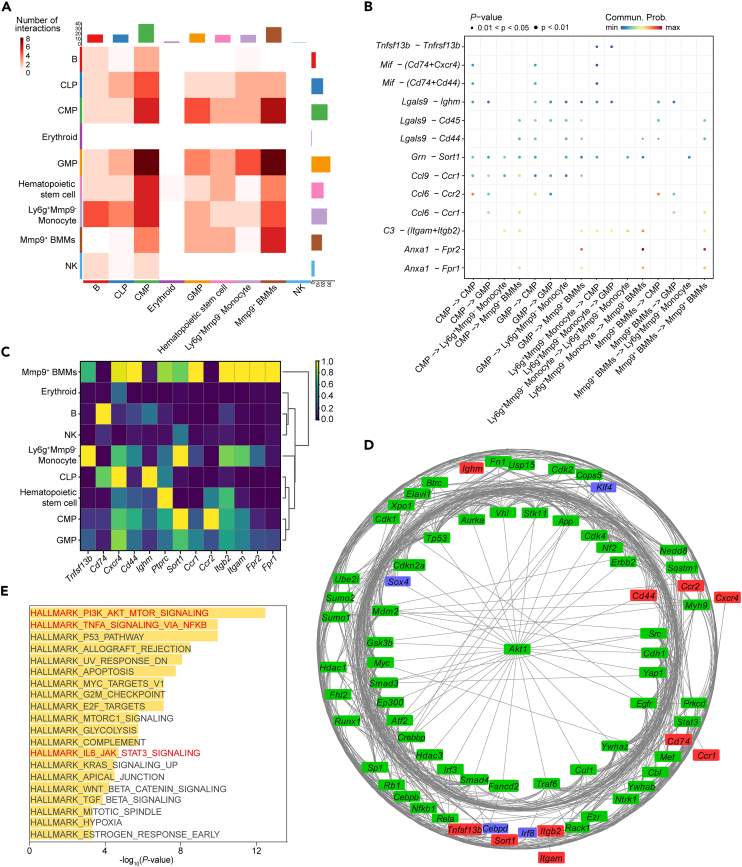
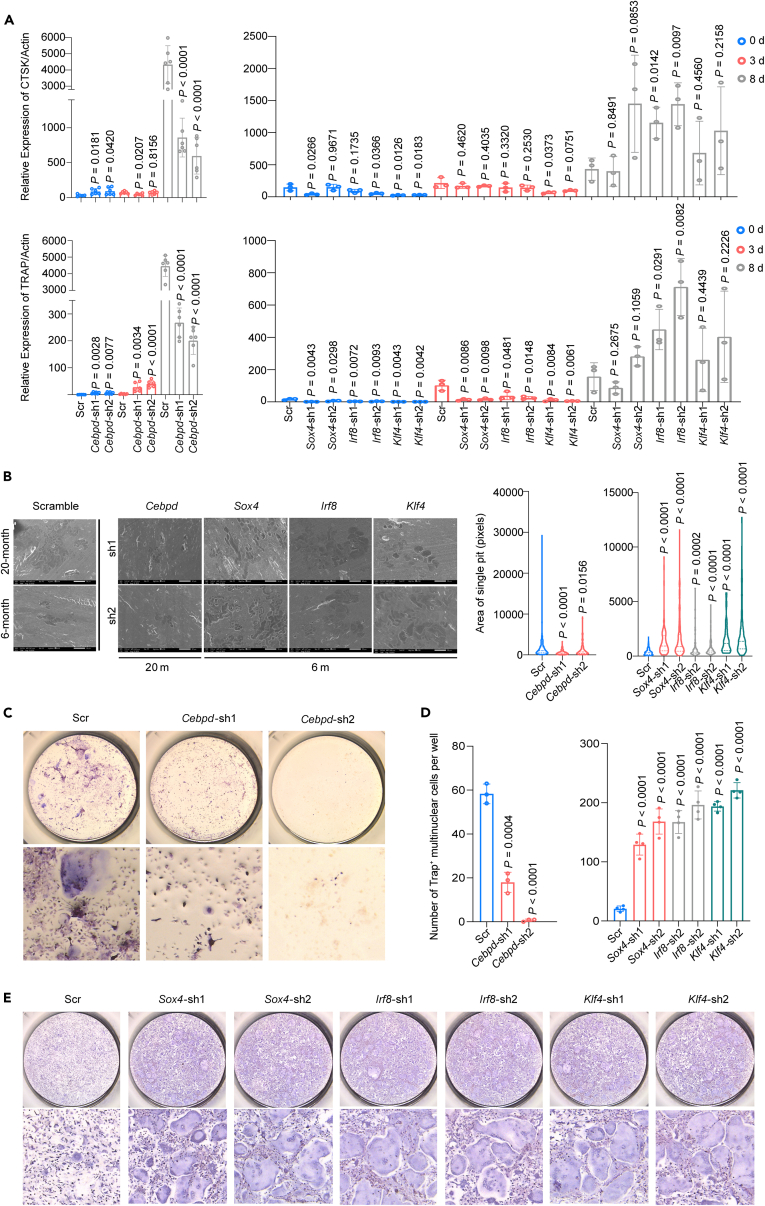
Age-related osteoporosis manifests as a complex pathology that disrupts bone homeostasis and elevates fracture risk, yet the mechanisms facilitating age-related shifts in bone marrow macrophages/osteoclasts (BMMs/OCs) lineage are not fully understood. To decipher these mechanisms, we conducted an investigation into the determinants controlling BMMs/OCs differentiation. We performed single-cell multi-omics profiling on bone marrow samples from mice of different ages (1, 6, and 20 months) to gain a holistic understanding of cellular changes across time. Our analysis revealed that aging significantly instigates OC differentiation. Importantly, we identified Cebpd as a vital gene for osteoclastogenesis and bone resorption during the aging process. Counterbalancing the effects of Cebpd, we found Irf8, Sox4, and Klf4 to play crucial roles. By thoroughly examining the cellular dynamics underpinning bone aging, our study unveils novel insights into the mechanisms of age-related osteoporosis and presents potential therapeutic targets for future exploration.

Keywords: Cell biology; Molecular biology; Omics; Transcriptomics.


Conflict of interest statement

The authors declare no competing interests.

Figures

None
Graphical abstract
Figure 1
Figure 1
Natural aging and progeria precipitates significant bone loss and activated osteoclastogenesis See also Figure S1 and Table S1. Parameters of micro-CT scanning of long bones from 6 m WT, 6 m KO and 20 m WT mice, related to Figure 1C and 1E, Table S2. The number of osteoclasts (TRAP+) on unit area of trabecular bone from mice distal femoral section, related to Figure 1F, Table S3. Area of single resorption pit on bone slices (6 m KO vs. WT), related to Figure 1G, Table S4. Expression matrix of 46 DEGs in FULL stage of RANKL stimulation of young and aged groups, related to Figure 1H, Table S5. DEGs between 6 m (WT & KO) and 20 m WT mice, related to Figure 1I, Table S10. Top significant mutation genes between 20 m WT and 6 m KO mice, related to Figure 5C, Table S11. Inferred receptors and key transcription factors that modulate the aged-induced osteoclastogenesis, related to Figure 6D, Table S12. The relative expression of TRAP and CTSK in scramble or knock-down OCs, related to Figure 7A left, Table S13. The relative expression of TRAP and CTSK in scramble or knock-down OCs, related to Figure 7A right, Table S14. Area of single resorption pit on bone slices (scramble and knock-down OCs), related to Figure 7B, Table S15. TRAP positive cells in 4 TFs knock-down in vitro cultured BMMs of 20 m and 6 m mice, related to Figure 7D. (A) Representative sectional images of micro-CT scanning of distal femur from 6 m, 20 m wild type mice and 6 m Terc−/− mice. (B) Reconstruction model of femoral cortical bone from young (6 m WT) and aged (20 m WT and 6 m Terc−/−) mice (left). (C) Cortical bone parameters of micro-CT scanning (right) revealed modest changes in femoral cortical bone between young and aged samples. (D) Reconstruction model of femoral trabecular bone from young (6 m) and aged (20 m) mice (left). (E) Trabecular bone parameters of micro-CT scanning (right) revealed evident bone loss in trabecular area in aged mice. (F) TRAP staining of distal femoral sections from young and aged mice. More TRAP+ cells are found in trabecular area from aged mice (left). (G) Pits array of bone slices by SEM, as each pit’s area is recorded, showed in vitro-cultured OCs from aged mice (6 m Terc−/−) formed more and bigger mature cells (right). (H) Heatmap of bulk RNA-seq analysis of BMMs transcriptome. 46 differential expression genes are identified to be activated or suppressed between aged and young groups in WT and Terc−/− mice with RANKL stimulation (FULL: 8-day RANKL stimulation or total mature). (I) Pathway enrichment analysis through comparing 6 m and 20 m WT (top) or 6 m KO group (bottom). Top 25 pathways are listed. In each figure, the direction of effect (down/up-regulation) relates to the effect seen in the 20 m WT or 6 m KO group. Data are shown as mean ± s.e.m. n = 12 (7 WT and 5 KO) for 6 m; n = 4 (WT) for 20 m. For (C) and (E), each dot represents a single individual. p values were determined by two-tailed Student’s t test. Labels of Y axis in (C) and (E) (parameters of bone structure obtained from micro-CT scanning) have been defined further: cortical bone: Po (%): total porosity; Es.Pm (mm): endosteal perimeter; Ps.Pm (mm): periosteal perimeter; Ct.Ar (mm2): cortical bone area; Tt.Ar (mm2): total cortical bone area. Trabecular bone: BV/TV (%): bone volume fraction; Tb.N (1/mm): trabecular number; Tb.Th (mm): trabecular thickness; Tb.Sp (mm): trabecular separation.
Figure 2
Figure 2
Different osteoclast progenitor cell populations were identified based on the single-cell transcriptome analysis of bone marrow cells from aging wild-type and Terc−/− mice See also Figure S2 and Table S6. (A) The bone marrow cells from 1 m, 6 m, 20 m WT, and 1 m, 6 m Terc−/− mice were profiled with single-cell RNA-seq and DNA-seq. n = 8 (4 WT and 4 KO) for 1 m; n = 8 (4 WT and 4 KO) for 6 m; n = 4 (WT) for 20 m. (B) is the UMAP plot that presents the cell clusters obtained from Leiden clustering. (C) All the obtained clusters were annotated with the cell type information by comparing the top differential genes (signature genes) associated with each cluster with known cell type markers. (D) Shows the cells from different libraries. (E) Shows the cell compositions of 6 m WT, 20 m WT, and 6 m KO. (F) List the UMAP plots for selected markers genes that we used for the cell type annotation.
Figure 3
Figure 3
The cellular trajectory reconstructed from mouse bone marrow aging single-cell RNA-seq data (A) The RNA-velocity plot that we got from the single-cell RNA-seq data, which infers the cellular trajectory based on RNA velocity. (B) A cellular trajectory (graph) inferred from the single-cell RNA-seq data by PAGA. This trajectory inference is based on the expression difference between cells, which is complementary to the RNA velocity based trajectory. (C) Presents a cellular trajectory predicted by SCDIFF (version 2.0), which integrates the RNA velocity-based trajectory with the expression based trajectory (by PAGA). In the combined trajectory, we identified a key cellular transition stage for osteoclast cell differentiation (Cluster 16, 17, 2, and 12), which is marked in green in the plot. (D) Shows the gene expression of top predicted transcription factors across different cell clusters of the osteoclast cellular trajectory. (E) Shows the top signature genes associated with each of those clusters.
Figure 4
Figure 4
Gene regulatory network inference from the single-cell RNA-seq data identifies 4 key regulators that modulate the critical cellular transitions to OCs See also Figure S3. (A) The cellular state transitions (tree) from the progenitors to the BMMs and the transcription factors underlying each of the edges, identified by SCDIFF2. (B) The gene regulatory network reconstructed by the iDREM tool shows that Cebpd, Sox4, and Irf8 are regulating the gene expression dynamics between cluster 16 to cluster 12, the critical state transitions from the progenitors to BMMs. (C) The log-normalized expression of the 4 predicted key regulators (Cebpd, Irf8, Sox4, and Klf4) are monotonically changing along with the trajectory. (D) The expression changes of top predicted transcription factors along with the trajectory. (E)Top differential genes associated with the critical cellular state transitions for OCs.
Figure 5
Figure 5
Genetic mutation inference from single-cell DNA-seq data supports the change of osteoclastogenesis during aging See also Figure S3 and Table S7. Number and types of SNVs in bulk and single-cell groups, related to Figure 5A and 5B, Table S8. Top significant mutation genes between 1 m WT and 1 m KO mice, related to Figure 5C, Table S9. Top significant mutation genes between 6 m WT and 6 m KO mice, related to Figure 5C, Table S10. Top significant mutation genes between 20 m WT and 6 m KO mice, related to Figure 5C. (A) Number of somatic SNVs per cell in five age groups. (B) Contribution of the indicated six mutation types to the point mutation spectrum for the five age groups. (C) A heatmap of mutation score (see STAR Methods for details) associated with the SNPs detected in the proximity of genes. The SNPs identified between 6 m WT vs. 6 m KO are similar to the ones between 20 m WT and 6 m KO, which are distinct from the SNPs detected between 1 m WT and 1 m KO. (D) Pathway enrichment analysis suggests that the genes associated with those SNPs are significantly enriched with osteoclast differentiation, which indicates that the osteoclastogenesis process is significantly affected by the aging relevant mutations. Data are shown as mean ± s.d. n = 6 (3 WT and 3 KO) for 1 m; n = 8 (4 WT and 4 KO) for 6 m; n = 4 (WT) for 20 m. For (A), each dot represents a single individual. p values were determined by two-tailed Student’s t test.
Figure 6
Figure 6
Cell-cell interaction analysis infers potential critical ligand-receptors associated with aged-induced osteoclastogenesis See also Table S11. (A) The cell-cell interactions between different cell populations inferred by cellchat. (B) The top ligand-receptors predicted between different cell populations. (C) Gene expression of different receptors across different cell populations. (D) Signaling network that connects the inferred receptors and key transcription factors that modulate the aged-induced osteoclastogenesis. Red, green, and blue square indicate ligand-receptors, signature genes, and TFs, respectively. (E) Shows the top 20 enriched pathways of genes in (D).
Figure 7
Figure 7
Validation of the effects of key translational factors on regulating osteoclastogenesis of in vitro BMMs See also Figure S4 and Table S12. The relative expression of TRAP and CTSK in scramble or knock-down OCs, related to Figure 7A left, Table S13. The relative expression of TRAP and CTSK in scramble or knock-down OCs, related to Figure 7A right, Table S14. Area of single resorption pit on bone slices (scramble and knock-down OCs), related to Figure 7B, Table S15. TRAP positive cells in 4 TFs knock-down in vitro cultured BMMs of 20 m and 6 m mice, related to Figure 7D. (A) The expression of TRAP and CTSK, the canonical makers of mature OC, were measured by RT-qPCR before and after 3 days and 8 days the stimulation of RANKL, which are sequential time points along the differentiation of OC. The expression of TRAP and CTSK increased in TFs knockdown BMMs of 6 m and decreased in TFs knockdown BMMs of 20 m mice after 8 days stimulation of RANKL. The two upper plots showed the expression of CTSK and the lower plots showed the expression of TRAP; the two plots on the left demonstrated results from 20 m mice while the other two plots on the right showed the results from 6 m mice. (B) Pits array analysis by SEM scanning showed smaller pits formed by aged (20 m) TF knockdown BMMs and bigger pits formed by young (6 m) TF knockdown BMMs. (C–E) Images and representative inserts of TRAP staining of in vitro-cultured OC. TFs knockdown BMMs generated more TRAP positive cells in young (6 m) BMMs after Irf8, Sox4, and Klf4 were knocked down. On the contrary, aged (20 m) BMMs couldn’t form mature OCs after Cebpd was blocked. Data are shown as mean ± s.e.m. In (A), n = 116 (26 Scr, 36 Cebpd, 18 Sox4, 18 Irf8, 18 Klf4) for TRAP group; n = 116 (26 Scr, 36 Cebpd, 18 Sox4, 18 Irf8, 18 Klf4) for CTSK group, each dot represents a single individual. In (B), n = 10 (1 Scr, 2 Cebpd) for 20 m group; n = 7 (1 Scr, 2 Sox4, 2 Irf8, and 2 Klf4) for 6 m group. In (D), n = 9 (3 Scr, 6Cebpd) for 20 m. In (E), n = 28 (4 Scr, 8Sox4, 8 Irf8, 8 Klf4) for 6 m, each dot represents a single individual. p values were determined by two-tailed Student’s t test. “Scr” stands for scramble.

Similar articles

Cited by

  • Multiomics of Aging and Aging-Related Diseases.
    Kiseleva OI, Arzumanian VA, Ikhalaynen YA, Kurbatov IY, Kryukova PA, Poverennaya EV. Kiseleva OI, et al. Int J Mol Sci. 2024 Dec 21;25(24):13671. doi: 10.3390/ijms252413671. Int J Mol Sci. 2024. PMID: 39769433 Free PMC article. Review.

References

    1. Partridge L., Deelen J., Slagboom P.E. Facing up to the global challenges of ageing. Nature. 2018;561:45–56. doi: 10.1038/s41586-018-0457-8. - DOI - PubMed
    1. Rachner T.D., Khosla S., Hofbauer L.C. Osteoporosis: now and the future. Lancet. 2011;377:1276–1287. doi: 10.1016/S0140-6736(10)62349-5. - DOI - PMC - PubMed
    1. Perkins S.L., Gibbons R., Kling S., Kahn A.J. Age-related bone loss in mice is associated with an increased osteoclast progenitor pool. Bone. 1994;15:65–72. doi: 10.1016/8756-3282(94)90893-1. - DOI - PubMed
    1. Cao J.J., Wronski T.J., Iwaniec U., Phleger L., Kurimoto P., Boudignon B., Halloran B.P. Aging increases stromal/osteoblastic cell-induced osteoclastogenesis and alters the osteoclast precursor pool in the mouse. J. Bone Miner. Res. 2005;20:1659–1668. doi: 10.1359/JBMR.050503. - DOI - PubMed
    1. Sui B., Hu C., Liao L., Chen Y., Zhang X., Fu X., Zheng C., Li M., Wu L., Zhao X., Jin Y. Mesenchymal progenitors in osteopenias of diverse pathologies: differential characteristics in the common shift from osteoblastogenesis to adipogenesis. Sci. Rep. 2016;6 doi: 10.1038/srep30186. - DOI - PMC - PubMed