

Marked Point Process Secretory Events Statistically Characterize Leptin Pulsatile Dynamics
- PMID: 39281006
- PMCID: PMC11398913
- DOI: 10.1210/jendso/bvae149
Marked Point Process Secretory Events Statistically Characterize Leptin Pulsatile Dynamics
Abstract
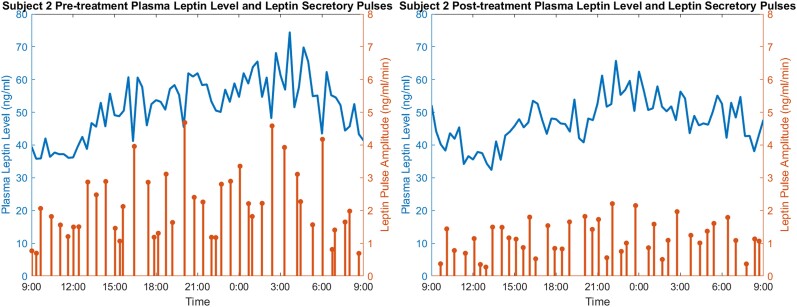
Recent studies have highlighted leptin, a key hormone that regulates energy intake and induces satiety, due to the worldwide prevalence of obesity. In this study, we analyzed plasma leptin measurements from 18 women with premenopausal obesity before and after bromocriptine treatment. By using underlying pulses recovered through deconvolution, we modeled the leptin secretory pulses as marked point processes and applied statistical distributions to evaluate the dynamics of leptin, including the interpulse intervals and amplitudes of the secretion. We fit the generalized inverse Gaussian and lognormal distributions to the intervals and the Gaussian, lognormal, and gamma distributions to the amplitudes of pulses. We evaluated the models' goodness of fit using statistical metrics including Akaike's information criterion, Kolmogorov-Smirnov plots, and quantile-quantile plots. Our evaluation results revealed the effectiveness of these statistical distributions in modeling leptin secretion. Although the lognormal and gamma distributions performed the best based on the metrics, we found all distributions capable of accurately modeling the timing of secretory events, leading us to a better understanding of the physiology of leptin secretion and providing a basis for leptin monitoring. In terms of pulse amplitude, the evaluation metrics indicated the gamma distribution as the most accurate statistical representation. We found no statistically significant effect of bromocriptine intake on the model parameters except for one distribution model.
Keywords: Akaike's information criterion; Kolmogorov-Smirnov plot; bromocriptine; generalized inverse Gaussian; leptin; quantile-quantile plot; statistical signal processing.
© The Author(s) 2024. Published by Oxford University Press on behalf of the Endocrine Society.
Figures


References
-
- Bellver J, Ayllón Y, Ferrando M, et al. Female obesity impairs in vitro fertilization outcome without affecting embryo quality. Fertil Steril. 2010;93(2):447‐454. - PubMed
-
- Mohamed WS, Hassanien M, Sayed Abokhosheim KE. Role of ghrelin, leptin and insulin resistance in development of metabolic syndrome in obese patients. Endocrinol Metabol Syndr. 2014;3(1):2161‐1017.
Grants and funding
LinkOut - more resources
Full Text Sources