. 2024 Aug 30:15:1434463.
doi: 10.3389/fimmu.2024.1434463. eCollection 2024.

Rigid crosslinking of the CD3 complex leads to superior T cell stimulation

Affiliations

Rigid crosslinking of the CD3 complex leads to superior T cell stimulation

Alfreda D Nelson et al. Front Immunol. .

Abstract

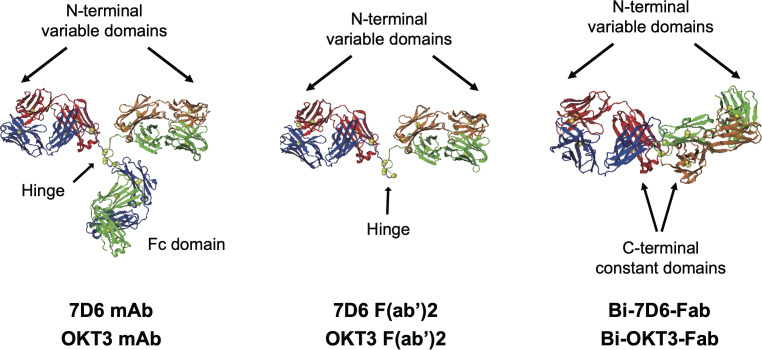
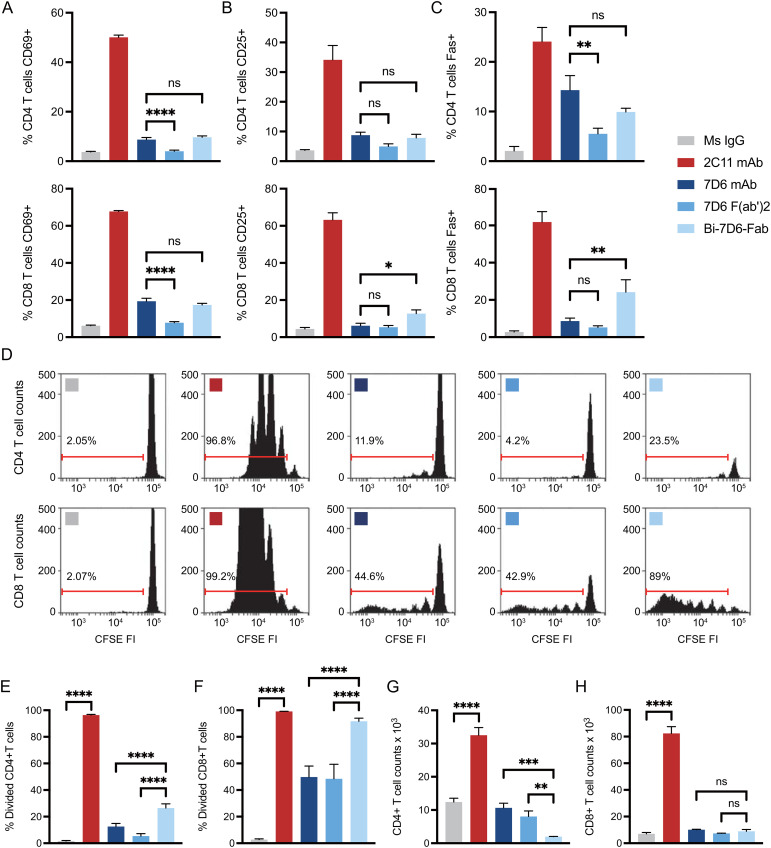
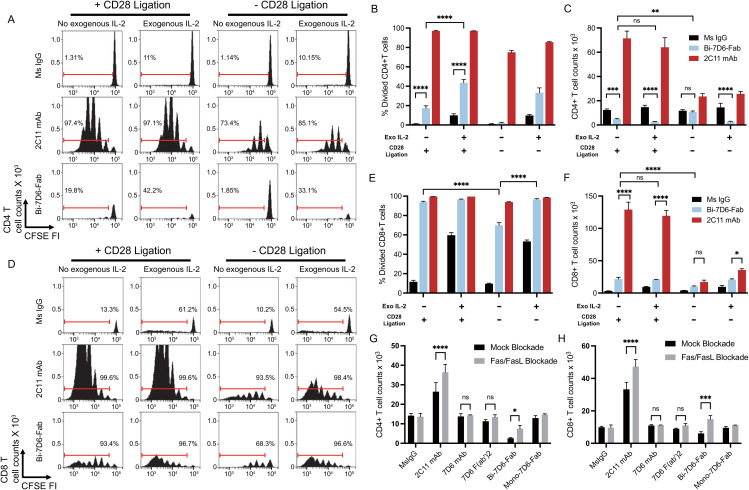
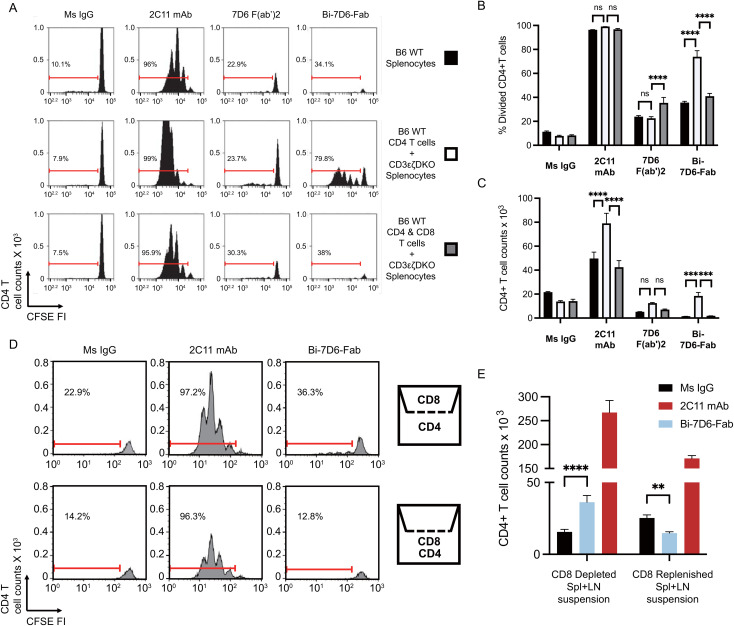
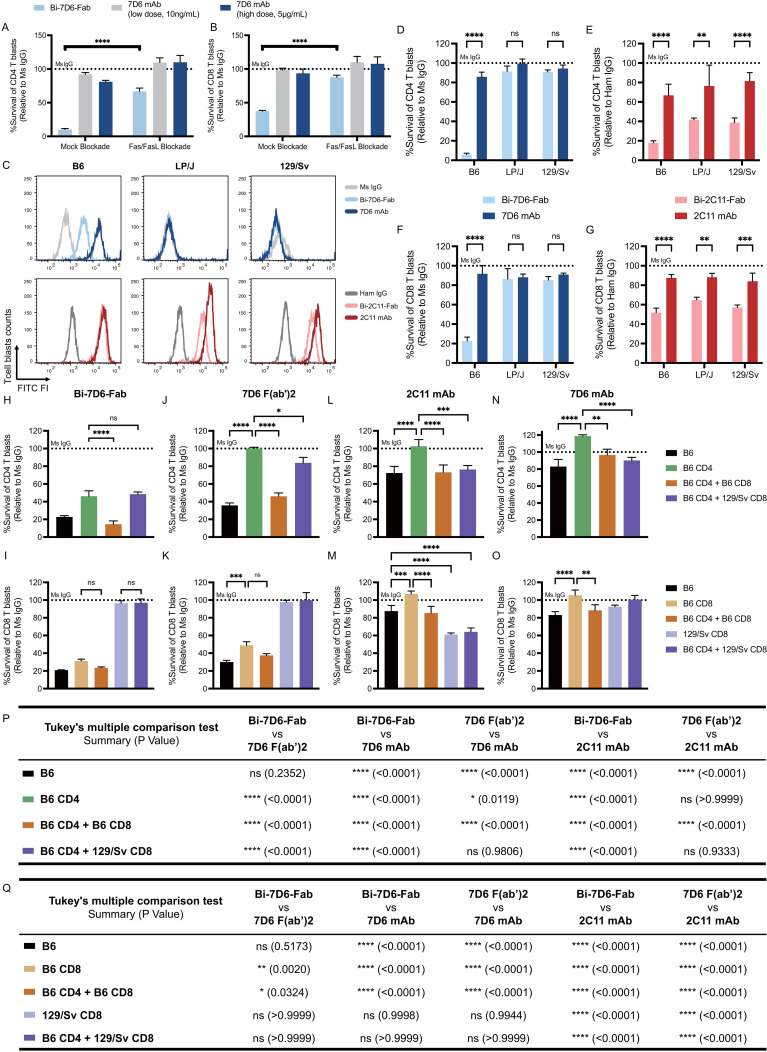
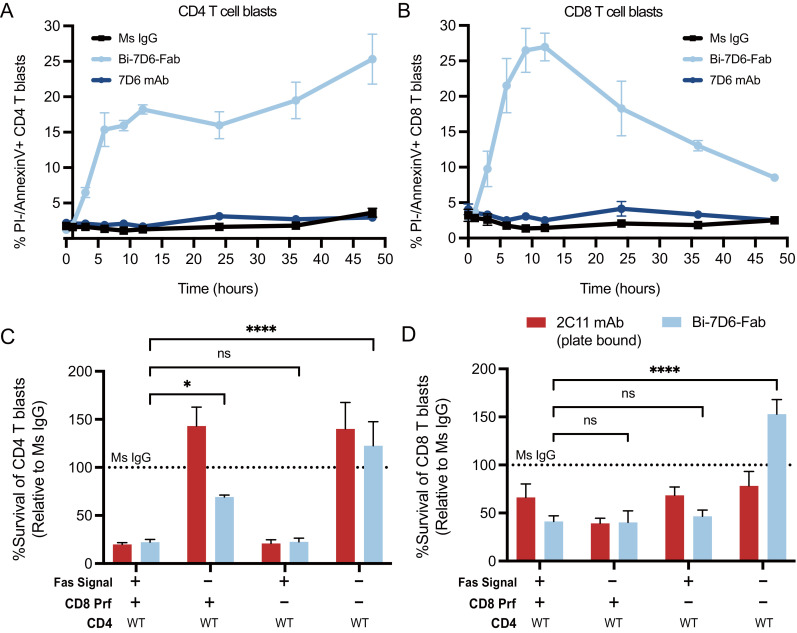
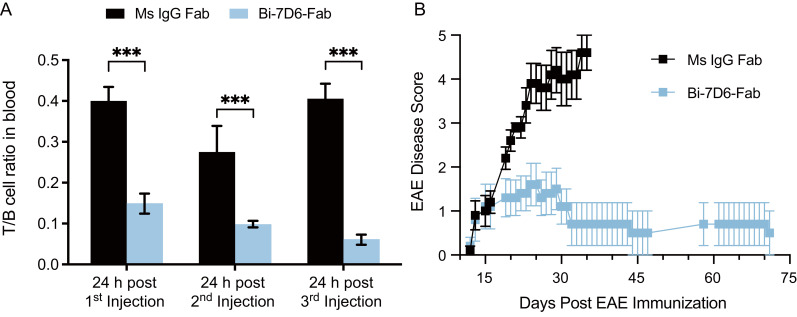
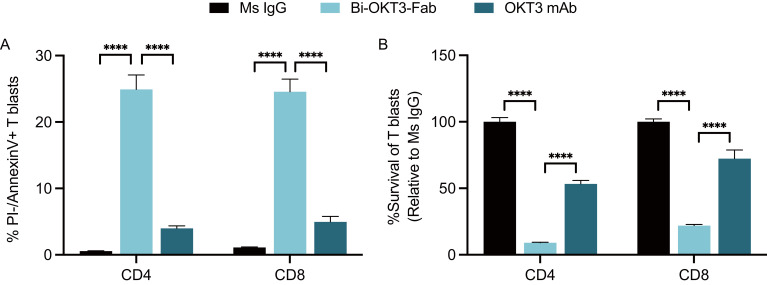
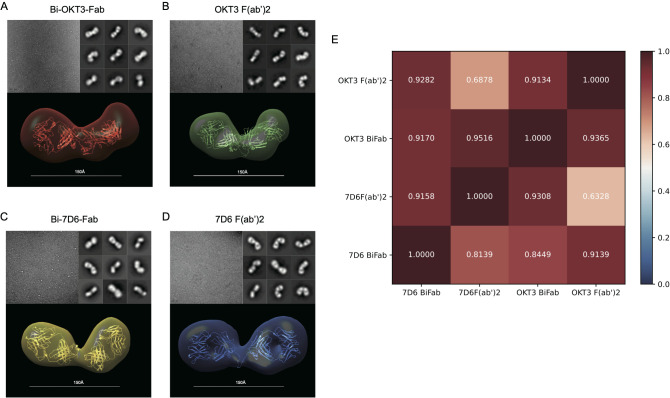
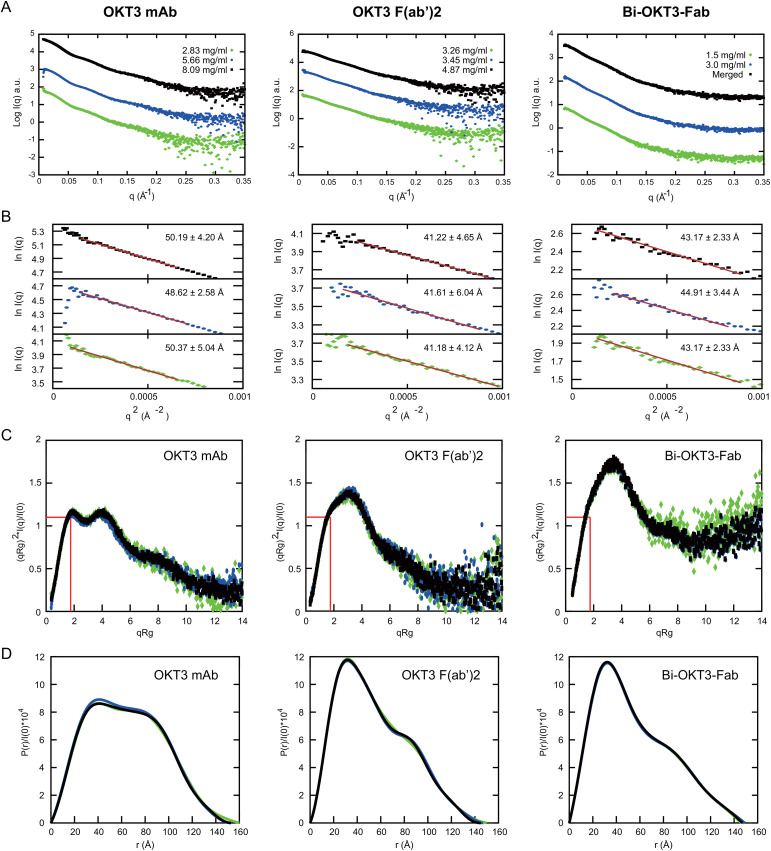
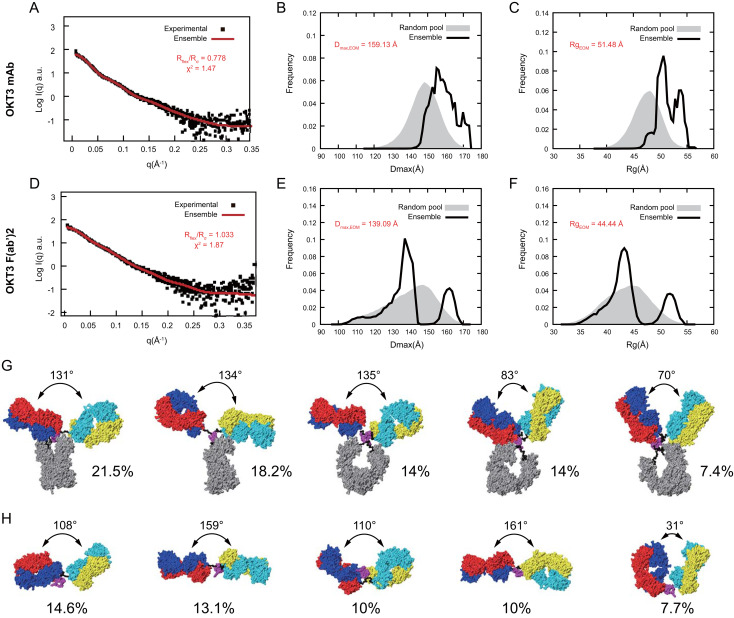
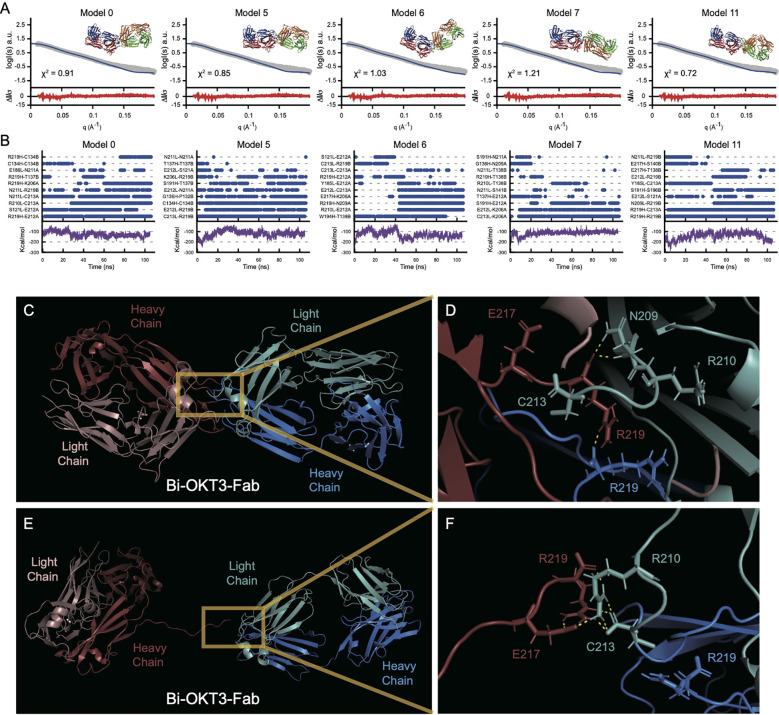
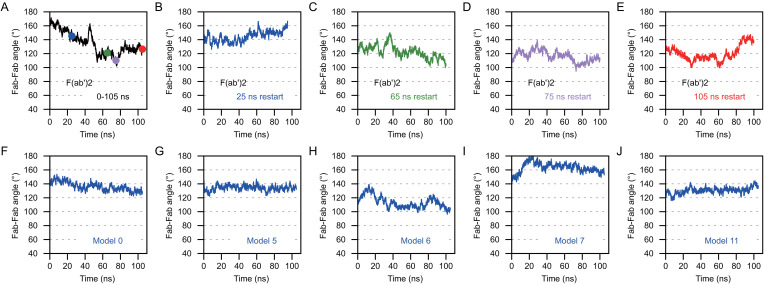
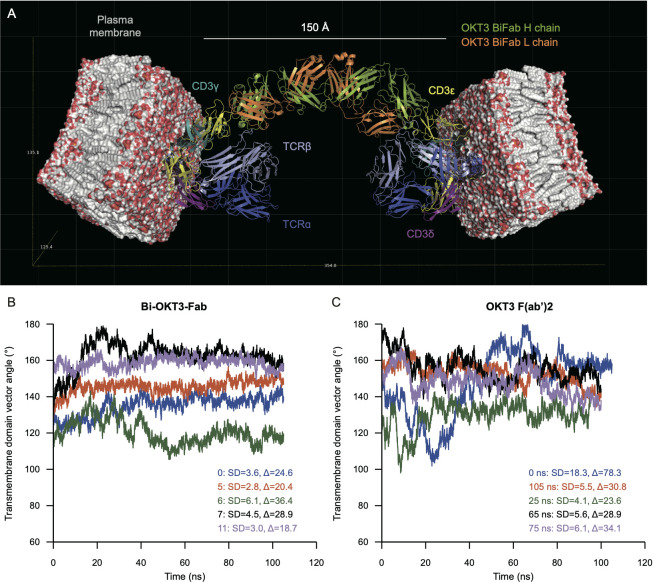
Functionally bivalent non-covalent Fab dimers (Bi-Fabs) specific for the TCR/CD3 complex promote CD3 signaling on T cells. While comparing functional responses to stimulation with Bi-Fab, F(ab')2 or mAb specific for the same CD3 epitope, we observed fratricide requiring anti-CD3 bridging of adjacent T cells. Surprisingly, anti-CD3 Bi-Fab ranked first in fratricide potency, followed by anti-CD3 F(ab')2 and anti-CD3 mAb. Low resolution structural studies revealed anti-CD3 Bi-Fabs and F(ab')2 adopt similar global shapes with CD3-binding sites oriented outward. However, under molecular dynamic simulations, anti-CD3 Bi-Fabs crosslinked CD3 more rigidly than F(ab')2. Furthermore, molecular modelling of Bi-Fab and F(ab')2 binding to CD3 predicted crosslinking of T cell antigen receptors located in opposing plasma membrane domains, a feature fitting with T cell fratricide observed. Thus, increasing rigidity of Fab-CD3 crosslinking between opposing effector-target pairs may result in stronger T cell effector function. These findings could guide improving clinical performance of bi-specific anti-CD3 drugs.

Keywords: CD3/antibody crosslinking; EAE (experimental autoimmune encephalomyelitis); T cell division and apoptosis; T cell receptor engagement and triggering; anti-CD3 Fab-based therapies; antibody fragment structure; molecular dynamic simulation.


Conflict of interest statement

The authors declare that the research was conducted in the absence of any commercial or financial relationships that could be construed as a potential conflict of interest. The author(s) declared that they were an editorial board member of Frontiers, at the time of submission. This had no impact on the peer review process and the final decision.

Figures

Figure 1
Figure 1
Structures of antibodies used in this work. Heavy chains are blue and green, light chains red and orange, disulfide sulfurs are yellow spheres. OKT3 F(ab’)2 and Bi-OKT3-Fab models shown were used for MD. The mAb and F(ab’)2 structures come from PDB 1IGT (33). The Bi-OKT3-Fab structure was derived in this work. Except for one constant domain difference, sequences of 7D6 and OKT3 only varied in the CD3ε-binding variable domains.
Figure 2
Figure 2
Anti-CD3 Bi-7D6-Fab is competent to activate T cells. (A–D) CFSE labelled B6 peripheral lymphocytes were incubated with CpG and soluble IgGs prior flow cytometry. Percentage of T cells positive for the expression of (A) CD69 at 24 h, (B) CD25 at 48 h and (C) Fas at 72 h over the levels found for each marker on gated T cells in unstimulated control Ms IgG samples. (D) CFSE dilution on gated T cells at 96 h. Ranged gates over plots indicate percentage of divided T cells according to CFSE dilution. (E–H) B6 peripheral lymphocytes labeled with CFSE were incubated with CpG and soluble IgG species for 96 h prior flow cytometry analysis. (E, F) Frequency (%) of CD4 (E) and CD8 (F) T cells dividing according to their CFSE profile. (G, H) Total counts of CD4 (G) and CD8 (H) live T cells. All samples were triplicated. Error bars represent +/-SD from replicas. One-way ANOVA test (ns p > 0.05, * p ≤ 0.05, ** p ≤ 0.01, *** p ≤ 0.001, **** p ≤ 0.0001).
Figure 3
Figure 3
Stimulation of T cells with Bi-7D6-Fab induces AICD dependent on IL-2 and Fas/FasL signaling. (A–F) CFSE labeled B6 peripheral lymphocytes were incubated next with CpG and soluble IgGs in the presence of either Mock CD28 block (human control IgG) or CD28 block (human CTLA-4 IgG), and in the absence or presence of exogenous mouse IL-2. CFSE cell division profile, percentage division and total counts of live CD4 (A–C) and CD8 (D–F) T cells after 96 h. Red ranged gates in A and D indicate % of dividing T cells. (G, H) Next B6 peripheral lymphocytes were incubated with CpG and soluble IgGs in the presence of either Mock Fas/FasL block (control IgGs) or Fas/FasL block (Fas-Fc fusion protein and anti-FasL IgG) for 96 h. Total counts of live CD4 (G) and CD8 (H) T cells. Live CD4 T cells gated as PI- Thy1.2+ CD4+. Live CD8 T cells gated as PI- Thy1.2+ CD4-. All samples were triplicated. Error bars represent +/- SD from replicas when plotting frequency (%) values, and +/- SE from replicas when plotting counts. One-way ANOVA test (ns p > 0.05, * p ≤ 0.05, ** p ≤ 0.01, *** p ≤ 0.001, **** p ≤ 0.0001).
Figure 4
Figure 4
Crosslinking of the TCR/CD3 receptor by bivalent anti-CD3ε IgGs leads to T cell fratricide that involves cell to cell contact. (A–C) CFSE labeled B6 splenic lymphocytes were incubated with CpG and soluble IgGs for 96 h prior flow cytometry analysis. (A) CFSE cell division profiles with red ranged gates indicating frequencies (%) of dividing CD4 T cells. (B) Frequency (%) of CD4 T cells dividing according to their CFSE profile. (C) Total counts of live CD4 T cells. (D, E) Separate samples of purified splenic CD4 or CD8 T cells were CFSE labeled and then plated respectively into the lower and upper chambers of a trans-well plate or mixed into the lower chamber. Samples were then stimulated with CpG and soluble IgGs for 96 h prior flow cytometry analysis. (D) CFSE cell division profiles with red ranged gates indicating frequencies (%) of dividing CD4 T cells. (E) Total counts of live CD4 T cell counts. Live CD4 T cells gated as PI- Thy1.2+ CD4+. Divided CD4 T cells gated as shown in (D). All samples were triplicated. Error bars represent +/- SE from replicas. One-way ANOVA test (ns p > 0.05, * p ≤ 0.05, ** p ≤ 0.01, *** p ≤ 0.001, **** p ≤ 0.0001).
Figure 5
Figure 5
Bivalent anti-CD3 IgG species directly bridge T cells to T cells during fratricide. (A, B) B6 T cell blasts were incubated 24 h with mouse IL-2 and soluble IgGs in the presence of mock treatment or Fas/FasL blockade treatment to be subjected to flow cytometry analysis of T cell survival. Survival of T cell blasts treated with Bi-7D6-Fab or 7D6 mAb are plotted as a % of the survival found in CD4 (A) and CD8 (B) T cell blasts treated with Ms IgG. (C) Cell surface CD3ε (MFI) detected on live T blasts (PI- Thy1.2+) from B6, LP/J or 129/Sv mouse strains when stained with the indicated IgGs. (D–G) Unfractionated T cell blasts from the mouse strains B6, LP/J or 129/Sv were incubated with the indicated IgGs for 24 h prior flow cytometry analysis of live T cells. Survival of CD4 (D, E) or CD8 (F, G) T cell blasts as % of blasts surviving when incubated with control IgGs. (H–O) Unfractionated, fractionated or mixtures of fractionated B6 or 129/Sv CD4 and CD8 T cell blasts were incubated with IgGs for 24 h prior flow cytometry analysis of live T cells. Survival of T cell blasts incubated with anti-CD3ε IgGs is plotted as a % of the blasts surviving when incubated with control Ms IgG. All samples were triplicated. Error bars represent +/- SD from replicas. One-way ANOVA test (ns p > 0.05, * p ≤ 0.05, ** p ≤ 0.01, *** p ≤ 0.001, **** p ≤ 0.0001). (P, Q) Statistic results of comparing survival of CD4 (P) or CD8 (Q) T cell blasts data in panel (H–O) between indicated IgGs. Tukey’s multiple comparison has been applied for Two-way ANOVA test (ns p > 0.05, * p ≤ 0.05, ** p ≤ 0.01, *** p ≤ 0.001, **** p ≤ 0.0001) under consideration of multiple variables.
Figure 6
Figure 6
Actively cycling T cell blasts undergo apoptotic fratricide in response to Bi-7D6-Fab treatment mediated by Fas/FasL and Perforin. (A, B) B6 T cell blasts were incubated with mouse IL-2 and soluble IgGs and subjected to flow cytometry analysis at several time points to detect T cell apoptosis. % PI- Annexin-V+ CD4 (A) and CD8 (B) T cell blasts were plotted against time. (C, D) Fractionated CD4 and CD8 T cell blasts from either B6 WT or Prf1-/- mice were mixed and incubated with the indicated IgGs for 24 h in the presence of mock or anti-FasL and Fas-Fc blockade prior flow cytometry analysis of live T cells. Survival of CD4 (C) and CD8 (D) T cell blasts are plotted as a % of the blasts surviving when incubated with control IgGs. Live CD4 T blasts gated as PI- Thy1.2+CD4+CD8-. Live CD8 T cell blasts gated as PI- Thy1.2+ CD4-CD8+. All samples were triplicated. Error bars represent +/- SD from replicas. One-way ANOVA test. (ns p > 0.05, * p ≤ 0.05, ** p ≤ 0.01, *** p ≤ 0.001, **** p ≤ 0.0001).
Figure 7
Figure 7
Bi-7D6-Fab depletion of peripheral T cells diminishes the course of EAE in B6 mice. B6 WT male mice were injected i.v. every 48 h from day 0 to 6 with a 20 μg dose of either Ms IgG Fab (n=5) or Bi-7D6-Fab (n=5). Three mice per IgG treatment were bled 24 h after each injection and PBMCs were isolated. (A) Ratio of T to B cell frequencies found in PBMCs by flow cytometry. Error bars represent +/- SE from replica samples. One-way ANOVA test (ns p > 0.05, * p ≤ 0.05, ** p ≤ 0.01, *** p ≤ 0.001, **** p ≤ 0.0001). On day 7, all mice were treated to induce EAE. Since then, mice were clinically scored for EAE external symptoms for 72 days when all surviving mice were terminated. (B) Average mean clinical score +/- SE of five mice per treatment was plotted against time.
Figure 8
Figure 8
Activated human T cells die by apoptosis when exposed to anti-human CD3ε Bi-OKT3-Fab. Human T cell blasts were treated with soluble IgGs for 24 h prior flow cytometry analysis of apoptosis and survival. (A) % of live CD4 and CD8 T cell blasts undergoing apoptosis as PI-, Annexin V+. (B) Survival of CD4 and CD8 T cell blasts when treated with OKT3 mAb or Bi-Fab are plotted as % of T cell blasts surviving when treated with control Ms IgG. Live CD4 T cell blasts gated as PI- Thy1.2+ CD4+ CD8-. Live CD8 T cell blasts gated as PI- Thy1.2+ CD4- CD8+. All samples were triplicated. Error bars represent +/- SD from replicas. One-way ANOVA test. (ns p > 0.05, * p ≤ 0.05, ** p ≤ 0.01, *** p ≤ 0.001, **** p ≤ 0.0001).
Figure 9
Figure 9
F(ab’)2 and Bi-Fab molecules have similar global shapes (A–D) Top-Left: Representative images for the optimized negative staining (OpNS) Electron Microscopy (EM) images of the indicated immunoglobulins. Top-Right: Examples of 2D-class averages for the indicated immunoglobulins for the 3D electron density maps. Bottom: Reconstructed 3D electron density maps overlaid with their corresponding homology models. (E) Goodness of fit between indicated immunoglobulins was calculated by Chimera with Fit in volume function based on spatial coincidence.
Figure 10
Figure 10
Small angle x-ray scattering (SAXS) analysis of OKT3 mAb, F(ab’)2 and Bi-OKT3-Fab (A) Scattering intensity plots (Log I(q) versus q) of indicated Igs. Bi-Fab merged scattering curve merges scattering data at low q range from the lower concentration with the higher q range from the higher concentration using Primus. (B) Guinier plots (Ln I(q) versus q2) corresponding to the SAXS curves in A. with the mAb (left), F(ab’)2 (center), and Bi-Fab (right). (C) Dimensionless Kratky plots with the position of Guinier–Kratky points ( 3 , 1.103) labeled with red lines, which is the main peak position for globular proteins (107). (D) normalized interatomic distance distribution (P(r)/I(0)) for the indicated OKT3 Igs.
Figure 11
Figure 11
OKT3 mAb and F(ab’)2 are flexible and preferentially adopt more Fab-Fab conformations >100° Ensemble optimization for mAb and F(ab’)2 using experimental SAXS curves and homology models. Fitting of the optimized ensemble SAXS curve to the experimental (A) mAb and (D) F(ab’)2 SAXS curves. Overlay of optimized ensemble Dmax values for the random pool and selected ensembles for (B) mAb and (E) F(ab’)2. Overlay of optimized ensemble Rg values for the random pool and selected ensembles for (C) mAb and (F) F(ab’)2. Rflex: Metric for quantitative measure of flexibility. Rσ: Variance of the distributions of the selected ensemble and that of the pool. Top five conformers identified by the optimized ensemble method for (G) mAb and (H) F(ab’)2.
Figure 12
Figure 12
Multiple stably interacting Bi-Fab models fit the experimental SAXS curves. (A) the Bi-OKT3-Fab models (model numbers indicated at the top left of each graph) extracted from the 105 ns time point were fitted (blue lines) to the experimental SAXS curve (grey curve) using Foxs fitting program (25). The Bi-OKT3-Fab structures are depicted to the upper right side of each graph, where Fab1 is depicted with red (heavy chain) and blue (light chain) and the Fab2 is depicted with orange (heavy) and light (green). The error weighted residuals are shown at the bottom of each fitting curve in red. (B) Multiple interacting amino acid pairs between Fab monomers is required for Bi-Fab stabilization. Individual graphs for Bi-Fab models, identifiers labeled at the top left of each pair of graphs. Upper graphs are a measure of the interaction times of the top eight amino acid pairs and was adapted from Liu et al. (108). Interaction times were determined by breaking the trajectories down into 1 ns intervals and atoms pairs that remained within 2 Å for at least half of the 1 ns interval are given a blue dot at the indicated time intervals. The lower graphs (purple lines) are the linear interaction energies (LIE) between Fab monomers over the entire trajectory and is a sum of the van der Waals and electrostatic interactions using the formula 0.15 * van der Waals + 0.5 * electrostatic interactions. (C–F) Example of Bi-OKT3-Fab model 11 interface. (C) After 105 ns of MD the tight interface of the right OKT3 (Blue) and left OKT3 (Red). (D) Close up of interface showing persistent N209-R219, R219-C213, and R219-R219 interactions. C213 and R219 are the C-terminal residues, and their backbone carboxyl groups participate in contacts. (E, F) Example of Bi-Fab model 11 interface after SMD for separation. (E) Retained interaction between Fabs in last frames of the Bi-OKT3-Fab model 11 after 5 ns steered molecular dynamics. (F) Close up of interface showing R219-R210, E217-R210, and retained R219 interaction with C213 which greatly hinder Fab separation in Bi-OKT3-Fab model 11.
Figure 13
Figure 13
Anti-CD3 Bi-OKT3-Fab display decreased Fab-Fab flexibility than F(ab’)2 Briefly, the Fab-Fab angle was measured by first drawing a vector that extended from the center of mass of the constant domain to the center of mass of the variable domain. This was done for Fab1 and Fab2 and the angle between the vectors was measured for F(ab’)2 and Bi-Fab. (A–E) The Fab-Fab angle measures for OKT3 F(ab’)2 homology model. The F(ab’)2 starting models for B-E were obtained from the indicated time point from the trajectory shown in (A) and are color coded according to the time point the starting models originated from. (F–J) Fab-Fab angle measurements for the indicated Bi-OKT3-Fab models over a 105 ns trajectory.
Figure 14
Figure 14
Molecular modeling predicts binding to TCR complexes in distinct cells that is more rigid for Bi-OKT3-Fab than F(ab’)2. (A) Docking of Bi-OKT3-Fab model 11 to two human TCR/CD3 complexes (PDB ID: 6XJR) located in two separated T cells, as described in Materials and Methods. Model 11 has the TCR complexes embedded in 100 x 100 Å phosphatidylcholine (POPC) membranes. Bi-OKT3-Fab binds to the CD3εγ subunit in both TCR complexes. Note other binding modes for model 11 to CD3 dimers are compatible, such as Fabs binding to the CD3εδ subunit in both TCR/CD3 complexes or to CD3εγ and CD3εδ subunits in either TCR/CD3 complex. Docking a second Bi-Fab to the available CD3εδ dimer from the T cell membrane on the left side could reach another TCR/CD3 complex located on a different T cell. (B, C) Transmembrane vector angles in Bi-OKT3-Fab (B) and Bi-OKT3-Fab OKT3 F(ab’)2 (C) MD. The standard deviations (SD) and ranges (∆) are from the 20-100 ns intervals of each MD trajectory. The F(ab’)2 trajectories are for the initial (0 ns) or indicated restarts.

Similar articles

References

    1. Perez P, Hoffman RW, Shaw S, Bluestone JA, Segal DM. Specific targeting of cytotoxic T cells by anti-T3 linked to anti-target cell antibody. Nature. (1985) 316:354–6. doi: 10.1038/316354a0 - DOI - PubMed
    1. Perez P, Titus JA, Lotze MT, Cuttitta F, Longo DL, Groves ES, et al. . Specific lysis of human tumor cells by T cells coated with anti-T3 cross-linked to anti-tumor antibody. J Immunol. (1986) 137:2069–72. doi: 10.4049/jimmunol.137.7.2069 - DOI - PubMed
    1. Schwerdtfeger M, Benmebarek M-R, Endres S, Subklewe M, Desiderio V, Kobold S. Chimeric antigen receptor–modified T cells and T cell–engaging bispecific antibodies: different tools for the same job. Curr Hematol Malig Rep. (2021) 16:218–33. doi: 10.1007/s11899-021-00628-2 - DOI - PMC - PubMed
    1. Lum LG, Thakur A, Elhakiem A, Alameer L, Dinning E, Huang M. Anti-CS1 × Anti-CD3 bispecific antibody (BiAb)-armed anti-CD3 activated T cells (CS1-BATs) kill CS1+ Myeloma cells and release type-1 cytokines. Front Oncol. (2020) 10. doi: 10.3389/fonc.2020.00544 - DOI - PMC - PubMed
    1. Wei J, Yang Y, Wang G, Liu M. Current landscape and future directions of bispecific antibodies in cancer immunotherapy. Front Immunol. (2022) 13. doi: 10.3389/fimmu.2022.1035276 - DOI - PMC - PubMed

MeSH terms

Substances

LinkOut - more resources