. 2024 Aug 30:15:1445294.
doi: 10.3389/fimmu.2024.1445294. eCollection 2024.

The influence of 4G/5G polymorphism in the plasminogen-activator-inhibitor-1 promoter on COVID-19 severity and endothelial dysfunction

Affiliations

The influence of 4G/5G polymorphism in the plasminogen-activator-inhibitor-1 promoter on COVID-19 severity and endothelial dysfunction

Tetiana Yatsenko et al. Front Immunol. .

Abstract

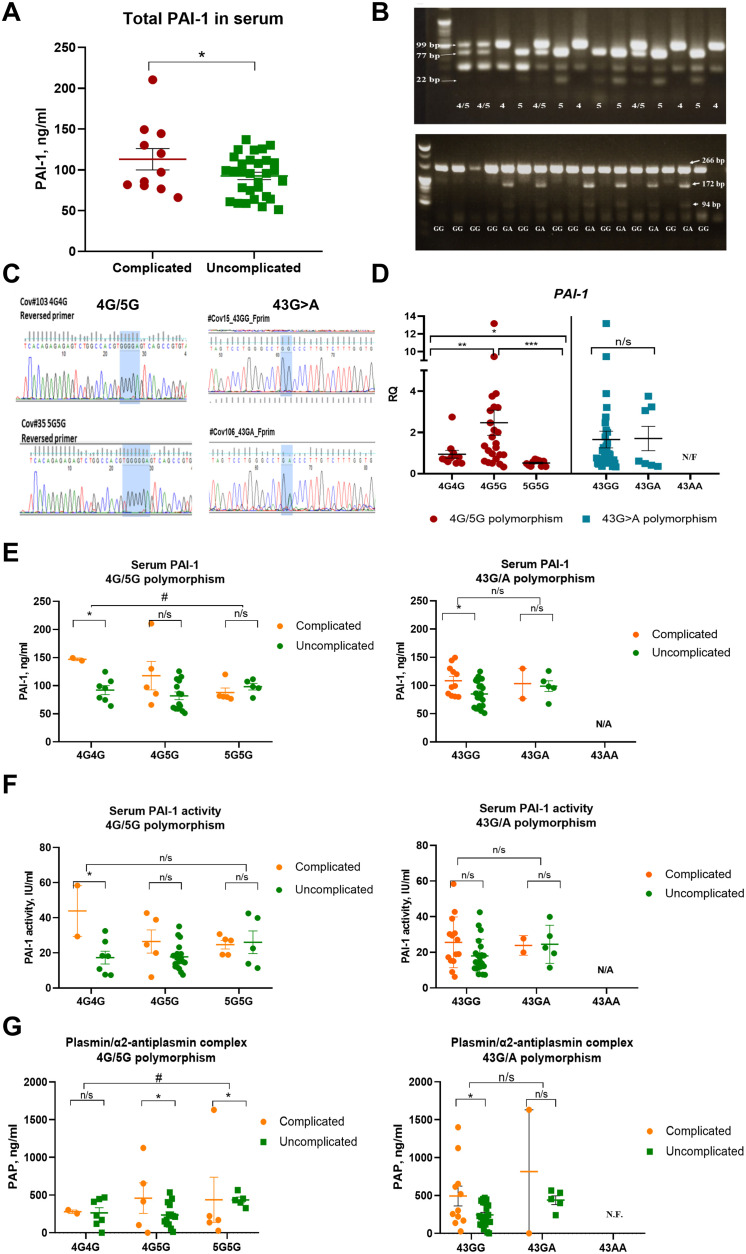
Introduction: Plasminogen activator inhibitor-1 (PAI-1) is linked to thrombosis and endothelial dysfunction in severe COVID-19. The +43 G>A PAI-1 and 4G/5G promoter polymorphism can influence PAI-1 expression. The 4G5G PAI-1 promoter gene polymorphism constitutes the 4G4G, 4G5G, and 5G5G genotypes. However, the impact of PAI-1 polymorphisms on disease severity or endothelial dysfunction remains unclear.

Methods: Clinical data, sera, and peripheral blood mononuclear cells (PBMCs) of COVID-19 patients were studied.

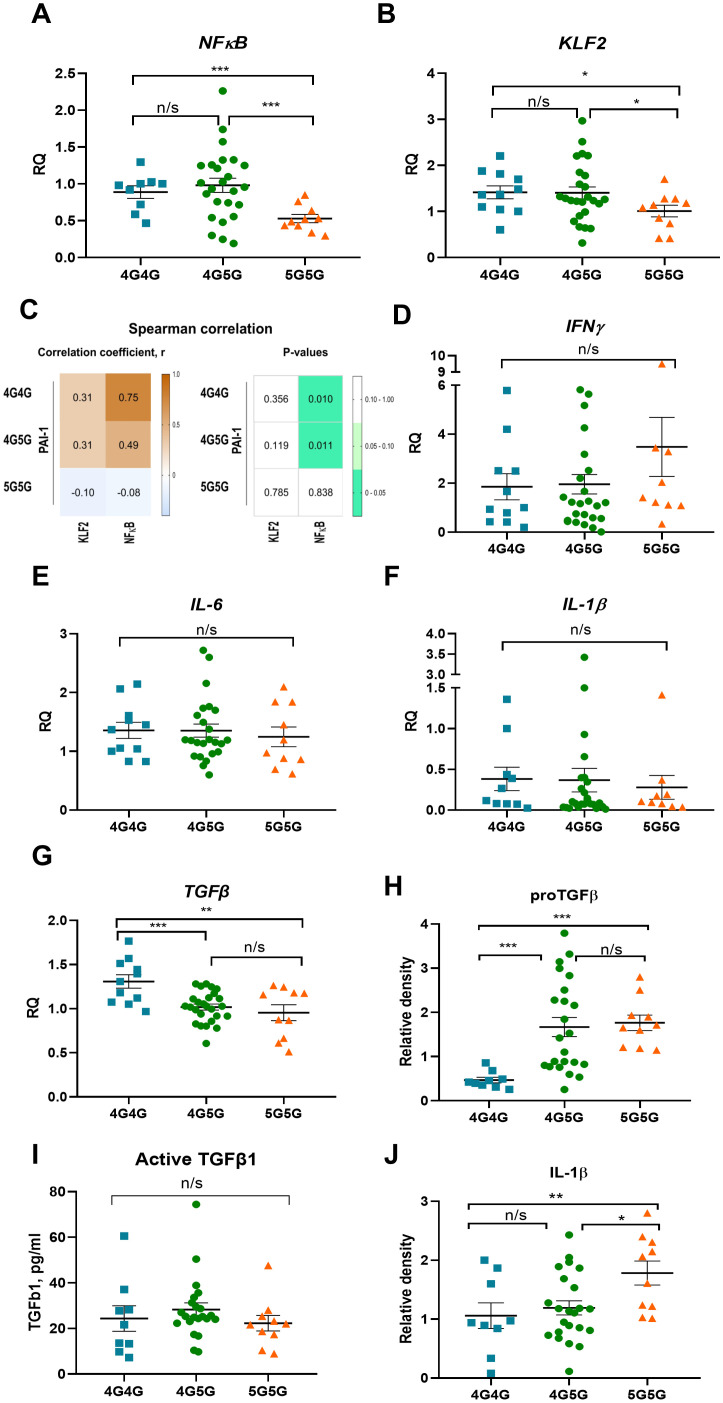
Results: Comorbidities and clinical biomarkers did not correlate with genotypes in either polymorphism. However, differences between fibrinolytic factors and interleukin-1β (IL-1β) were identified in genotypes of the 4G/5G but not the 43 G>A PAI polymorphism. Patients with the 4G4G genotype of the 4G/5G polymorphism showed high circulating PAI-1, mainly complexed with plasminogen activators, and low IL-1β and plasmin levels, indicating suppressed fibrinolysis. NFκB was upregulated in PBMCs of COVID-19 patients with the 4G4G genotype.

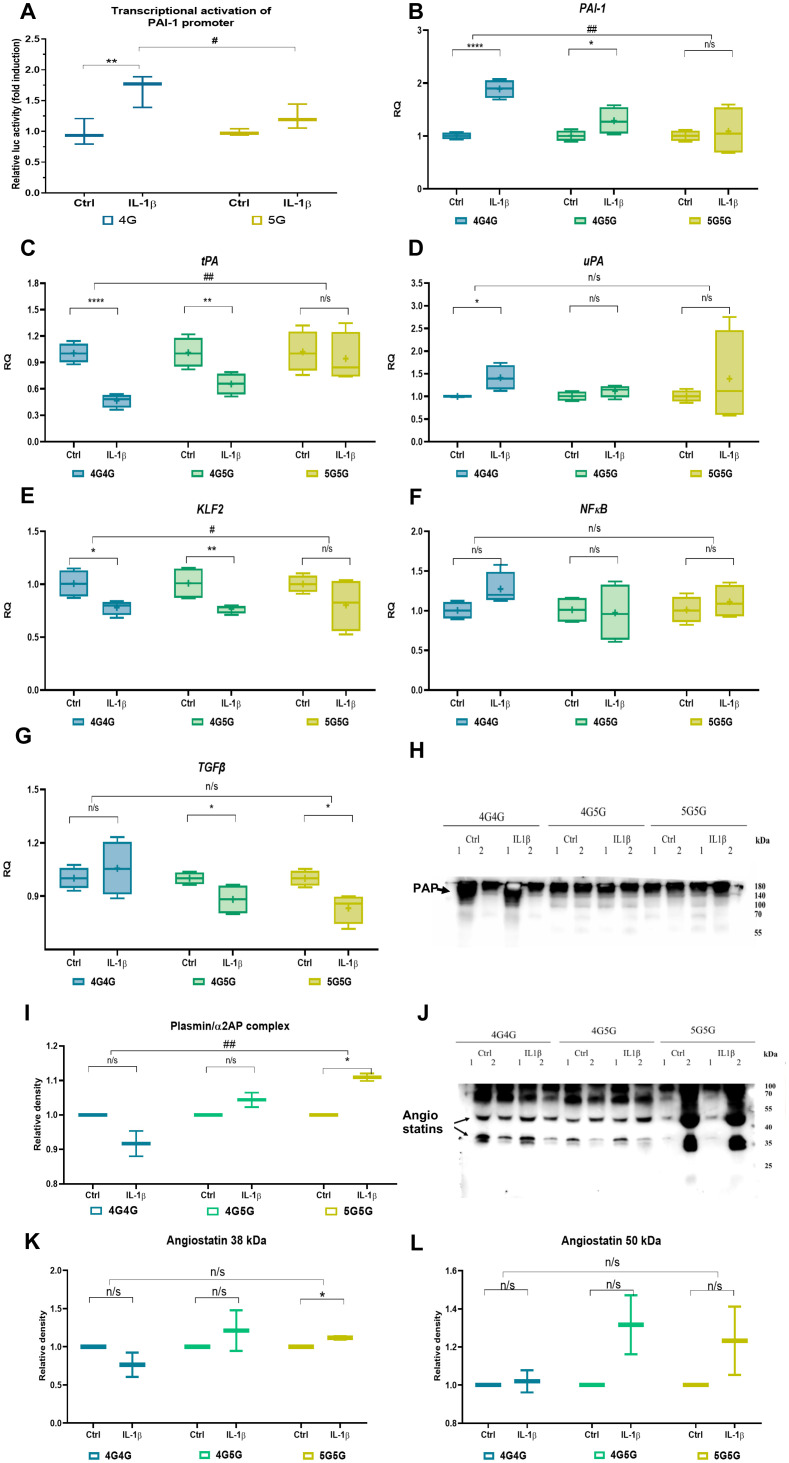
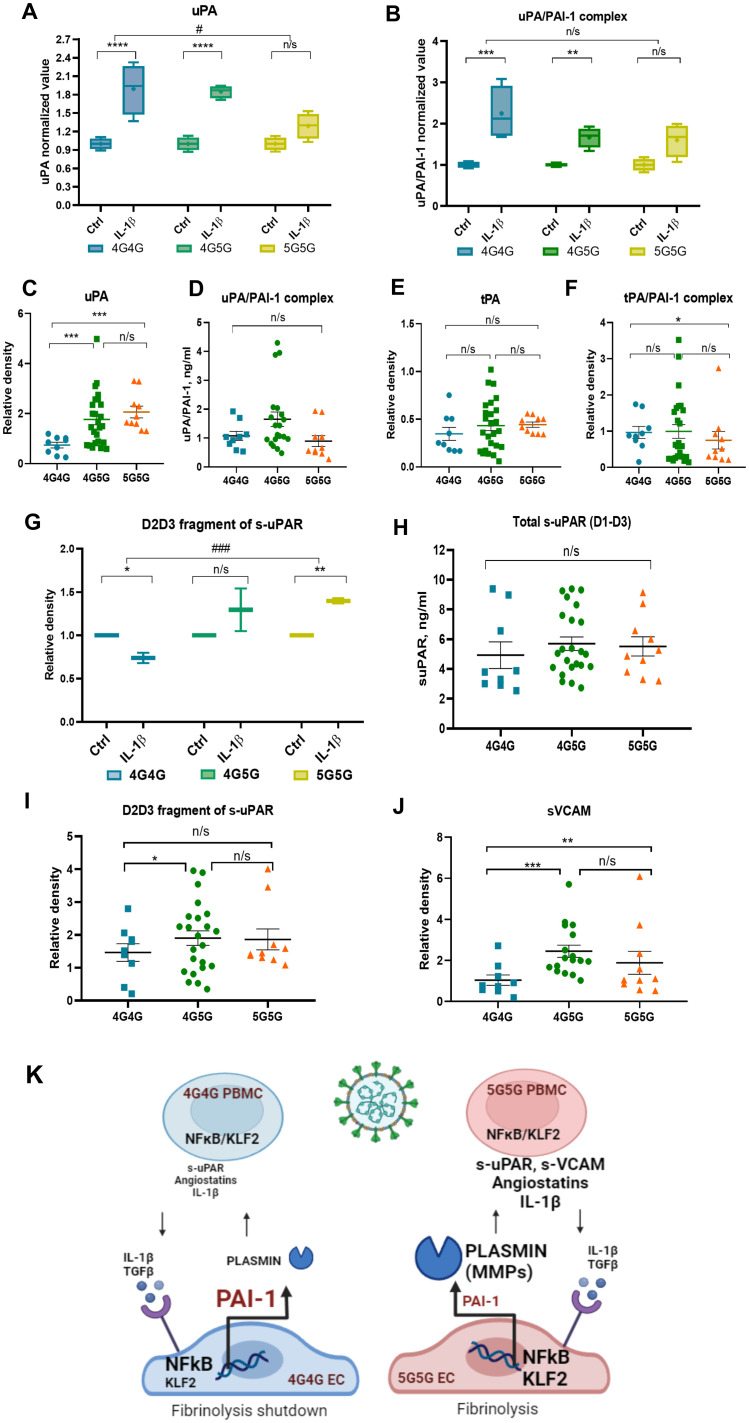
Discussion: Mechanistically, IL-1β enhanced PAI-1 expression in 4G4G endothelial cells, preventing the generation of plasmin and cleavage products like angiostatin, soluble uPAR, and VCAM1. We identified inflammation-induced endothelial dysfunction coupled with fibrinolytic system overactivation as a risk factor for patients with the 5G5G genotype.

Keywords: COVID-19; PAI-1 4G/5G promoter polymorphism (rs1799889); PAI-1 polymorphism +43G>A (rs6092); endothelial cells; inflammation; plasmin; interleukin-1-β; plasminogen activator inhibitor-1.


Conflict of interest statement

The authors declare that the research was conducted in the absence of any commercial or financial relationships that could be construed as a potential conflict of interest.

Figures

Figure 1
Figure 1
The 4G allele of the PAI-1 promoter is associated with higher PAI-1 transcript and lower plasmin activity in COVID-19 patients. (A) PAI-1 levels as measured by ELISA in the study cohort (n=43). (B) Polymerase chain reaction-restriction fragment length polymorphism (PCR-RFLP) analyses of all patient samples showed allele-specific fragments after restriction enzyme treatment. (C) Examples of Sanger Sequencing for confirmation of the identified PAI-1 4G/5G rs1799889 and +43G>A (rs6092) polymorphisms. In the study group, we did not find the 43AA genotype. Therefore, no data were available (not found, N/F) for this genotype in panels (D–G). (D) Fold change in PAI-1 expression in peripheral mononuclear cells (PBMCs) of COVID-19 patients sorted by genotype (n=42). The expression of indicated genes is normalized to the endogenous reference β-actin and presented as a relative fold change to the expression in 4G/4G groups according to the comparative Ct method (2−ΔΔCt). Experiments were repeated twice with samples run in triplicates each. (E) Circulating total PAI-1 protein sorted according to genotypes (data set is the same as in panel (A). (F) PAI-1 activity after sorting in genotypes as determined by ELISA [reanalysis of original data published (15)]. (G) Serum plasmin/a2-antiplasmin complex levels by ELISA. Dots in each panel represent data from one patient sample. N.F., not found, N/A, not available. Data represent mean ± SEM with p values from unpaired Student’s t-test or the Mann-Whitney test. # p<0.05; * p<0.05; ** p<0.01; *** <0.005; n/s, not significant.
Figure 2
Figure 2
Circulating proTGFβ and IL-1β protein but not cytokine transcripts in PBMC of COVID-19 patients were higher in 5G5G patients. NFkB (A) and KLF2 (B) expression in PBMCs of COVID-19 patients were sorted for genotypes of the 4G5G PAI-1 promoter polymorphism. (C) Heat map of Spearman’s correlation coefficient between 4G5G PAI-1 polymorphism coefficient and the transcription factors NFκB and KLF2 in COVID-19 patients. The correlation coefficients are represented in the white-brown color intensity change (left panel), as shown in the color bar. P-values of the parameter correlations are given using white-green color coding (right panel). P values were statistically significant (p<0.05) with 95% CIs for each correlation coefficient. (D–G) Fold change in IFNg (D), IL-6 (E), IL-1b (F), and TGFβ (G), expression in PBMCs of COVID-19 patients sorted for genotypes of 4G5G PAI-1 promoter polymorphism. The expression of the indicated genes is normalized to the endogenous reference β-actin and presented as a relative fold change to expression in 4G/4G groups according to the comparative Ct method (2−ΔΔCt). Gene expression data: Experiments were repeated twice using at least 2-3 samples per test group. (H, I) Analysis of proTGFβ (H) by western blotting, active TGFβ by ELISA (I), and IL-1β by western blotting (J) in sera of COVID-19 patients. (H, I) Western data are quantified by band intensity data normalized to a sample from a healthy donor and are the reanalysis of original data published in (15). Data represent mean ± SEM. Depending on the sample normality, p values were determined using the unpaired Student’s t-test or the Mann-Whitney test. * p<0.05; ** p<0.01; *** <0.005; n/s, not significant.
Figure 3
Figure 3
IL-1β establishes an anti-fibrinolytic gene expression profile in 4G4G primary endothelial cells (ECs). (A) Transcriptional activation of the human PAI-1 promoter by recIL-1β. HUVEC cells were transiently transfected with the PAI-1 4G and 5G luciferase reporter plasmids. Cells were treated with or without IL-1β for 24 hours before lysis. Firefly luciferase activity was normalized to Renilla luciferase activity and is expressed as fold change to controls. Data shown are the mean ± SEM of triplicates from a representative experiment (n=3/group). (B–G) Fold change in PAI-1 (B), tPA (C), and uPA (D), KLF2 (E), NFκB (F), and TGFb (G) expression in cultured 4G4G, 4G5G, or 5G5G ECs stimulated with rec IL-1β (two independent experiments using two different cell origins per genotype were performed; data shown are from one experiment; n=4/group). The expression of the indicated genes is normalized to the endogenous reference β-actin and presented as a relative fold change to expression in the control expression of each genotype according to the comparative Ct method (2−ΔΔCt). (H) Immunoblot of plasmin/α2-antiplasmin complex (PAP) in an equal volume of supernatants of EC cultures. (I) Band intensity quantified of the G blot, whereby each recIL-1β sample was normalized to its control samples. (J–L) A representative immunoblot of Plg using supernatants from cultures treated with or without (control) IL-1β showed angiostatin fragments (J) after loading an equal volume of supernatants from EC cultures. Band intensity quantified of the I blot, whereby each recIL-1β sample was normalized to its control samples, showing the Plg cleavage fragment angiostatin at 38 kDa (K) and 50 kDa (L). All western blots were performed at least twice with similar results. # p<0.05; ## p<0.01; * p<0.05; ** p<0.01; *** p<0.005; n/s, not significant. In vitro data were presented as box plots to discriminate in vivo data from the following in vitro data. All experiments were done in triplicate, and two cell lines for each genotype were used.
Figure 4
Figure 4
The 4G4G genotype associates with high tPA/PAI-1 complexes and lower proteolytic fragments angiostatin 38kDa, s-uPAR, and sVACM1 in COVID-19 patient sera and rec IL-1β stimulated ECs. (A, B) ECs with known 4G5G PAI-1 promoter genotypes were cultured overnight with IL-1β. A representative immunoblot of uPA (A) and uPA/PAI-1 complex (B) and band intensity quantification after loading an equal volume of supernatants from EC cultures. (C) Free/uncomplexed uPA [(C); a reanalysis of original data published in (15)] after band quantification of an immunoblot in COVID-19 sera. Serum uPA/PAI-1 complex (D) levels measured by ELISA in COVID-19 patients with indicated genotypes. (E, F) Free/uncomplexed tPA (E) and tPA/PAI-1 complex (F) levels were determined by western blotting [data were analyzed according to genotypes: original data in (15)]. (G) Supernatants collected from rec IL-1β-and carrier/control-treated EC cultures were analyzed by western blot analysis for the D2D3 fragment of s-uPAR. Band intensity was quantified by normalizing each rec IL-1β sample to its control sample. (H) Total s-uPAR (D1-D3) in COVID-19 sera as determined by ELISA. (I, J) Western blot analysis for s-uPAR/D2D3 (I) and sVCAM (J) in sera of COVID-19 patients sorted according to their genotypes for the 4G5G PAI-1 Promoter polymorphism [reanalysis of original data in (15)]. (K) Proposed model for the influence of the 4G5G polymorphism during SARS-CoV-2 infection with a robust inflammatory response: Higher IL-1β was found in the circulation of COVID-19 patients with the 5G5G genotype. IL-1β upregulates PAI-1 and NFκB expression in ECs with the 4G4G but not the 5G5G genotype. Cytokine (IL-1β)-induced PAI-1 forms complexes with its activators tPA and uPA, especially in the 4G4G genotype, resulting in impaired uPA and tPA-driven plasmin generation in the 4G4G genotype, ultimately generating a proteolytic shutdown. In ECs, IL-1β downregulates KLF2 expression, possibly to counterbalance PAI-1 upregulation. This process is the opposite in 5G5G EC. Low PAI-1 levels after IL-1β stimulation contribute to high active plasmin that further fuels IL-1β and TGFβ generation and establishes a proteolytic niche. In vitro data were presented as box plots to discriminate in vivo data from the following in vitro data. All experiments were done in triplicate, and two cell lines for each genotype were used. NFκB, Nuclear factor kappa-light-chain-enhancer of activated B cells; KLF2, Krüppel-like factor 2; PBMC, peripheral blood mononuclear cells; interleukin-1 β, IL-1β, TGF β, transforming growth factor-β; MMP, matrix metalloproteinase. Data represent mean ± SEM. Depending on the sample normality, p values were determined using the unpaired Student’s t-test or the Mann-Whitney test. * p<0.05; **p<0.01; *** p<0.001; n/s, not significant.

References

    1. Mackman N. Tissue factor and covid-19 associated thrombosis. Arteriosclerosis Thrombosis Vasc Biol. (2024) 44:523–9. doi: 10.1161/ATVBAHA.123.320144 - DOI - PMC - PubMed
    1. Heissig B, Salama Y, Takahashi S, Osada T, Hattori K. The multifaceted role of plasminogen in inflammation. Cell Signal. (2020) 75:109761. doi: 10.1016/j.cellsig.2020.109761 - DOI - PMC - PubMed
    1. Keragala CB, Medcalf RL. Plasminogen: an enigmatic zymogen. Blood 137(21):2881–9. - PubMed
    1. Munakata S, Tashiro Y, Nishida C, Sato A, Komiyama H, Shimazu H, et al. Inhibition of plasmin protects against colitis in mice by suppressing matrix metalloproteinase 9-mediated cytokine release from myeloid cells. Gastroenterology. (2015) 148:565–78.e4. doi: 10.1053/j.gastro.2014.12.001 - DOI - PubMed
    1. Tashiro Y, Nishida C, Sato-Kusubata K, Ohki-Koizumi M, Ishihara M, Sato A, et al. Inhibition of pai-1 induces neutrophil-driven neoangiogenesis and promotes tissue regeneration via production of angiocrine factors in mice. Blood. (2012) 119:6382–93. doi: 10.1182/blood-2011-12-399659 - DOI - PubMed

Substances

LinkOut - more resources