. 2024 Aug 15;35(3):102304.
doi: 10.1016/j.omtn.2024.102304. eCollection 2024 Sep 10.

Nanobody against SARS-CoV-2 non-structural protein Nsp9 inhibits viral replication in human airway epithelia

Affiliations

Nanobody against SARS-CoV-2 non-structural protein Nsp9 inhibits viral replication in human airway epithelia

Tomas Venit et al. Mol Ther Nucleic Acids. .

Abstract

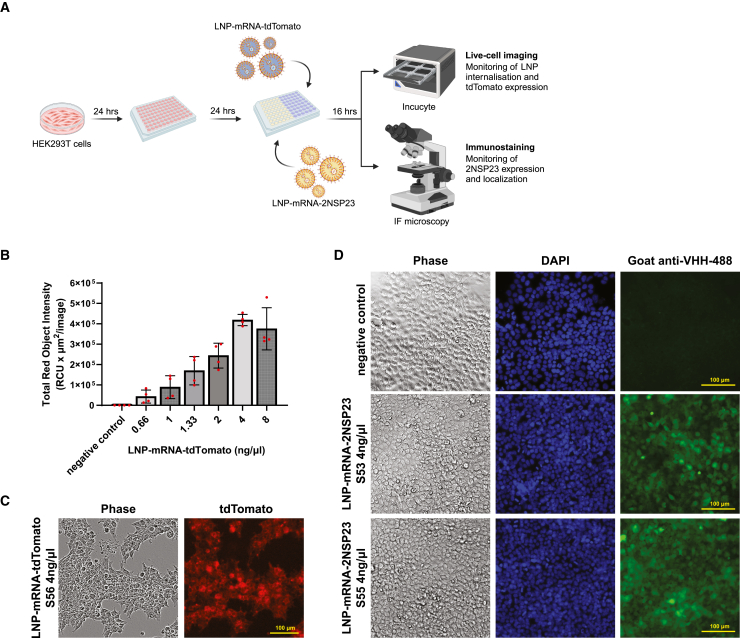
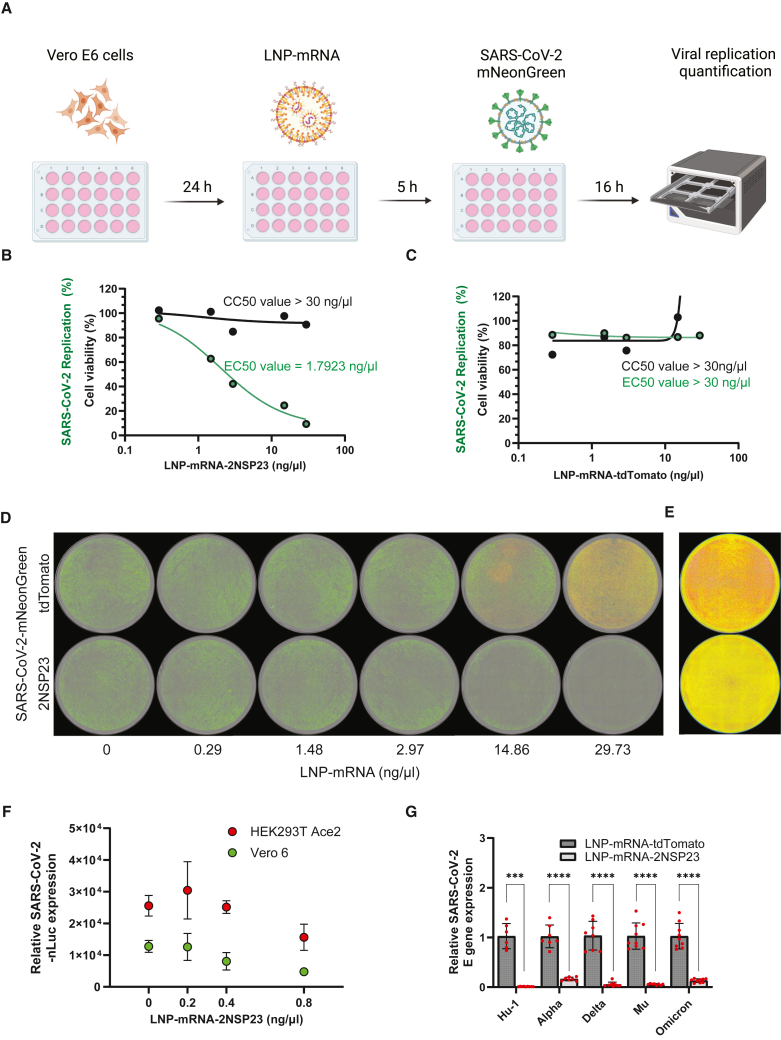
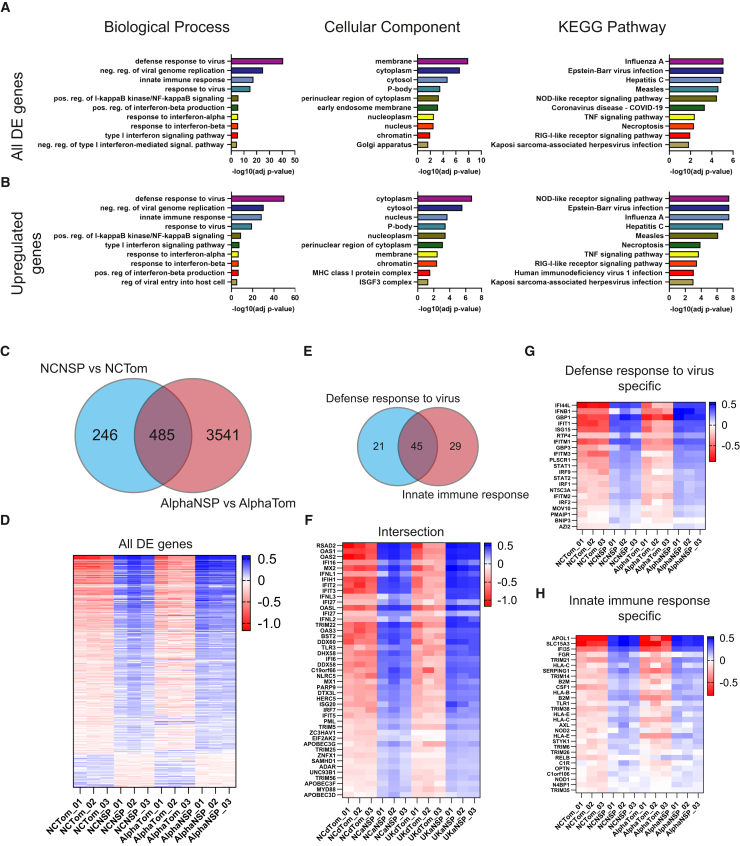
Nanobodies are emerging as critical tools for drug design. Several have been recently created to serve as inhibitors of severe acute respiratory syndrome coronavirus s (SARS-CoV-2) entry in the host cell by targeting surface-exposed spike protein. Here we have established a pipeline that instead targets highly conserved viral proteins made only after viral entry into the host cell when the SARS-CoV-2 RNA-based genome is translated. As proof of principle, we designed nanobodies against the SARS-CoV-2 non-structural protein (Nsp)9, which is required for viral genome replication. One of these anti-Nsp9 nanobodies, 2NSP23, previously characterized using immunoassays and nuclear magnetic resonance spectroscopy for epitope mapping, was expressed and found to block SARS-CoV-2 replication specifically. We next encapsulated 2NSP23 nanobody into lipid nanoparticles (LNPs) as mRNA. We show that this nanobody, hereby referred to as LNP-mRNA-2NSP23, is internalized and translated in cells and suppresses multiple SARS-CoV-2 variants, as seen by qPCR and RNA deep sequencing. These results are corroborated in three-dimensional reconstituted human epithelium kept at air-liquid interface to mimic the outer surface of lung tissue. These observations indicate that LNP-mRNA-2NSP23 is internalized and, after translation, it inhibits viral replication by targeting Nsp9 in living cells. We speculate that LNP-mRNA-2NSP23 may be translated into an innovative strategy to generate novel antiviral drugs highly efficient across coronaviruses.

Keywords: MT: LNP-based Delivery Strategies; Non-structural protein 9; Nsp9; SARS-CoV-2; innate immunity; nanobody.


Conflict of interest statement

P.P., G.E., H.T.H., and S.C.D. are part of a US patent filed by New York University in Abu Dhabi jointly with ISAR Biosciences.

Figures

None
Graphical abstract
Figure 1
Figure 1
Anti-NSP9 nanobody specifically reduces SARS-CoV-2 replication (A) Western blot analysis of stable cell lines expressing either anti-NSP9 (2NSP23) nanobody or aActin nanobody. Purified 2NSP23-6XHis nanobody was loaded as a positive control. Dox, doxycycline (Figure S2 for source images). (B) SARS-CoV-2 relative E gene expression in HEK293-ACE2 expressing either anti-NSP9 (2NSP23) or aActin nanobody (Table S1 for source file). Bars represent mean with error bars representing SD. ∗∗∗∗p<0.0001. (C) SARS-CoV-2 relative E gene expression in Huh-7.5 expressing either anti-NSP9 (2NSP23) or aActin nanobody (Table S2 for source file). Bars represent mean with error bars representing SD. ∗∗∗∗p<0.0001.
Figure 2
Figure 2
Testing of LNP-mRNA internalization and translation into a functional protein (A) Experimental pipeline of LNP-mRNA treatment and readouts done for the HEK293T cells. (B) Quantification of tdTomato red signal intensity by the Incucyte at 16 h post-treatment with different dilutions of LNP-mRNA-tdTomato (Table S3 for source file). Bars represent mean with error bars representing SD. (C) Representative images of tdTomato expression by the Incucyte at 16 h post-treatment with LNP-mRNA-tdTomato S56 1:50. (D) Immunofluorescent staining of the anti-NSP9 nanobody at 16 h post-treatment with LNP-mRNA-2NSP23 S53 1:50 and S55 1:50.
Figure 3
Figure 3
Inhibition of SARS-CoV-2 replication by LNP-mRNA-2NSP23 (A) Experimental pipeline for testing the LNP-mRNA effect on SARS-CoV-2 replication. (B) Vero E6 cells treated with serial dilution (29.7, 14.86, 2.97, 1.48, and 0.29 ng/μL) of LNP-mRNA-2NSP23 were infected with SARS-CoV-2-mNeonGreen, and green fluorescence and cell viability were quantified using Incucyte S3 imaging (Table S4 for source file). (C) Vero E6 cells treated with serial dilution (29.7, 14.86, 2.97, 1.48, and 0.29 ng/μL) of LNP-mRNA-tdTomato were infected with SARS-CoV-2-mNeonGreen, and green fluorescence and cell viability were quantified using Incucyte S3 imaging (Table S5 for source file). (D) Representative images from Incucyte S3 imaging system. The green color corresponds with the SARS-CoV-2-mNeonGreen-positive cells. The gradual yellow color indicates a concomitant expression of mNeonGreen (green) and tdTomato (red), respectively. (E) 16-color LUT transformation of the green channel (subtracting the signal from tdTomato) of the same Innucyte S3 Image showing only the SARS-CoV-2-mNeonGreen infected cells treated with 29.73 ng/μL of LNP-mRNAs in Figure 3D. The red color represents the SARS-CoV-2 positive cells. (F) Vero E6 (green) or HEK293-ACE2 (red) treated with the indicated concentration of LNP-mRNA-2NSP23 were infected with a SARS-CoV-2-nLuc viral strain and luciferase expression was quantified 24 h pi. Nano-luciferase values are normalized using control cells treated with LNP-mRNA-2tdTomato (Table S6 for source file). Dots represent mean with error bars representing SD. (G) HEK293-ACE2 cells treated with either 0.4 ng/μL of LNP-mRNA-2NSP23 or LNP-mRNA-tdTomato were infected with indicated SARS-CoV-2 viral strains. The SARS-CoV-2 E gene expression was quantified by qPCR and normalized to the control LNP-mRNA-tdTomato treated cells (Table S7 for source file). Bars represent mean with error bars representing SD. ∗∗∗p<0.001, ∗∗∗∗p<0.0001.
Figure 4
Figure 4
Nanobody treatment leads to a specific differential gene expression and suppression of SARS-CoV-2 replication (A) Overall alignment of sequencing reads to SARS-CoV-2 and human genomes in samples treated with LNP-mRNA-2NSP23 or LNP-mRNA-tdTomato in non-infected or SARS-CoV-2-infected cells. Bars represent mean with error bars representing SD. ∗∗p < 0.01, ∗∗∗p<0.001, ns (not significant). (B) A heatmap representation of the distance matrix clustering based on similarity between all experimental samples. (C) A heatmap representation of the distance matrix clustering based on similarity between non-infected (NC) and SARS-CoV-2 Alpha variant-infected (Alpha) cells treated either with LNP-mRNA-2NSP23 (NSP) or LNP-mRNA-tdTomato (Tom). (D) Principal component analysis plot of non-infected and SARS-CoV-2 Alpha variant-infected cells treated either with LNP-mRNA-2NSP23 or LNP-mRNA-tdTomato. (E) MA plot showing differential gene expression between SARS-CoV-2 infected (AlphaTom) and non-infected (NCTom) cells treated with LNP-mRNA-tdTomato. Each red dot represents a single DEG with up-regulated genes in the upper part of the MA lot and down-regulated genes in lower part of the MA plot. (F) MA plot showing differential gene expression between SARS-CoV-2 infected (AlphaNSP) and non-infected (NCNSP) cells treated with LNP-mRNA-2NSP23. Each red dot represents a single DEG with up-regulated genes in the upper part of the MA lot and down-regulated genes in lower part of the MA plot. (G) MA plot showing differential gene expression between SARS-CoV-2 infected cells treated with LNP-mRNA-2NSP23 (AlphaNSP) or control LNP-mRNA-tdTomato (AlphaTom). Each red dot represents a single DEG with up-regulated genes in the upper part of the MA lot and down-regulated genes in lower part of the MA plot. (H) MA plot showing differential gene expression between NCs treated with LNP-mRNA-2NSP23 (NCNSP) or treated with LNP-mRNA-tdTomato (NCTom). Each red dot represents a single DEG with up-regulated genes in the upper part of the MA lot and down-regulated genes in lower part of the MA plot.
Figure 5
Figure 5
SARS-CoV-2 virus infection leads to differential gene expression of RNA Polymerase II transcription-regulatory genes and mitochondrial genes (A) Top 10 GO terms associated with “biological process,” “cellular component,” and “KEGG pathway” groups based on the analysis of all DEGs between infected and uninfected cells treated with LNP-mRNA-tdTomato (AlphaTom vs. NCTom) (Table S8 for source file). (B) Top GO terms associated with “biological process,” “cellular component” and “KEGG pathway” groups based on the analysis of only up-regulated genes in infected cells treated with LNP-mRNA-tdTomato in comparison with uninfected cells treated with LNP-mRNA-tdTomato (Table S9 for source file). (C) Top GO terms associated with “biological process,” “cellular component,” and “KEGG pathway” groups based on the analysis of only down-regulated genes in infected cells treated with LNP-mRNA-tdTomato in comparison with uninfected cells treated with LNP-mRNA-tdTomato (Table S10 for source file). (D) Venn diagram showing the number of specific and common genes that are DE upon SARS-CoV-2 infection in cells treated with LNP-mRNA-tdTomato (AlphaTom vs. NCTom) and SARS-CoV-2 infection in cells treated with LNP-mRNA-2NSP23 (AlphaNSP vs. NCNSP). (E) Gene expression heatmap of normalized counts for each DEG between infected and uninfected cells treated with LNP-mRNA-tdTomato (AlphaTom vs. NCTom) across each sample replicate (Table S11 for source file). (F) Gene expression heatmap of normalized counts for each DEG associated with GO term “Regulation of Pol II transcription” between infected and uninfected cells treated with LNP-mRNA-tdTomato (AlphaTom vs. NCTom) across each sample replicate (Table S12 for source file). (G) Gene expression heatmap of normalized counts for each DEG associated with GO term “Mitochondria” between infected and uninfected cells treated with LNP-mRNA-tdTomato (AlphaTom vs. NCTom) across each sample replicate. Data available as a Source data file (Table S13 for source file).
Figure 6
Figure 6
Nanobody treatment induces changes in gene expression related to the host antiviral immune response regardless of the SARS-CoV-2 infection (A) Top 10 GO terms associated with “biological process,” “cellular component,” and “KEGG pathway” groups based on the analysis of all DEGs between NCs treated either with LNP-mRNA-2NSP23 or LNP-mRNA-tdTomato (NCNSP vs. NCTom) (Table S14 for source file). (B) Top GO terms associated with “biological process,” “cellular component,” and “KEGG pathway” groups based on the analysis of all up-regulated genes in NCs treated with LNP-mRNA-2NSP23 in comparison to NCs treated with LNP-mRNA-tdTomato (Table S15 for source file). (C) Venn diagram showing the number of specific and common genes which are DE in LNP-mRNA-2NSP23 treated NCs in comparison to LNP-mRNA-tdTomato uninfected cells (NCNSP vs. NCTom), and LNP-mRNA-2NSP23 treated SARS-CoV-2 infected cells in comparison to SARS-CoV-2 infected cells treated with LNP-mRNA-tdTomato (AlphaNSP vs. AlphaTom). (D) Gene expression heatmap of normalized counts for each DEG between LNP-mRNA-2NSP23 and LNP-mRNA-tdTomato-treated NCs (NCNSP vs. NCTom) across each sample replicate (Table S16 for source file). (E) Venn diagram showing the intersection of DEGs associated with GO terms “Defense response to virus” and “Innate immune response” in NCs treated with LNP-mRNA-2NSP23 or LNP-mRNA-tdTomato. (F) Gene expression heatmap of normalized counts for each DEG found in the intersection between GO terms “Defense response to virus” and “Innate immune response” in NCs treated with LNP-mRNA-2NSP23 or LNP-mRNA-tdTomato (Table S17 for source file). (G) Gene expression heatmap of normalized counts for each DEG specific for GO term “Defense response to virus” in NCs treated with LNP-mRNA-2NSP23 or LNP-mRNA-tdTomato (Table S18 for source file). (H) Gene expression heatmap of normalized counts for each DEG specific for GO term “Innate immune response” in NCs treated with LNP-mRNA-2NSP23 or LNP-mRNA-tdTomato (Table S19 for source file).
Figure 7
Figure 7
LNP-mRNA-2NSP23 blocks viral replication in 3D reconstituted human upper airway epithelium tissues in an air-liquid interphase environment (A) Relative quantification of SARS-CoV-2 E gene expression in 3D reconstituted epithelium treated with either LNP-mRNA-2NSP23 or LNP-mRNA-tdTomato 48 h pi (Table S20 for source file). Bars represent mean with error bars representing SD. ∗∗∗∗p<0.0001. (B) Relative quantification of SARS-CoV-2 E gene expression in 3D reconstituted epithelium treated with either LNP-mRNA-2NSP23 or LNP-mRNA-tdTomato 96 h pi (Table S21 for source file). Bars represent mean with error bars representing SD. ∗∗∗∗p<0.0001. (C) Schematic view of nanobody-based therapy against SARS-CoV-2. mRNA coding for 2NSP23 nanobody against viral NSP9 is mixed with a combination of lipids to form mRNA encapsulated in LNPs. LNPs are internalized in cells and mRNA is released for translation into functional nanobody, which blocks viral replication in cells.

References

    1. Hamre D., Procknow J.J. A new virus isolated from the human respiratory tract. Proc. Soc. Exp. Biol. Med. 1966;121:190–193. doi: 10.3181/00379727-121-30734. - DOI - PubMed
    1. McIntosh K., Kapikian A.Z., Turner H.C., Hartley J.W., Parrott R.H., Chanock R.M. Seroepidemiologic studies of coronavirus infection in adults and children. Am. J. Epidemiol. 1970;91:585–592. doi: 10.1093/oxfordjournals.aje.a121171. - DOI - PMC - PubMed
    1. van der Hoek L., Pyrc K., Jebbink M.F., Vermeulen-Oost W., Berkhout R.J.M., Wolthers K.C., Wertheim-van Dillen P.M.E., Kaandorp J., Spaargaren J., Berkhout B. Identification of a new human coronavirus. Nat. Med. 2004;10:368–373. doi: 10.1038/nm1024. - DOI - PMC - PubMed
    1. Woo P.C.Y., Lau S.K.P., Chu C.M., Chan K.H., Tsoi H.W., Huang Y., Wong B.H.L., Poon R.W.S., Cai J.J., Luk W.K., et al. Characterization and complete genome sequence of a novel coronavirus, coronavirus HKU1, from patients with pneumonia. J. Virol. 2005;79:884–895. doi: 10.1128/JVI.79.2.884-895.2005. - DOI - PMC - PubMed
    1. Matoba Y., Abiko C., Ikeda T., Aoki Y., Suzuki Y., Yahagi K., Matsuzaki Y., Itagaki T., Katsushima F., Katsushima Y., Mizuta K. Detection of the human coronavirus 229E, HKU1, NL63, and OC43 between 2010 and 2013 in Yamagata, Japan. Jpn. J. Infect. Dis. 2015;68:138–141. doi: 10.7883/yoken.JJID.2014.266. - DOI - PubMed