[Preprint]. 2024 Sep 5:2024.09.04.24313004.
doi: 10.1101/2024.09.04.24313004.

Gut Microbiome Compositional and Functional Features Associate with Alzheimer's Disease Pathology

Affiliations

Gut Microbiome Compositional and Functional Features Associate with Alzheimer's Disease Pathology

Jea Woo Kang et al. medRxiv. .

Update in

  • Gut microbiome compositional and functional features associate with Alzheimer's disease pathology.
    Kang JW, Khatib LA, Heston MB, Dilmore AH, Labus JS, Deming Y, Schimmel L, Blach C, McDonald D, Gonzalez A, Bryant M, Ulland TK, Johnson SC, Asthana S, Carlsson CM, Chin NA, Blennow K, Zetterberg H, Rey FE; Alzheimer Gut Microbiome Project Consortium; Kaddurah-Daouk R, Knight R, Bendlin BB. Kang JW, et al. Alzheimers Dement. 2025 Jul;21(7):e70417. doi: 10.1002/alz.70417. Alzheimers Dement. 2025. PMID: 40604345 Free PMC article.

Abstract

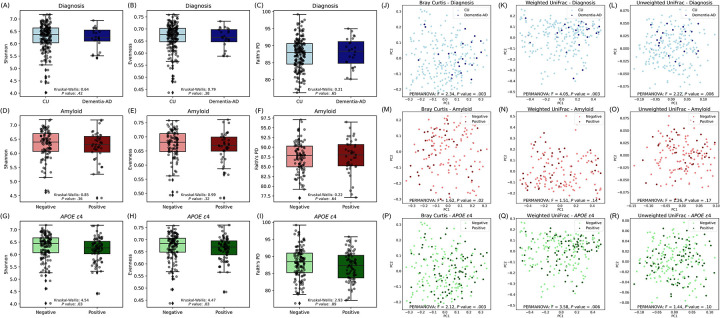
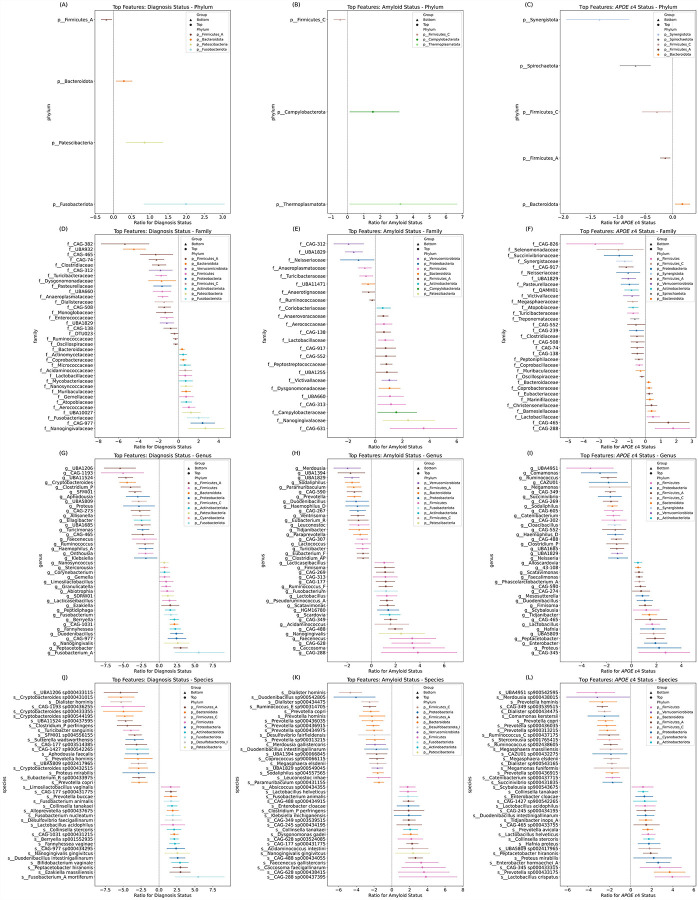
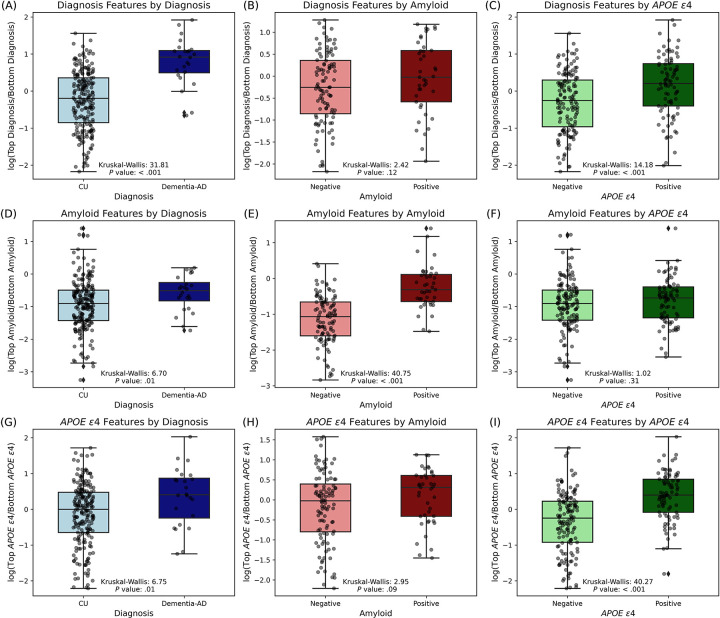
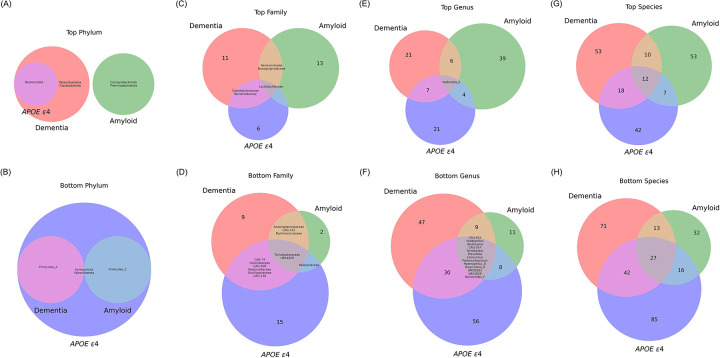
Background: The gut microbiome is a potentially modifiable factor in Alzheimer's disease (AD); however, understanding of its composition and function regarding AD pathology is limited.

Methods: Shallow-shotgun metagenomic data was used to analyze fecal microbiome from participants enrolled in the Wisconsin Microbiome in Alzheimer's Risk Study, leveraging clinical data and cerebrospinal fluid (CSF) biomarkers. Differential abundance and ordinary least squares regression analyses were performed to find differentially abundant gut microbiome features and their associations with CSF biomarkers of AD and related pathologies.

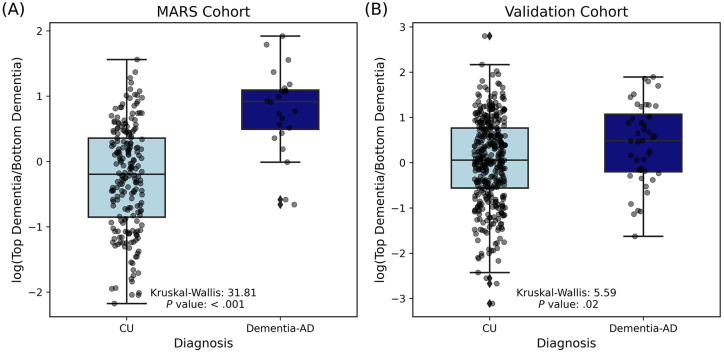
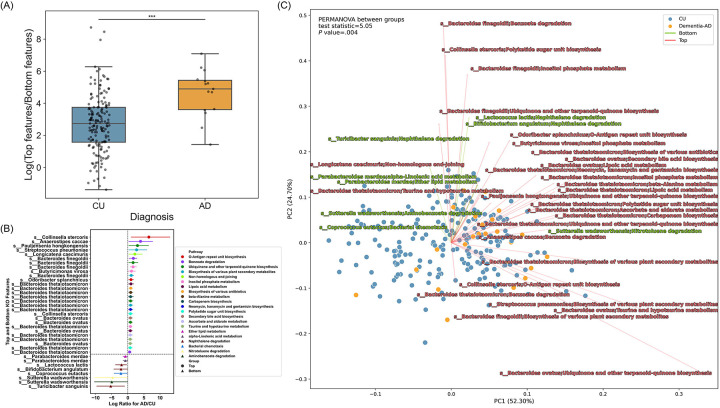
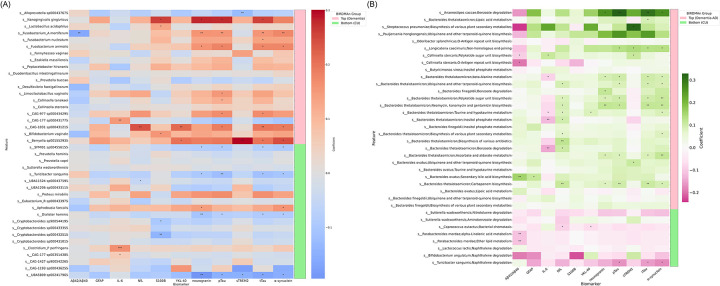
Results: Gut microbiome composition and function differed between people with AD and cognitively unimpaired individuals. The compositional difference was replicated in an independent cohort. Differentially abundant gut microbiome features were associated with CSF biomarkers of AD and related pathologies.

Discussion: These findings enhance our understanding of alterations in gut microbial composition and function in AD, and suggest that gut microbes and their pathways are linked to AD pathology.

Keywords: Alzheimer’s disease; Biomarkers; Cerebrospinal fluid; Composition; Differential abundance; Function; Gut microbiome; Pathology.


Conflict of interest statement

Dr. Kaddurah-Daouk in an inventor on a series of patents on use of metabolomics for the diagnosis and treatment of CNS diseases and holds equity in Metabolon Inc., Chymia LLC and PsyProtix. Dr. Rob Knight is a scientific advisory board member, and consultant for BiomeSense, Inc., has equity and receives income. He is a scientific advisory board member and has equity in GenCirq. He is a consultant for DayTwo, and receives income. He has equity in and acts as a consultant for Cybele. He is a co-founder of Biota, Inc., and has equity. He is a cofounder of Micronoma, and has equity and is a scientific advisory board member. The terms of these arrangements have been reviewed and approved by the University of California, San Diego in accordance with its conflict of interest policies. Dr. Zetterberg has served at scientific advisory boards and/or as a consultant for Abbvie, Acumen, Alector, Alzinova, ALZPath, Amylyx, Annexon, Apellis, Artery Therapeutics, AZTherapies, Cognito Therapeutics, CogRx, Denali, Eisai, LabCorp, Merry Life, Nervgen, Novo Nordisk, Optoceutics, Passage Bio, Pinteon Therapeutics, Prothena, Red Abbey Labs, reMYND, Roche, Samumed, Siemens Healthineers, Triplet Therapeutics, and Wave, has given lectures in symposia sponsored by Alzecure, Biogen, Cellectricon, Fujirebio, Lilly, Novo Nordisk, and Roche, and is a co-founder of Brain Biomarker Solutions in Gothenburg AB (BBS), which is a part of the GU Ventures Incubator Program (outside submitted work). Daniel McDonald is a consultant for, and has equity in, BiomeSence, Inc. The terms of this arrangement has been reviewed and approved by the University of California, San Diego in accordance with its conflict of interest polices.

Figures

Figure 1
Figure 1. Alpha and beta diversity metrics across AD groups.
(A-C) Shannon, Evenness, and Faith’s PD metrics for individuals categorized by clinical diagnosis (CU vs. Dementia-AD). (D-F) Metrics for amyloid status (Negative vs. Positive). (G-I) Metrics across APOE ε4 status (Negative vs. Positive). Each box plot is overlaid with individual data points, enhancing visualization of the data distribution within each group. Kruskal-Wallis test was used to determine statistical significance. (J-L) Differences in beta diversity metrics (Bray Curtis, Weighted UniFrac, and Unweighted UniFrac, respectively) for individuals categorized by clinical diagnosis (CU vs. Dementia-AD). (M-O) Metrics for amyloid status (Negative vs. Positive). (P-R) Metrics across APOE ε4 status (Negative vs. Positive). Principal coordinates (PC)1 and PC2 axes represent the most variance in data. Each plot is color-coded by the respective group, highlighting the spatial distribution and clustering based on the dissimilarity indices. PERMANOVA was used to determine statistical significance.
Figure 2
Figure 2. Differential abundance (DA) across AD groups.
Forest plots illustrating the DA of microbial features associated with AD groups. (A, D, G, and J) Contrasts in the abundance of various bacterial taxa at (A) phylum, (D) family, (G) genus, and (J) species levels between AD dementia and CU. (B, E, H, and K) The differences in abundance at these taxonomic levels between A+ and A− individuals. (C, F, I, and L) The microbial features differentially abundant between APOE ε4+ and APOE ε4− groups. The x-axes quantify the log ratio of presence between groups, with values above one indicating a higher abundance in the first-mentioned group. Circles denote “Top” features, indicating a positive association with AD groups (dementia diagnosis, amyloid positivity, and APOE ε4 positivity), whereas triangles denote “Bottom” features, indicating a negative association. The lines are color-coded by unique phylum as labeled in the legend. DA analysis was conducted using BIRDMAn.
Figure 3
Figure 3. Comparative analysis of top and bottom features across AD groups.
Box plots comparing the distribution of log-transformed ratios of differentially abundant microbial species in relation to diagnosis, amyloid status, and APOE ε4 status. (A-C) The log-transformed ratios of microbes for diagnosis groups (AD vs CU). (D-F) The log-transformed ratios of amyloid-related microbes (A+ vs A−). (G-I) The log-transformed ratios of APOE ε4-related microbes (APOE ε4+ vs APOE ε4−). Each column compares the CU and AD groups (A, D, and G), A+ and A− groups (B, E, and H), and APOE ε4+ and APOE ε4− groups (C, F, and I). Each panel includes a Kruskal-Wallis test statistic and associated P value, indicating the statistical significance of the differences observed.
Figure 4
Figure 4. Venn-diagram of co-occurrence of microbial features across AD groups.
The diagrams on the left column (A, C, E, and G) depict the Top (positively-associated) differentially abundant features, while those on the right column (B, D, F, and H) show the Bottom (negatively-associated) differentially abundant features. (A and B) Top and Bottom microbial phyla, respectively. These diagrams identify unique and shared phyla associated with each of the three AD groups. (C and D) Top and Bottom microbial families, respectively. These diagrams highlight the family-level microbial differences that correlate with AD diagnosis, amyloid presence, and APOE ε4 genotype presence. (E and F) Top and Bottom microbial genera, respectively. These diagrams provide insight into the genus-level microbial composition influenced by the specified AD groups. (G and H) Top and Bottom microbial species, respectively. These diagrams detail the number of species that are unique and shared across the three AD groups. Each diagram contains colored regions representing intersections between the groups: red for dementia, green for amyloid, and blue for APOE ε4. The numbers within each segment of the diagrams indicate the count of microbial features unique to or shared between the conditions. Specific microbial features are listed in Table S2.
Figure 5
Figure 5. Comparison of log-transformed dementia biomarker ratios in CU and AD dementia across two cohorts.
(A) The results from the MARS cohort. Box plots show the distribution of log-transformed ratios of top dementia biomarkers to bottom dementia biomarkers for CU individuals (light blue) and AD dementia (dark blue) (Kruskal-Wallis = 31.81, P value < .001). (B) The results from a larger validation cohort (n = 448). Box plots present the distribution of log-transformed ratios of top dementia biomarkers to bottom dementia biomarkers found in the MARS cohort for CU individuals (light blue) and people with AD dementia (dark blue) (Kruskal-Wallis = 5.59, P value = .02). Each point represents an individual sample, with the boxes indicating the interquartile range (IQR) and the whiskers extending to 1.5 times the IQR. The horizontal line within each box denotes the median value.
Figure 6
Figure 6. Differentially abundant microbial pathways between AD and CU.
(A) The distribution of the log ratios of Top/Bottom pathway features between AD (orange) and CU (blue) was shown in a box plot. Mann–Whitney U test was performed to determine statistical significance. Asterisks indicate a significant difference between AD (4.90) and CU (2.74) groups in the median of the log ratios of Top/Bottom pathway features (P value < .001). (B) A total of 36 differentially abundant features of microbial species and their corresponding pathways between AD and CU were displayed in a forest plot. Circles denote “Top” features, indicating a positive association with AD, whereas triangles denote “Bottom” features, indicating a negative association. The lines are color-coded by unique species and their corresponding pathways. DA analysis was conducted using BIRDMAn. (C) RPCA on the clinical diagnosis group and a biplot of microbiome pathway features and their corresponding species. Each point represents an individual sample color-coded by the respective group, with CU colored in blue and AD colored in orange. Vectors represent the direction (arrows) and magnitude (length) of the contribution of feature variables to the principal components (PCs). Vectors in red indicate Top features and vectors in green indicate Bottom features. PC1 and PC2 axes represent the most variance in data. Statistical analysis on RPCA was performed with PERMANOVA between AD and CU groups.
Figure 7
Figure 7. Heatmap illustrating the associations between gut microbiome compositional and functional features and CSF biomarkers in AD and related pathologies.
(A) This heatmap represents the coefficients of regression analysis between the top and bottom 20 gut microbial species linked to dementia and CSF biomarkers in two groups: Top (more abundant in AD, denoted by the pink bar) and Bottom (less abundant in AD, denoted by the green bar). The color scale indicates the strength and direction of the associations, with red representing positive associations and blue representing negative associations. The intensity of the color corresponds to the magnitude of the coefficient. Listed on the left are the gut microbiome species that were identified as more or less abundant in dementia-AD through BIRDMAn. (B) The heatmap depicts the coefficients of regression analysis between the gut microbial pathways and CSF biomarkers. Coefficients are scaled by colors indicating the strength and direction of the associations, with green representing positive associations and pink representing negative associations. The intensity of the color corresponds to the magnitude (strength) of the coefficient. Microbial species and their associated pathway features are listed on the left of the plot and two groups (Top: more abundant in AD, denoted by the light pink bar; and Bottom: less abundant in AD or more abundant in CU, denoted by the light green bar) from DA analysis using BIRDMAn are displayed on the right of the plot. The biomarkers listed along the bottom include amyloid pathology (Aβ42/Aβ40), tau pathophysiology (pTau181 and tTau), neurodegeneration (NfL), synaptic dysfunction and injury (neurogranin and α-synuclein), inflammation (IL-6), and glial activation (S100B, GFAP, YKL-40, and sTREM2). Asterisks indicate the level of statistical significance of the associations: ***P < .001, **P < .01, and *P < .05 (uncorrected).

References

    1. Sonnenburg JL, Bäckhed F. Diet–microbiota interactions as moderators of human metabolism. Nature. 2016;535(7610):56–64. doi: 10.1038/nature18846 - DOI - PMC - PubMed
    1. Desai MS, Seekatz AM, Koropatkin NM, et al. A Dietary Fiber-Deprived Gut Microbiota Degrades the Colonic Mucus Barrier and Enhances Pathogen Susceptibility. Cell. 2016;167(5):1339–1353.e21. doi: 10.1016/j.cell.2016.10.043 - DOI - PMC - PubMed
    1. Lee WJ, Hase K. Gut microbiota–generated metabolites in animal health and disease. Nat Chem Biol. 2014;10(6):416–424. doi: 10.1038/nchembio.1535 - DOI - PubMed
    1. Vogt NM, Kerby RL, Dill-McFarland KA, et al. Gut microbiome alterations in Alzheimer’s disease. Sci Rep. 2017;7:13537. doi: 10.1038/s41598-017-13601-y - DOI - PMC - PubMed
    1. Zhuang ZQ, Shen LL, Li WW, et al. Gut Microbiota is Altered in Patients with Alzheimer’s Disease. Journal of Alzheimer’s Disease. 2018;63(4):1337–1346. doi: 10.3233/JAD-180176 - DOI - PubMed

Publication types

LinkOut - more resources