[Preprint]. 2024 Sep 4:2024.09.04.24313051.
doi: 10.1101/2024.09.04.24313051.

Analysis of more than 400,000 women provides case-control evidence for BRCA1 and BRCA2 variant classification

Maria Zanti  1 Denise G O'Mahony  1   2 Michael T Parsons  3 Leila Dorling  4 Joe Dennis  4 Nicholas J Boddicker  5 Wenan Chen  5 Chunling Hu  6 Marc Naven  4 Kristia Yiangou  1 Thomas U Ahearn  7 Christine B Ambrosone  8 Irene L Andrulis  9   10 Antonis C Antoniou  4 Paul L Auer  11 Caroline Baynes  12 Clara Bodelon  13 Natalia V Bogdanova  14 Stig E Bojesen  15   16   17 Manjeet K Bolla  4 Kristen D Brantley  18 Nicola J Camp  19 Archie Campbell  20 Jose E Castelao  21 Melissa H Cessna  22 Jenny Chang-Claude  23   24 Fei Chen  25 Georgia Chenevix-Trench  26 NBCS CollaboratorsDon M Conroy  12 Kamila Czene  27 Arcangela De Nicolo  28 Susan M Domchek  29 Thilo Dörk  30 Alison M Dunning  12 A Heather Eliassen  31   32 D Gareth Evans  33   34 Peter A Fasching  35 Jonine D Figueroa  7   36   37 Henrik Flyger  38 Manuela Gago-Dominguez  39 Montserrat García-Closas  7 Gord Glendon  9 Anna González-Neira  40 Felix Grassmann  41 Andreas Hadjisavvas  42 Christopher A Haiman  25 Ute Hamann  43 Steven N Hart  6 Mikael B A Hartman  44   45   46 Weang-Kee Ho  47   48 James M Hodge  13 Reiner Hoppe  49   50 Sacha J Howell  51 kConFab InvestigatorsAnna Jakubowska  52   53 Elza K Khusnutdinova  54 Yon-Dschun Ko  55 Peter Kraft  56 Vessela N Kristensen  57   58 James V Lacey  59   60 Jingmei Li  61 Geok Hoon Lim  62   63 Sara Lindström  64   65 Artitaya Lophatananon  66 Craig Luccarini  12 Arto Mannermaa  67   68   69 Maria Elena Martinez  70   71 Dimitrios Mavroudis  72 Roger L Milne  73   74   75 Kenneth Muir  66 Katherine L Nathanson  29 Rocio Nuñez-Torres  40 Nadia Obi  76   77 Janet E Olson  78 Julie R Palmer  79   80 Mihalis I Panayiotidis  42 Alpa V Patel  13 Paul D P Pharoah  81 Eric C Polley  82 Muhammad U Rashid  43   83 Kathryn J Ruddy  84 Emmanouil Saloustros  85 Elinor J Sawyer  86 Marjanka K Schmidt  87   88   89 Melissa C Southey  73   75   90 Veronique Kiak-Mien Tan  63   91   92   93 Soo Hwang Teo  94   95 Lauren R Teras  13 Diana Torres  43   96 Amy Trentham-Dietz  97 Thérèse Truong  98 Celine M Vachon  78 Qin Wang  4 Jeffrey N Weitzel  99 Siddhartha Yadav  84 Song Yao  8 Gary R Zirpoli  79 Melissa S Cline  100 Peter Devilee  101   102 Sean V Tavtigian  103   104 David E Goldgar  105 Fergus J Couch  6 Douglas F Easton  4   12 Amanda B Spurdle  3 Kyriaki Michailidou  1
Affiliations

Analysis of more than 400,000 women provides case-control evidence for BRCA1 and BRCA2 variant classification

Maria Zanti et al. medRxiv. .

Update in

  • Analysis of more than 400,000 women provides case-control evidence for BRCA1 and BRCA2 variant classification.
    Zanti M, O'Mahony DG, Parsons MT, Dorling L, Dennis J, Boddicker NJ, Chen W, Hu C, Naven M, Yiangou K, Ahearn TU, Ambrosone CB, Andrulis IL, Antoniou AC, Auer PL, Baynes C, Bodelon C, Bogdanova NV, Bojesen SE, Bolla MK, Brantley KD, Camp NJ, Campbell A, Castelao JE, Cessna MH, Chang-Claude J, Chen F, Chenevix-Trench G; NBCS Collaborators; Conroy DM, Czene K, De Nicolo A, Domchek SM, Dörk T, Dunning AM, Eliassen AH, Evans DG, Fasching PA, Figueroa JD, Flyger H, Gago-Dominguez M, García-Closas M, Glendon G, González-Neira A, Grassmann F, Hadjisavvas A, Haiman CA, Hamann U, Hart SN, Hartman MBA, Ho WK, Hodge JM, Hoppe R, Howell SJ; kConFab Investigators; Jakubowska A, Khusnutdinova EK, Ko YD, Kraft P, Kristensen VN, Lacey JV, Li J, Lim GH, Lindström S, Lophatananon A, Luccarini C, Mannermaa A, Martinez ME, Mavroudis D, Milne RL, Muir K, Nathanson KL, Nuñez-Torres R, Obi N, Olson JE, Palmer JR, Panayiotidis MI, Patel AV, Pharoah PDP, Polley EC, Rashid MU, Ruddy KJ, Saloustros E, Sawyer EJ, Schmidt MK, Southey MC, Tan VK, Teo SH, Teras LR, Torres D, Trentham-Dietz A, Truong T, Vachon CM, Wang Q, Weitzel JN, Yadav S, Yao S, Zirpoli GR, Cline MS, Devilee P, Tavtigian SV, Goldgar DE, Couc… See abstract for full author list ➔ Zanti M, et al. Nat Commun. 2025 May 25;16(1):4852. doi: 10.1038/s41467-025-59979-6. Nat Commun. 2025. PMID: 40413188 Free PMC article.

Abstract

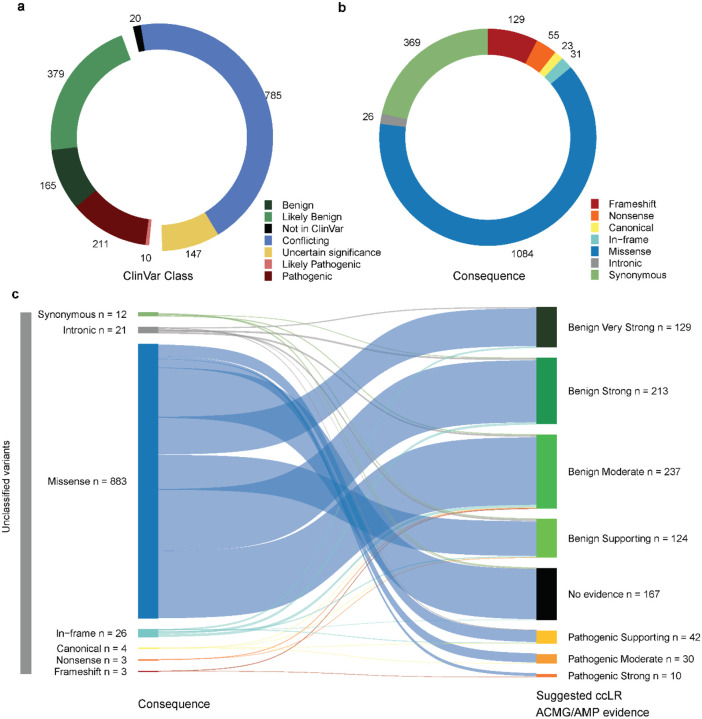
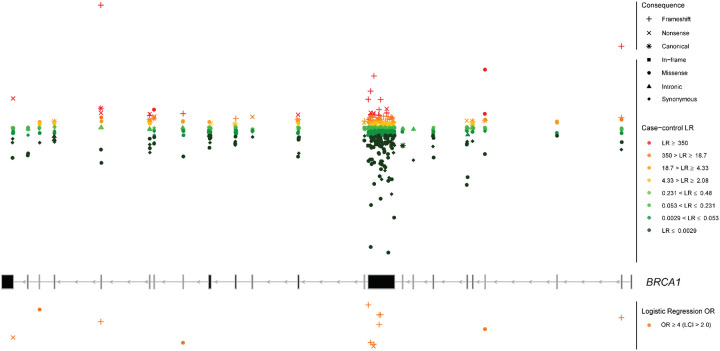
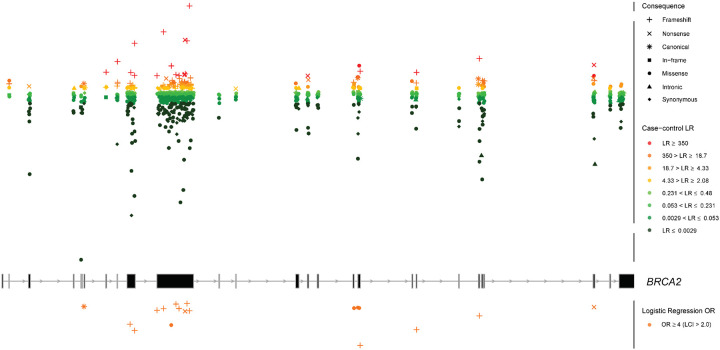
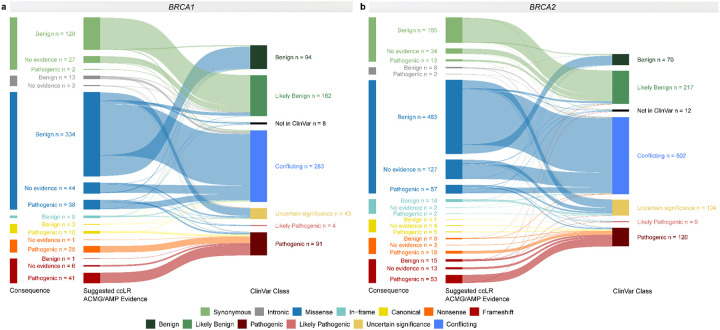
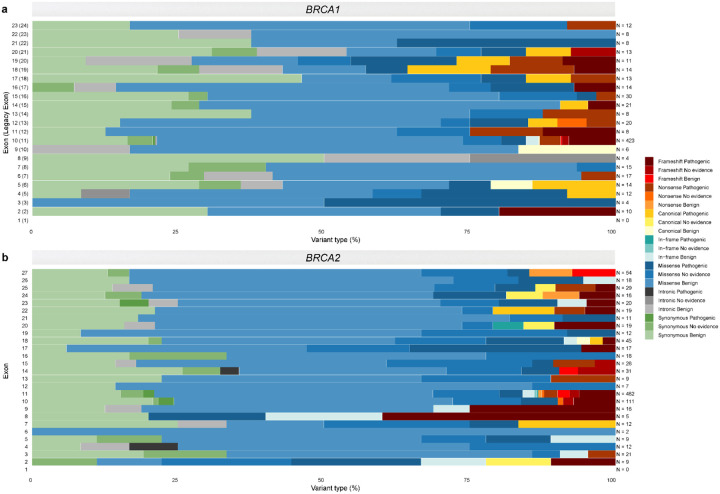
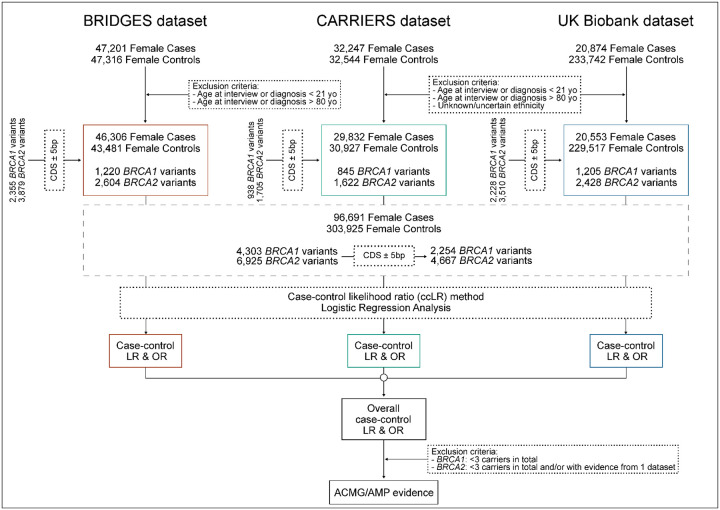
Clinical genetic testing identifies variants causal for hereditary cancer, information that is used for risk assessment and clinical management. Unfortunately, some variants identified are of uncertain clinical significance (VUS), complicating patient management. Case-control data is one evidence type used to classify VUS, and previous findings indicate that case-control likelihood ratios (LRs) outperform odds ratios for variant classification. As an initiative of the Evidence-based Network for the Interpretation of Germline Mutant Alleles (ENIGMA) Analytical Working Group we analyzed germline sequencing data of BRCA1 and BRCA2 from 96,691 female breast cancer cases and 303,925 unaffected controls from three studies: the BRIDGES study of the Breast Cancer Association Consortium, the Cancer Risk Estimates Related to Susceptibility consortium, and the UK Biobank. We observed 11,227 BRCA1 and BRCA2 variants, with 6,921 being coding, covering 23.4% of BRCA1 and BRCA2 VUS in ClinVar and 19.2% of ClinVar curated (likely) benign or pathogenic variants. Case-control LR evidence was highly consistent with ClinVar assertions for (likely) benign or pathogenic variants; exhibiting 99.1% sensitivity and 95.4% specificity for BRCA1 and 92.2% sensitivity and 86.6% specificity for BRCA2. This approach provides case-control evidence for 785 unclassified variants, that can serve as a valuable element for clinical classification.

Keywords: BRCA1; BRCA2; VUS; case-control; likelihood ratio; odds ratio; rare variant.


Figures

Fig. 1:
Fig. 1:. Overview of variants with provided case-control likelihood ratio evidence.
Donut plots showing the distribution of the a clinical classification (“ClinVar Class”) and b sequence ontology variant consequence (“Consequence”) for the 1,717 CDS±5bp variants with filtering allele frequency (FAF) > 0.001 (variants not meeting the BRCA1 and BRCA2 VCEP “BA1” benign stand-alone criterion), present in at least three individuals in the combined dataset, and with evidence from at least two datasets for BRCA2. c Sankey plot depicting “suggested case-control likelihood ratio (ccLR) ACMG/AMP evidence” provided for unclassified variants (not reported in ClinVar or listed in ClinVar as VUS, variants of conflicting interpretation of pathogenicity or variants with classification “not provided”), per sequence ontology variant consequence (“Consequence”). The clinical classification status (“ClinVar Class”) of variants was retrieved from the ClinVar database (last accessed on January 7, 2024).
Fig. 2:
Fig. 2:. Genomic mapping of the case-control analysis for BRCA1.
Overlay of the case-control likelihood ratios (LRs) and the logistic regression odds ratio (OR) estimates is represented within each exon (middle panel). Exons are sequentially numbered from 1 to 23 and annotated from right to left to match the MANE Select transcripts. Although BRCA1 was initially described with 24 exons (GenBank Assession ID U14680.1), exon 4 is missing following further assessment of the gene. We implement the most updated version of exon numbering (excluding legacy exon numbering). Case-control LRs (top panel) are represented on a continuous log2-transformed y axis with axis breaks. For the case-control LR analysis, red color gradient represents LR reaching suggested ACMG/AMP evidence in favor of pathogenicity with strength levels ranging from very strong (dark red), to supporting (yellow). Green color gradient represents LR reaching ACMG/AMP evidence against pathogenicity with strength levels ranging from very strong (dark green) to supporting (light green). Variants with LR of “No evidence” are not plotted. For the logistic regression analysis, orange color represents OR estimates reaching the strong PS4 criterion (OR ≥ 4.0, P value < 0.05 and confidence interval (CI) not including 2.0). Variants with OR estimates not reaching the PS4 criterion are not plotted. For visualization purposes, the y axis for logistic regression is represented in reversed order. LCI, lower confidence interval. Sequence ontology variant consequence (“Consequence”) is represented with different symbols.
Fig. 3:
Fig. 3:. Genomic mapping of the case-control analysis for BRCA2.
Overlay of the case-control likelihood ratios (LRs) and the logistic regression odds ratio (OR) estimates is represented within each exon (middle panel). Exons are sequentially numbered from 1 to 27 and annotated from left to right to match the MANE Select transcripts. Case-control LRs (top panel) are represented on a continuous log2-transformed y axis with axis breaks. For the case-control LR analysis, red color gradient represents LR reaching suggested ACMG/AMP evidence in favor of pathogenicity with strength levels ranging from very strong (dark red), to supporting (yellow). Green color gradient represents LR reaching ACMG/AMP evidence against pathogenicity with strength levels ranging from very strong (dark green) to supporting (light green). Variants with LR of “No evidence” are not plotted. For the logistic regression analysis, orange color represents OR estimates reaching the strong PS4 criterion (OR ≥ 4.0, P value < 0.05 and confidence interval (CI) not including 2.0. Variants with OR estimates not reaching the PS4 criterion are not plotted. For visualization purposes, the y axis for logistic regression is represented in reversed order. LCI, lower confidence interval. Sequence ontology variant consequence (“Consequence”) is represented with different symbols.
Fig. 4:
Fig. 4:. Case-control likelihood ratio evidence per sequence ontology variant consequence compared to ClinVar clinical classification.
Sankey plots for a BRCA1 and b BRCA2. The variants assigned case-control likelihood ratio (LR) evidence in favor of or against pathogenicity (with suggested supporting, moderate, strong or very strong evidence strength) are simplistically annotated as “Pathogenic”, and “Benign” “Suggested case-control LR (ccLR) ACMG/AMP Evidence”, respectively. Variants with LRs between 0.48 and 2.08 are defined as “No evidence” in the “Suggested ccLR ACMG/AMP Evidence” panel. The clinical classification status (“ClinVar Class”) of variants was retrieved from the ClinVar database (last accessed on January 7, 2024).
Fig. 5:
Fig. 5:. Distribution of the case-control likelihood ratios for BRCA1 and BRCA2.
Histograms showing the distribution of case-control likelihood ratios (LRs) categorized by a sequence ontology variant consequence for BRCA1, b ClinVar classification for BRCA1, c sequence ontology variant consequence for BRCA2, d ClinVar classification for BRCA2. For visualization purposes the x axis represents log10(LR) values. Dashed lines represent LRs between 0.48 and 2.08 considered as of “No evidence”.
Fig. 6:
Fig. 6:. Overview of the case-control likelihood ratio evidence assigned per exon and sequence ontology variant consequence for BRCA1 and BRCA2.
Stacked bar plots of the suggested case-control likelihood ratio (LR) ACMG/AMP evidence per exon and sequence ontology variant consequence for a BRCA1 and b BRCA2. Exons are sequentially numbered to match the MANE Select transcripts. Although BRCA1 was initially described with 24 exons (GenBank Assession ID U14680.1), exon 4 is missing following further assessment of the gene; legacy exon numbering for BRCA1 is represented in brackets. Variants assigned case-control LR evidence in favor of or against pathogenicity (with suggested supporting, moderate, strong or very strong evidence strength) are simplistically annotated as “Pathogenic”, and “Benign” in the key, respectively. Variants with LRs between 0.48 and 2.08 are defined as “No evidence”.
Fig. 7:
Fig. 7:. Concordance between the case-control likelihood ratio method and functional predictors.
Concordance is shown separately for a BRCA1 and b BRCA2. The top panels for each gene represent case-control likelihood ratios (LRs) compared to variants predicted as benign (“BP4 criterion”, “predicted benign” or “functional”) or pathogenic (“PP3 criterion”, “predicted pathogenic” or “loss-of-function”) by in silico prediction methods (AlphaMissense, BayesDel, MutPred2, VEST4 and REVEL) or through high-throughput functional assays (Findlay et al., 2018, Hu et al., 2024, Mesman et al., 2019). Yellow and green colors represent variants predicted as pathogenic or benign by functional predictors, respectively. Bottom panels for each gene represent sequencepathogenicity heatmaps demonstrating the concordance between the case-control LR (ccLR) method and functional predictors. For the case-control LR evidence, red color gradient represents LR reaching suggested ACMG/AMP evidence in favor of pathogenicity with strength levels ranging from very strong (dark red), to supporting (yellow). Green color gradient represents LR reaching suggested ACMG/AMP evidence against pathogenicity with strength levels ranging from very strong (dark green) to supporting (light green). Variants with ccLR of “No evidence” are not plotted. For the functional predictors, yellow and green colors represent evidence in favor and against pathogenicity, respectively (expressed as pathogenic supporting).
Fig. 8:
Fig. 8:. Flowchart summarizing the study design.
Using sequencing data of 96,691 female breast cancer cases and 304,649 unaffected controls from the Breast Cancer Association Consortium (BCAC), the Cancer Risk Estimates Related to Susceptibility (CARRIERS) consortium and the UK Biobank (UKB) we calculated case-control likelihood ratios (LRs) and odds ratios (ORs) for 11,264 BRCA1 and BRCA2 variants, of which 6,943 are coding (coding sequence, CDS±5bp). Derived LRs and ORs were further aligned to ACMG/AMP evidence strengths to provide evidence in favor or against pathogenicity following sensitivity analyses-derived variant exclusion criteria

References

    1. Federici G. & Soddu S. Variants of uncertain significance in the era of high-throughput genome sequencing: a lesson from breast and ovary cancers. J Exp Clin Cancer Res 39, 46 (2020). - PMC - PubMed
    1. Parsons M. T. et al. Evidence-based recommendations for gene-specific ACMG/AMP variant classification from the ClinGen ENIGMA BRCA1 and BRCA2 Variant Curation Expert Panel. Am J Hum Genet (2024). - PMC - PubMed
    1. Richards S. et al. Standards and guidelines for the interpretation of sequence variants: a joint consensus recommendation of the American College of Medical Genetics and Genomics and the Association for Molecular Pathology. Genet Med 17, 405–424 (2015). - PMC - PubMed
    1. Tavtigian S. V. et al. Modeling the ACMG/AMP variant classification guidelines as a Bayesian classification framework. Genet Med 20, 1054–1060 (2018). - PMC - PubMed
    1. Tavtigian S. V., Harrison S. M., Boucher K. M. & Biesecker L. G. Fitting a naturally scaled point system to the ACMG/AMP variant classification guidelines. Hum Mutat 41, 1734–1737 (2020). - PMC - PubMed

Publication types