. 2024 Aug 13;32(3):101319.
doi: 10.1016/j.omtm.2024.101319. eCollection 2024 Sep 12.

Auto-expansion of in vivo HDAd-transduced hematopoietic stem cells by constitutive expression of tHMGA2

Affiliations

Auto-expansion of in vivo HDAd-transduced hematopoietic stem cells by constitutive expression of tHMGA2

Hongjie Wang et al. Mol Ther Methods Clin Dev. .

Abstract

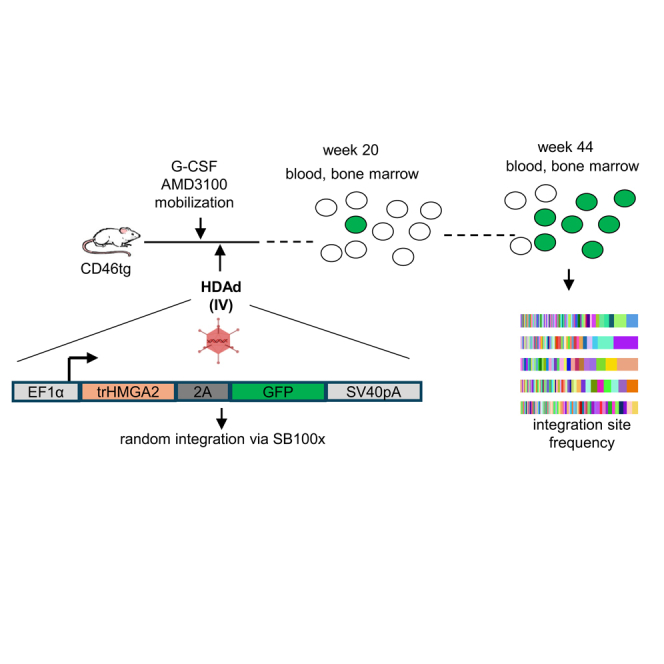
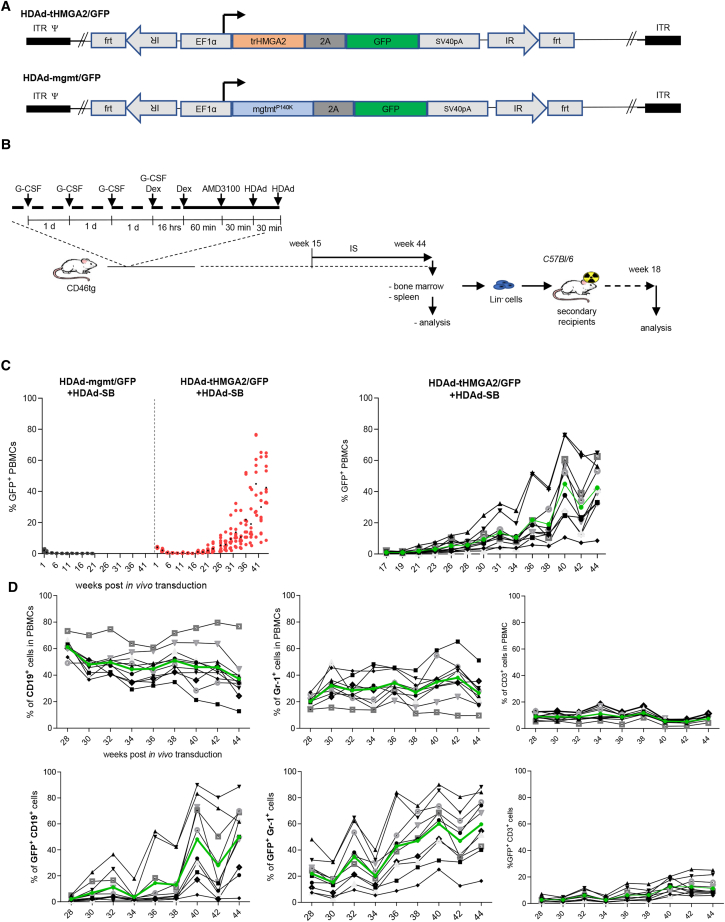
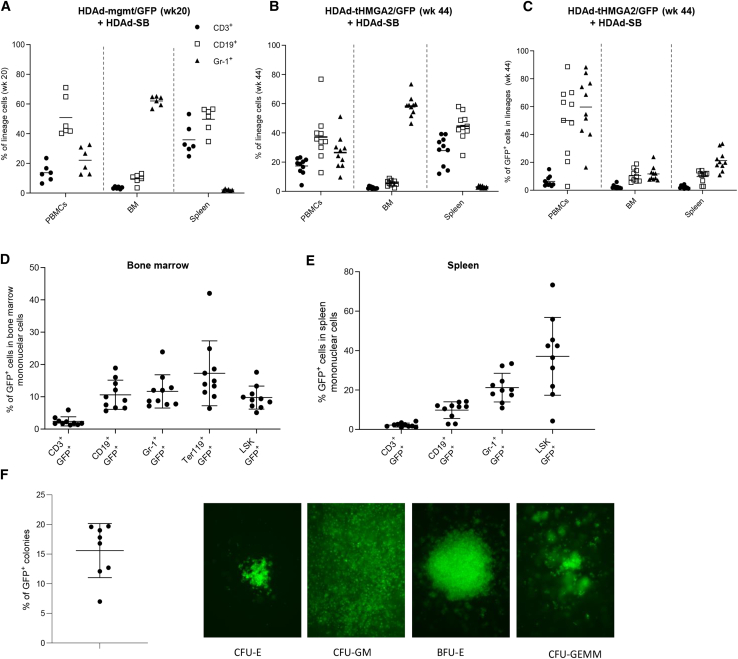
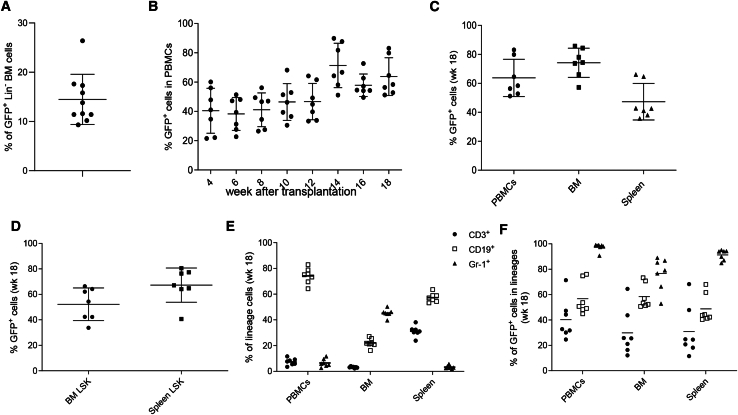
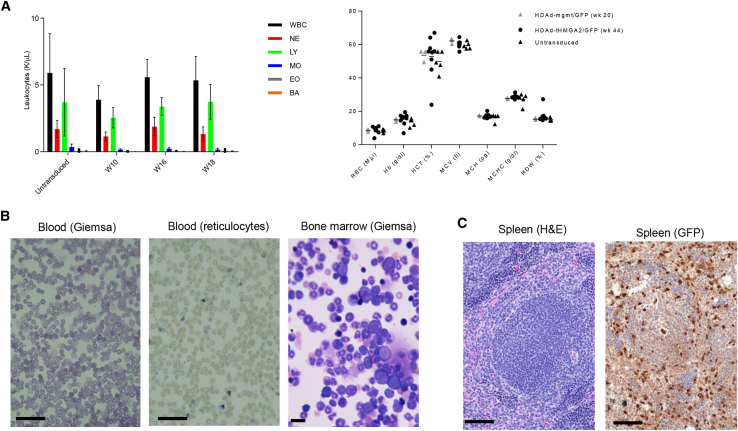
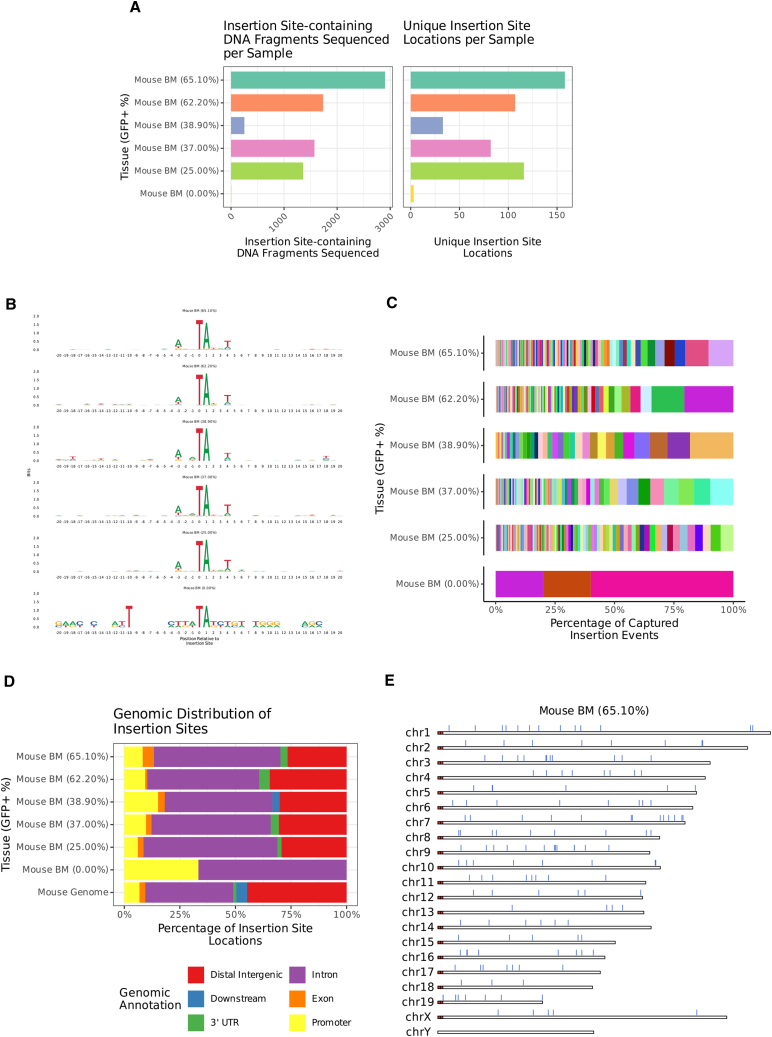
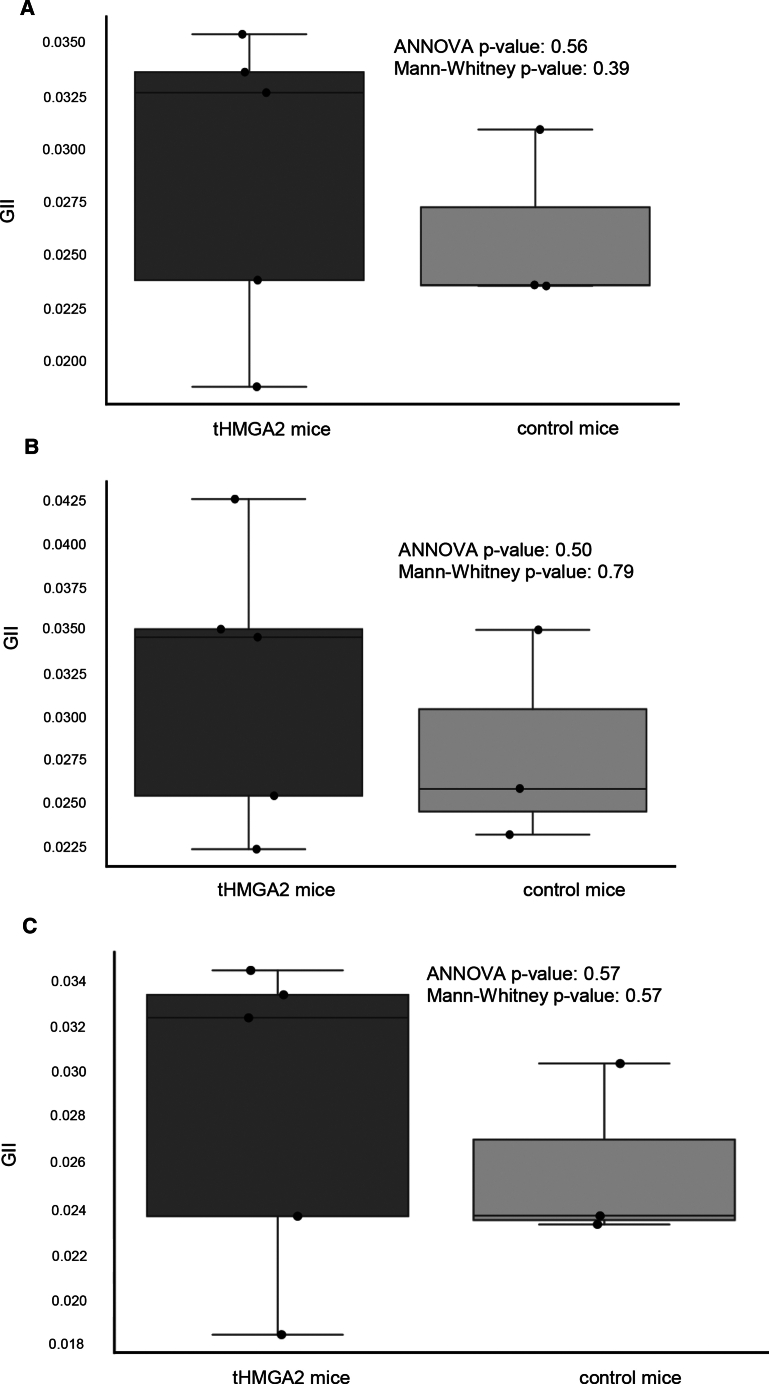
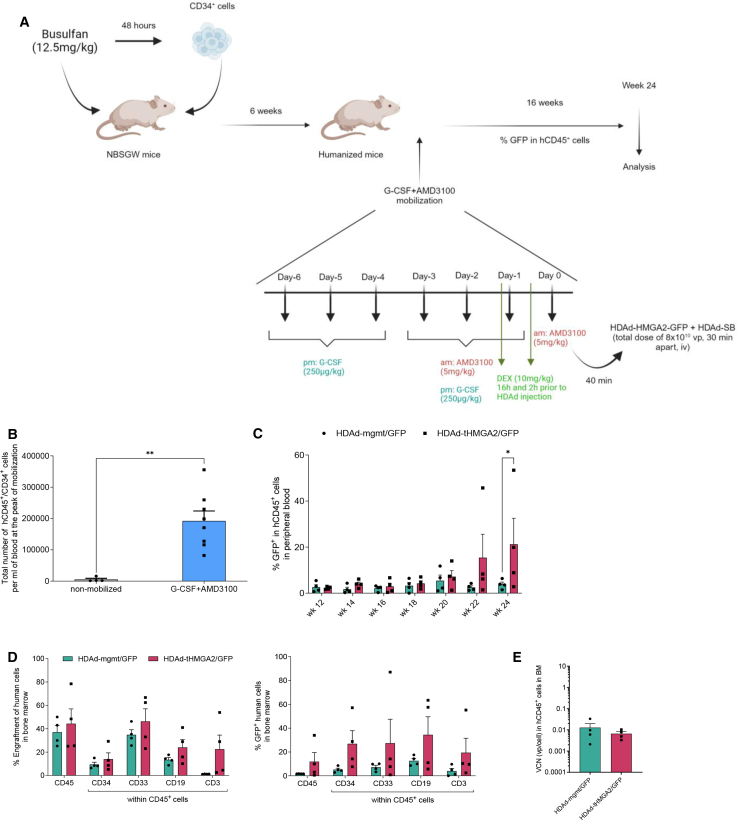
We developed an in vivo hematopoietic stem cell (HSC) gene therapy approach that does not require cell transplantation. To achieve therapeutically relevant numbers of corrected cells, we constructed HSC-tropic HDAd5/35++ vectors expressing a 3' UTR truncated HMGA2 gene and a GFP reporter gene. A SB100x transposase vector mediated random integration of the tHMGA2/GFP transgene cassette. HSCs in mice were mobilized by subcutaneous injections of G-CSF and AMD3100/Plerixafor and intravenously injected with the integrating tHMGA2/GFP vector. This resulted in a slow but progressive, competitive expansion of GFP+ PBMCs, reaching about 50% by week 44 with further expansion in secondary recipients. Expansion occurred at the level of HSCs as well as at the levels of myeloid, lymphoid, and erythroid progenitors within the bone marrow and spleen. Importantly, based on genome-wide integration site analyses, expansion was polyclonal, without any signs of clonal dominance. Whole-exome sequencing did not show significant differences in the genomic instability indices between tHGMGA2/GFP mice and untreated control mice. Auto-expansion by tHMGA2 was validated in humanized mice. This is the first demonstration that simple injections of mobilization drugs and HDAd vectors can trigger auto-expansion of in vivo transduced HSCs resulting in transgene-marking rates that, theoretically, are curative for hemoglobinopathies.

Keywords: HMGA2; Sleeping Beauty transposase; gene therapy; helper-dependent adenovirus vector; hematopoietic stem cells; insertion site analysis; in vivo.


Conflict of interest statement

A.L. and P.N.V. receive research funding from Ensoma, Inc. R.E., K.W.M., and R.P. are employees of Ensoma, Inc.

Figures

None
Graphical abstract
Figure 1
Figure 1
In vivo HSC transduction—analysis of peripheral blood cells (A) HDAd vector structures. Transgene transcription was under the control of the ubiquitously active EF1a promoter. The MGMTp140k gene was replaced by 3′ UTR truncated tHMGA2 gene. (B) Schematic of the experiment. In vivo transduction of mobilized hCD46tg mice. HSCs were mobilized by s.c. injections of human recombinant G-CSF for 4 days followed by one s.c. injection of AMD3100. Thirty and 60 min after AMD3100 injection, animals were injected i.v. with HDAd-tHMGA2/GFP + HDAd-SB (1:1 mixture) or HDAd-mgmt/GFP + HDAd-SB (1:1) (two injections, each 4 × 1010 viral particles). Mice were treated with immunosuppressive drugs to avoid immune responses against the human tHMGA2 protein. Mice were followed until week 44, when animals were sacrificed for analysis. BM lineage-negative (Lin cells) were transplanted into lethally irradiated C57Bl/6 mice, which were then followed for 18 weeks. (C) Percentage of GFP+ PBMCs in primary (in vivo transduced) mice. Each symbol is an individual animal. Control group (HDAd-mgmt/GFP + HDAd-SM) was followed up to week 20. The HDAd-tHMGA2/GFP + HDAd-SB) group was followed up to week 44. The black bars in this group are the average percentages of GFP+ PBMCs in the 10 mice for each time point. The right panel shows the percentage of GFP+ PBMCs starting from week 17. The curve in green represents the average. (D) Percentage of lineage-positive cells within PBMCs and percentage of GFP+ cells within lineage-positive PBMCs analyzed from weeks 28 to 44 post in vivo transduction with HDAd-tHMGA2/GFP + HDAd-SB. The curves in green represent the average percentage. Each symbol represents an individual mouse.
Figure 2
Figure 2
In vivo HSC transduction—analysis of bone marrow and spleen cells (A) Percentage of lineage-positive cells within PBMCs, bone marrow, and spleen of the mice after in vivo transduction with HDAd-mgmt/GFP + HDAd-SB (sacrificed at week 20). (B) Percentage of lineage-positive cells within PBMCs, bone marrow, and spleen of the mice that were in vivo transduced with HDAd-tHMGA2/GFP + HDAd-SB (sacrificed at week 44). (C) Percentage of GFP+ cells within lineage-positive cells in PBMCs, bone marrow, and spleen of the mice that were in vivo transduced with HDAd-tHMGA2/GFP + HDAd-SB (sacrificed at week 44). (D and E) Percentage of GFP+ within lineage-positive cells and LSK cells (the HSC-containing LinSca-1+c-Kit+ fraction) in bone marrow and spleen of the mice that were in vivo transduced with HDAd-tHMGA2/GFP + HDAd-SB (week 44). Each symbol is an individual animal. Mean and error bars (±SEM) are shown. (F) Progenitor colony assay. A total of 1,250 plated Lin cells routinely formed ∼250 individual colonies. Left panel: percentage of GFP+ progenitor colonies that formed after plating bone marrow Lin cells from individual week 44 mice. Right panel: representative GFP+ colonies. CFU-E, colony-forming unit-erythroid; BFU-E, burst-forming unit-erythroid; CFU-GM, colony-forming unit-granulocytes, macrophage; CFU-GEMM, colony-forming unit -granulocyte, erythroid, macrophage, megakaryocyte.
Figure 3
Figure 3
Analysis of secondary recipients transplanted with Lin cells from HDAd-tHMGA2+HDAdSB-transduced mice (A) GFP marking rate in Lin bone marrow cells used for transplantation into secondary recipients. Each symbol represents an individual mouse. Mean and error bars (±SEM) are shown. (A) Percentage of GFP+ PBMCs. (B) Percentage of GFP+ cells in PBMCs in secondary recipients at different time points. (C) Percentage of GFP+ cells in total mononuclear cells of PBMC, bone marrow, and spleen at week 18 after transplantation. (D) Percentage of GFP+ cells within bone marrow LSK cells and spleen LSK cells. (E) Percentage of lineage-positive cells in PBMC, bone marrow, and spleen cells at week 18. (F) Percentage of GFP+, lineage-positive cells in PBMC, bone marrow, and spleen cells at week 18 after transplantation.
Figure 4
Figure 4
Hematological and histological assessment of neoplastic events in blood, bone marrow, and spleen of secondary recipients (A) White blood cells of secondary mice at week 10, 16, and 18 after transplantation (left panel). Erythropoietic parameters of primary mice at sacrifice (right panel). RBC, red blood cells; Hb, hemoglobin; MCV, mean corpuscular volume; MCH, mean corpuscular hemoglobin; MCHC, mean corpuscular hemoglobin concentration; RDW, red cell distribution width. (B) Left panel: blood smears stained with Giemsa/May-Grünwald stain. Middle panel: blood smears stained with Brilliant cresyl blue for reticulocytes. Remnants of nuclei and cytoplasm in reticulocytes appear as purple staining. Right panel: bone marrow cytospins stained with Giemsa/May-Grünwald stain. (C) H&E staining of spleen sections. Scale bars, 20 μm.
Figure 5
Figure 5
Genome-wide insertion site analysis by TRACE sequencing (A) The number of unique DNA fragments sequenced with Sleeping Beauty IR-genome junctions, and the number of unique genomic coordinates where an insertion site was detected. Data from bone marrow MNCs of individual mice are shown. The percentage of GFP+ bone marrow MNCs for each mouse is shown on the left side of the graphs. (B) Sequence logos ±20 bp from the insertion site, with zero being the first base downstream of the inserted transposon. (C) The percentage of unique insertion sites-containing DNA fragments mapping to a specific genomic coordinate. (D) Percentage of insertion locations contained within each gene region (relative to transcripts) including promoters (−2 to +0.2 kbp from transcript TSSs), exons, introns, 3′ UTRs, downstream (+3 kbp from 3′-most gene end), and distal intergenic (not contained within any of the previously mentioned features). Distribution of features over the entire mouse genome is included for comparison. (E) A representative plot of mouse chromosomes with tick marks denoting the location of insertion sites.
Figure 6
Figure 6
GII of mouse DNA GII corresponds to the number of private variants compared with the total number of variants. Levels of GII were comparable between groups for (A) all variants (p = 0.392 by Mann-Whitney U test and p = 0.563 by ANOVA), (B) insertions and deletions (INDELs; p = 0.786 and p = 0.497), and (C) SNPs (p = 0.571 and p = 0.575).
Figure 7
Figure 7
In vivo transduction of human CD34+ cell by HDAd-tHMGA2/GFP in humanized mice (A) Experimental procedure of in vivo transduction experiments. In brief, CD34+ cells from healthy donors were transplanted in busulfan-treated NBSGW mice (N = 8). Six weeks post transplantation, CD34+ cells were mobilized to the peripheral blood by G-CSF and AMD3100. At the peak of mobilization, the mice were injected i.v. with HDAd-mgmt/GFP + HDAd-SB (N = 4) or HDAd-tHMGA2/GFP + HDAd-SB (N = 4) adenoviral vectors, and were followed up for the next 4 months, at which time point the mice were euthanized, and their hematopoietic tissues were collected for further analysis. (B) Efficiency of G-CSF+AMD3100 mobilization in NBSGW mice xenotransplanted with human CD34+ cells from healthy donors (N = 8), in terms of total hCD45+/hCD34+ cell number per mL of blood. (C) Percentage of GFP expression in human CD45+ in the peripheral blood of HDAd-mgmt/GFP (or HDAd-tHMGA2/GFP in vivo transduced mice. (D) Left: multilineage reconstitution 4 months after in vivo transduction measured by flow cytometry with antibodies against human cell surface markers. Right: GFP expression of different human cell subpopulations from the chimeric bone marrow. (E) Vector copy number (VCN) analysis in isolated hCD45+ cells from BM. Each symbol represents an individual mouse. Data are shown as means ± SEM. ∗∗p ≤ 0.01, ∗p ≤ 0.05 (two-way ANOVA with Bonferroni correction for multiple comparisons, Student’s t test for two groups comparisons).

Similar articles

References

    1. Wang H., Liu Y., Li Z., Tuve S., Stone D., Kalyushniy O., Shayakhmetov D., Verlinde C.L.M., Stehle T., McVey J., et al. In vitro and in vivo properties of adenovirus vectors with increased affinity to CD46. J. Virol. 2008;82:10567–10579. doi: 10.1128/JVI.01308-08. - DOI - PMC - PubMed
    1. Yao J., Atasheva S., Wagner N., Di Paolo N.C., Stewart P.L., Shayakhmetov D.M. Targeted, safe, and efficient gene delivery to human hematopoietic stem and progenitor cells in vivo using the engineered AVID adenovirus vector platform. Mol. Ther. 2024;32:103–123. doi: 10.1016/j.ymthe.2023.10.023. - DOI - PMC - PubMed
    1. Ni S., Gaggar A., Di Paolo N., Li Z.Y., Liu Y., Strauss R., Sova P., Morihara J., Feng Q., Kiviat N., et al. Evaluation of adenovirus vectors containing serotype 35 fibers for tumor targeting. Cancer Gene Ther. 2006;13:1072–1081. - PubMed
    1. Richter M., Saydaminova K., Yumul R., Krishnan R., Liu J., Nagy E.E., Singh M., Izsvák Z., Cattaneo R., Uckert W., et al. In vivo transduction of primitive mobilized hematopoietic stem cells after intravenous injection of integrating adenovirus vectors. Blood. 2016;128:2206–2217. doi: 10.1182/blood-2016-04-711580. - DOI - PMC - PubMed
    1. Li C., Mishra A.S., Gil S., Wang M., Georgakopoulou A., Papayannopoulou T., Hawkins R.D., Lieber A. Targeted Integration and High-Level Transgene Expression in AAVS1 Transgenic Mice after In Vivo HSC Transduction with HDAd5/35++ Vectors. Mol. Ther. 2019;27:2195–2212. doi: 10.1016/j.ymthe.2019.08.006. - DOI - PMC - PubMed