Comparative Study
. 2024 Sep 10:12:e17744.
doi: 10.7717/peerj.17744. eCollection 2024.

Advancements in monitoring: a comparison of traditional and application-based tools for measuring outdoor recreation

Affiliations
Comparative Study

Advancements in monitoring: a comparison of traditional and application-based tools for measuring outdoor recreation

Talia Vilalta Capdevila et al. PeerJ. .

Abstract

Outdoor recreation has experienced a boom in recent years and continues to grow. While outdoor recreation provides wide-ranging benefits to human well-being, there are growing concerns about the sustainability of recreation with the increased pressures placed on ecological systems and visitor experiences. These concerns emphasize the need for managers to access accurate and timely recreation data at scales that match the growing extent of the recreation footprint. Here, we compare spatial and temporal patterns of winter and summer recreation using traditional (trail cameras, infrared counters, aerial surveys, participatory mapping) and application-based tools (Strava Metro, Strava Global Heatmap, Wikiloc) across the Columbia and Canadian Rocky Mountains of western Canada. We demonstrate how recreation use can be estimated using traditional and application-based tools, although their accuracy and utility varies across space, season and activity type. We found that trail cameras and infrared counters captured similar broad-scale patterns in count estimates of pedestrians and all recreation activities. Aerial surveys captured areas with low recreation intensity and participatory mapping captured coarser information on the intensity and extent of recreation across large spatial and temporal scales. Application-based data provided detailed spatiotemporal information on recreation use, but datasets were biased towards specific activities. Strava Metro data was more suited for capturing broad-scale spatial patterns in biking than pedestrian recreation. Application-based data should be supplemented with data from traditional tools to identify biases in data and fill in data gaps. We provide a comparison of each tool for measuring recreation use, highlight each tools' strengths and limitations and applications to address real-world monitoring and management scenarios. Our research contributes towards a better understanding of which tool, or combinations of tools, to use that can expand the rigor and scope of recreation research. These findings support decision-making to mitigate pressures on wildlife and their habitats while allowing for high-quality recreation experiences.

Keywords: Aerial surveys; App-based data; Camera traps; Participatory mapping; Recreation monitoring; Trail counters; User-generated data; Volunteered geographic information; Wildlife and recreation management.


Conflict of interest statement

The authors declare there are no competing interests.

Figures

Figure 1
Figure 1. Study area (A) and case study areas (B, C, D).
Case studies include the (B) Ghost Public Land Use Zone (PLUZ) that has a high density of motorized trails in a non-protected area, (C) the Kootenay mountains that has winter motorized recreation, and (D) biking trails surrounding the town of Canmore in the Bow Valley. Base map sources: Esri, TomTom, Garmin, FAO, NOAA, USGS, ©OpenStreetMap contributors, and the GIS User Community.
Figure 2
Figure 2. Spatial distribution of data from (A) counters, cameras, Strava Metro and (B) public participatory mapping, aerial surveys, and Wikiloc within the study area (gray boundary).
Strava Heatmap not displayed (see Data Description S1). Base map sources: ©OpenStreetMap and contributors, CC-BY-SA.
Figure 3
Figure 3. Distribution of Pearson’s correlation values of monthly counts of (A) all recreation activities, (B) pedestrian, and (C) biking for pairwise combinations of spatially matched cameras, counters and Strava Metro, 2017–2019.
Each row represents different data comparisons and the dashed red line represents the mean Pearson’s correlation value.
Figure 4
Figure 4. Pearson’s correlation values of monthly counts for (A, D, G) all recreation activities, (B, E, H) pedestrian and (C, F, I) biking for pairwise combinations of spatially matched cameras, counters and Strava Metro, 2017–2019.
Each row represents different data comparisons and the red line represents a non-linear trendline (generalized additive model).
Figure 5
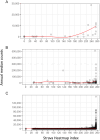
Figure 5. Strava Heatmap index of recreation intensity compared to annual median recreation counts from (A) cameras, (B) counters, and (C) Strava Metro.
Data for cameras, counters and Strava Metro are from 2017 to 2019 for all spatially matched locations in the study area, data from Strava Heatmap is from 2016 to 2017. Trendline represented in red.
Figure 6
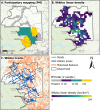
Figure 6. Summer motorized recreation in the Ghost Public Land Use Zone (PLUZ), Alberta, from May to September, 2017–2019.
(A) Represents estimates of the average number of people recreating between 2017 to 2019 from participatory mapping (PM); gray shading represents areas where PM participants indicated that motorized recreation was present, but no estimates were provided. (B) Displays the density of cumulative motorized Wikiloc tracks (km/km2). (C) Displays Wikiloc tracks (blue) and motorized features (orange) from Vilalta Capdevila et al. (2022). Base map sources: Esri, TomTom, Garmin, FAO, NOAA, USGS, ©OpenStreetMap contributors, and the GIS User Community.
Figure 7
Figure 7. Recreation trails in the Ghost Public Land Use Zone, Alberta, Canada, September 2023.
Photo credit: Talia Vilalta Capdevila, Brynn McLellan.
Figure 8
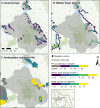
Figure 8. Winter motorized recreation intensity for (A) aerial surveys, (B) Wikiloc linear track density (km/km2), and (C) participatory mapping (PM) in the Kootenay Mountains, British Columbia, Canada.
Aerial surveys represent the percent footprint of snowmobile tracks in each grid cell. Hashed gray shading represents the areas surveyed by aerial flights between February and April 2022. Wikiloc linear track density represents the cumulative density (km/km2) of winter (November–April) GPS tracks from the app-users, 2015–2023. Participatory mapping represents the estimated number of motorized winter recreationists, 2017–2019. Base map sources: Esri, TomTom, Garmin, FAO, NOAA, USGS, ©OpenStreetMap contributors, and the GIS User Community.
Figure 9
Figure 9. Pearson’s correlation values of monthly counts of biking activities for Strava Metro compared to (A) cameras and (B) counters in Canmore, Alberta, Canada.
Base map sources: Esri, TomTom, Garmin, Maxar, Airbus DS, NGA, USGS, NASA, CGIAR, N Robinson, NCEAS, NLS, NOAA, OS, NMA, Geodatastyrelsen, Rijkswaterstaat, GSA, Geoland, FEMA, Intermap, ©OpenStreetMap contributors, and the GIS User Community.

References

    1. Alberta Government Human and wildlife coexistence: recommendations for improving human-wildlife coexistence in the Boy valley. 2018. https://www.alberta.ca/bow-valley-human-wildlife-coexistence-engagement#.... [20 January 2024]. https://www.alberta.ca/bow-valley-human-wildlife-coexistence-engagement#...
    1. Balmford A, Green JMH, Anderson M, Beresford J, Huang C, Naidoo R, Walpole M, Manica A. Walk on the wild side: estimating the global magnitude of visits to protected areas. PLOS Biology. 2015;13:e1002074. doi: 10.1371/journal.pbio.1002074. - DOI - PMC - PubMed
    1. Barrueto M, Forshner A, Whittington J, Clevenger AP, Musiani M. Protection status, human disturbance, snow cover and trapping drive density of a declining wolverine population in the Canadian Rocky Mountains. Scientific Reports. 2022;12:17412. doi: 10.1038/s41598-022-21499-4. - DOI - PMC - PubMed
    1. Braunisch V, Patthey P, Arlettaz R. Spatially explicit modeling of conflict zones between wildlife and snow sports: prioritizing areas for winter refuges. Ecological Applications. 2011;21:955–967. doi: 10.1890/09-2167.1. - DOI - PubMed
    1. Brown G. Public participation GIS (PPGIS) for regional and environmental planning: reflections on a decade of empirical research. Journal of the Urban and Regional Information Systems Association. 2011;24:7–17.

Publication types

LinkOut - more resources