[Preprint]. 2025 Mar 6:2024.08.31.610597.
doi: 10.1101/2024.08.31.610597.

Evolution of lateralized gustation in nematodes

Affiliations

Evolution of lateralized gustation in nematodes

Marisa Mackie et al. bioRxiv. .

Update in

  • Evolution of lateralized gustation in nematodes.
    Mackie M, Le VV, Carstensen HR, Kushnir NR, Castro DL, Dimov IM, Quach KT, Cook SJ, Hobert O, Chalasani SH, Hong RL. Mackie M, et al. Elife. 2025 Jun 30;14:RP103796. doi: 10.7554/eLife.103796. Elife. 2025. PMID: 40586702 Free PMC article.

Abstract

Animals with small nervous systems have a limited number of sensory neurons that must encode information from a changing environment. This problem is particularly exacerbated in nematodes that populate a wide variety of distinct ecological niches but only have a few sensory neurons available to encode multiple modalities. How does sensory diversity prevail within this constraint in neuron number? To identify the genetic basis for patterning different nervous systems, we demonstrate that sensory neurons in Pristionchus pacificus respond to various salt sensory cues in a manner that is partially distinct from that of the distantly related nematode Caenorhabditis elegans. By visualizing neuronal activity patterns, we show that contrary to previous expectations based on its genome sequence, the salt responses of P. pacificus are encoded in a left/right asymmetric manner in the bilateral ASE neuron pair. Our study illustrates patterns of evolutionary stability and change in the gustatory system of nematodes.

Keywords: Pristionchus pacificus; calcium imaging; chemosensory neurons; lateral asymmetry.


Figures

Figure 1.
Figure 1.. A comparison of chemotaxis responses to water-soluble ions between P. pacificus and C. elegans.
J4 to Adult hermaphrodites from the two species responded to NH4I, LiCl, and acetates significantly differently. Using two-way ANOVA, significant difference found between wildtype P. pacificus and C. elegans for the same salt is indicated above each pair (*p<0.05, ****p<0.0001), while the differences within P. pacificus is as follows: all salts showed difference when compared to NaAc and to NH4Ac( ****p<0.0001), but not between NH4Ac and NaAc. Both LiCl and NaCl attraction are significantly lower than NH4Cl (*p<0.05) and NH4I (***p<0.001). Error bars denote standard error of the mean and the sample sizes are indicated on the bottom.
Figure 2.
Figure 2.. P. pacificus che-1 expression in ASE and AFD amphid neurons.
(A-B) The che-1::GFP marker in the che-1::RCaMP reporter strain is expressed in the ASE and AFD amphid neurons. (C) che-1::GFP expression is detectable in the morphologically distinct AFD neurons with ‘finger’-like dendritic endings. (D-E) Immunostaining of CHE-1::ALFA shows two pairs of amphid neuron cell bodies corresponding to the ASE and AFD neurons; dorsal-ventral view (n=114). (F) The loss of che-1 results in loss che-1::RFP expression in the ASE (circle) while retaining reduced AFD expression. (G) ttx-1p::RFP expression in the AFD neurons with ‘finger’-like dendritic endings. Inset shows expanded inverted black-white image of the AFD dendritic ending. (H) AFD expression of the same ttx-1::RFP animal shown in (G) in a different plane with cell body in focus. (I-J) Immunostaining of TTX-1::ALFA (red) shows one pair of amphid neuron cell bodies co-localizing with the anterior pair of che-1::GFP-expressing AFD neurons (yellow); dorsal-ventral view (n=13). Anterior is left and the scale bar in (C) represents 50 μm for all panels except for the G inset, which is 5 μm.
Figure 3.
Figure 3.. che-1 expressing amphid neurons are required for sensing water-soluble ions in P. pacificus.
(A) The che-1 locus with CRISPR/Cas9- induced mutations in Exon 1. (B) The che-1 mutants show defects in attraction towards NH4Br, NH4Cl, and LiCl. Sample sizes are indicated below for attractants and above for repellent. (C) The che-1p::HisCl1 animals lose attraction towards NH4Br, NH4Cl, and NH4I in a histamine dependent manner. Sample sizes are indicated at the base of each bar. (D) A schematic map of the P. pacificus AM7(ASE) and AM12(AFD) amphid neurons that express the che-1p::RCaMP used in calcium imaging. The ASE axons are the only amphid axons in P. pacificus to cross each other over the dorsal lateral midline contralaterally. **P<0.01, *P<0.05 Two-way ANOVA with Dunnett’s post-hoc comparison showing alleles with significant difference to wildtype P. pacificus (PS312). ****P<0.0001 Two-way ANOVA showing significant difference between water control and histamine treatment.
Figure 4.
Figure 4.. ASEL and ASER responses to different concentrations of NH4Cl, NaCl, and NH4I.
Average percent change in RCaMP fluorescence (dF/F) over time (seconds) of tracked ASE (left and right) sensory neurons in P. pacificus. Salts were presented at 10s (“ON”, left vertical line) for a duration of 20s, and then removed (“OFF”, right vertical line) for the remaining 30s; the total recording time was 60s. (A-B) ASEL and ASER neuron responses to high (250 mM, red) compared to low (25 mM, blue) concentrations of NH4Cl. (C-D) ASEL and ASER neuron responses to NaCl. (E-F) ASEL and ASER neuron responses to NH4I. Shaded ribbons represent 95% confidence intervals. Shaded ribbons in (E-F) have been cropped to maintain consistent y-axes across the plots, allowing for easier comparison. Sample sizes are indicated (n).
Figure 5.
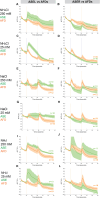
Figure 5.. Combined AFD responses in comparison to ASE left or right neuron responses to NH4Cl, NaCl, and NH4I.
Average percent change in RCaMP fluorescence (dF/F) over time (seconds) as described in Fig. 4. Averaged combined AFD (left and right neurons, orange) compared to left or right ASE (green) responses to (A-B) 250mM NH4Cl (C-D) 25mM NH4Cl (E-F) 250mM NaCl (G-H) 25mM NaCl (I-J) 250mM NH4I (K-L) 25mM NH4I. Shaded ribbons represent 95% confidence intervals. Shaded ribbons in (J-K) have been cropped to maintain consistent y-axes across the plots, allowing for easier comparison. Sample sizes are indicated (n).
Figure 6.
Figure 6.. The laterally asymmetric expression of gcy-22.3 is dependent on the zinc finger transcription factor CHE-1.
(A) The gcy-22.3::GFP marker is expressed exclusively in the right ASE neuron (ASER)(n>200). (B) The gcy-22.3::GFP marker co-localizes with che-1::RFP expression in the ASER. (C) gcy-22.3::GFP expression is absent in the che-1(ot5012) mutant (n=55). Anterior is left and dorsal is top. Scale bar in (A) represents 50 μm for all panels.
Figure 7.
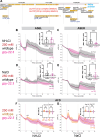
Figure 7.. ASE and AFD responses in wildtype compared to gcy-22.3 mutants.
Average percent change in RCaMP fluorescence (dF/F) over time (seconds) as described in Fig. 4. (A) www.pristionchus.org Genome Browser view of the gcy-22.3 locus with the CRISPR/Cas9-induced mutations indicated with a red bar (Exon 5 of PPA04454 or Exon 4 of Contig12-snapTAU.506). (B-C) ASEL and ASER neuron responses to 250 mM NH4Cl wildtype (gray) and gcy-22.3 mutants (magenta). (D-E) ASEL and ASER neuron responses to 250 mM NaCl in wildtype (gray) and gcy-22.3 mutants (magenta). AFD (combined left and right neurons) responses (F) to 250 mM NH4Cl and (G) to 250 mM NaCl in wildtype (orange) and gcy-22.3 mutants (magenta). Shaded ribbons represent 95% confidence intervals. Sample sizes are indicated (n). For ASEL/R comparisons, bar plots represent the difference between the minimum % dF/F value 10s pre-stimulus and maximum % dF/F value 10s post-stimulus for either the (B) ON or (C-E) OFF stimulus. For AFD comparisons, bar plots represent maximum % dF/F values 10s after the ON and OFF stimulus. *P<0.05, **P<0.01, ***P<0.001 indicate significant difference. “ns” indicate no significant difference. Comparisons between different genotypes were analyzed using unpaired t-test or Mann-Whitney test.
Figure 8.
Figure 8.. Chemotaxis responses to individual ions in gcy-22.3 mutants.
Young adult hermaphrodite responses to salt gradients with or without various salts in background. *P<0.05 Significant differences were found between wildtype PS312 and gcy-22.3 mutants to NH4Cl by two-way ANOVA and Dunnett’s test. Each assay involves a minimum of 10 animals. Sample sizes for each condition are indicated on the bottom. Error bars denote standard error of the mean.

References

    1. Bargmann C., “Chemosensation in C elegans” in WormBook, Jorgensen E., Ed. (2006). - PMC - PubMed
    1. Hong R. L., Sommer R. J., Chemoattraction in Pristionchus Nematodes and Implications for Insect Recognition. Curr Biol 16, 2359–2365 (2006). - PubMed
    1. Chaisson K. E., Hallem E. A., Chemosensory behaviors of parasites. Trends Parasitol 28, 427–436 (2012). - PMC - PubMed
    1. Wheeler N. J., Heimark Z. W., Airs P. M., Mann A., Bartholomay L. C., Zamanian M., Genetic and functional diversification of chemosensory pathway receptors in mosquito-borne filarial nematodes. Plos Biol 18, e3000723 (2020). - PMC - PubMed
    1. Rengarajan S., Hallem E. A., Olfactory circuits and behaviors of nematodes. Curr Opin Neurobiol 41, 136–148 (2016). - PMC - PubMed

Publication types

LinkOut - more resources