[Preprint]. 2024 Sep 7:2024.09.04.611120.
doi: 10.1101/2024.09.04.611120.

Claudin-4 remodeling of nucleus-cell cycle crosstalk maintains ovarian tumor genome stability and drives resistance to genomic instability-inducing agents

Affiliations

Claudin-4 remodeling of nucleus-cell cycle crosstalk maintains ovarian tumor genome stability and drives resistance to genomic instability-inducing agents

Fabian R Villagomez et al. bioRxiv. .

Abstract

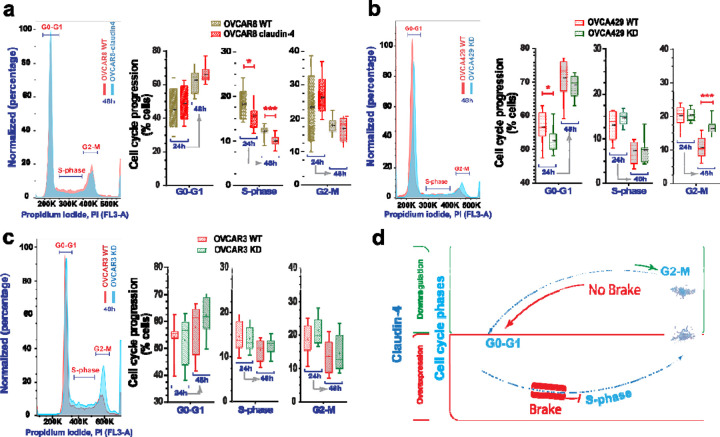
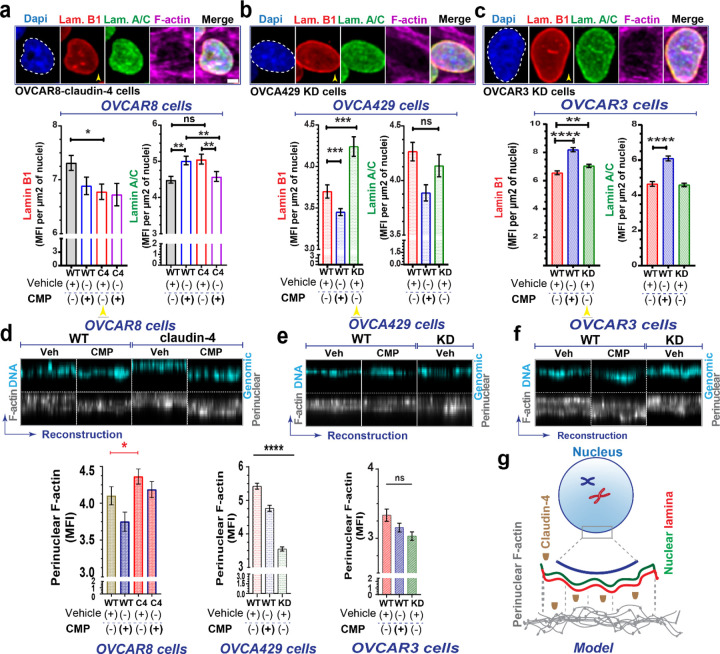
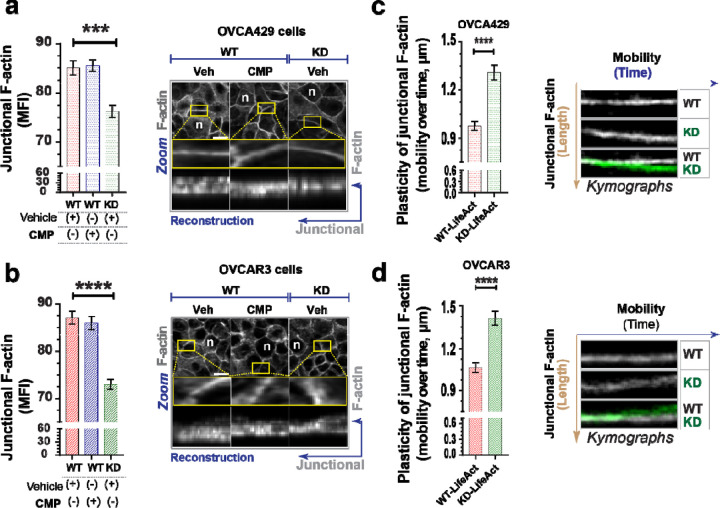
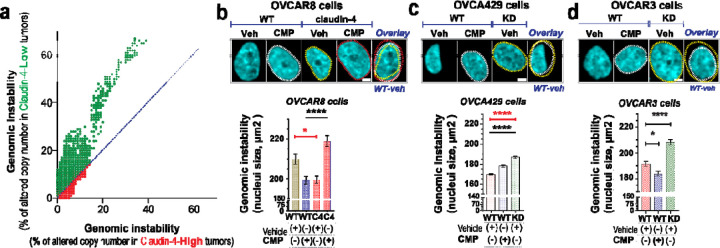
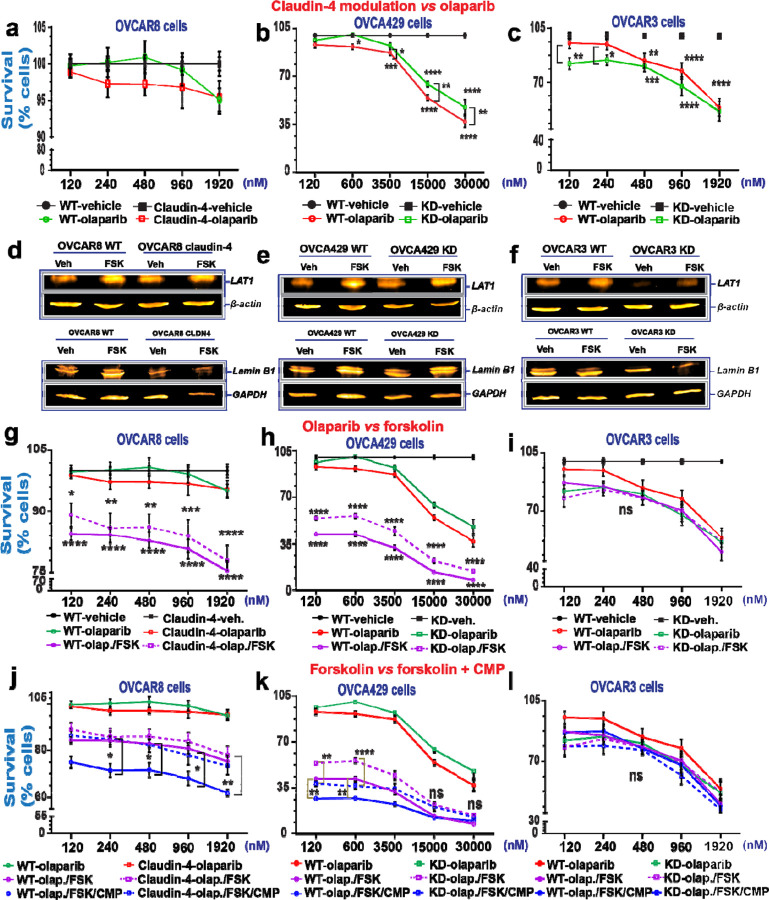
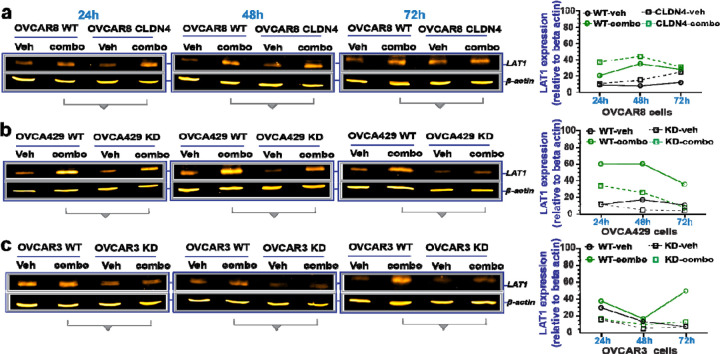
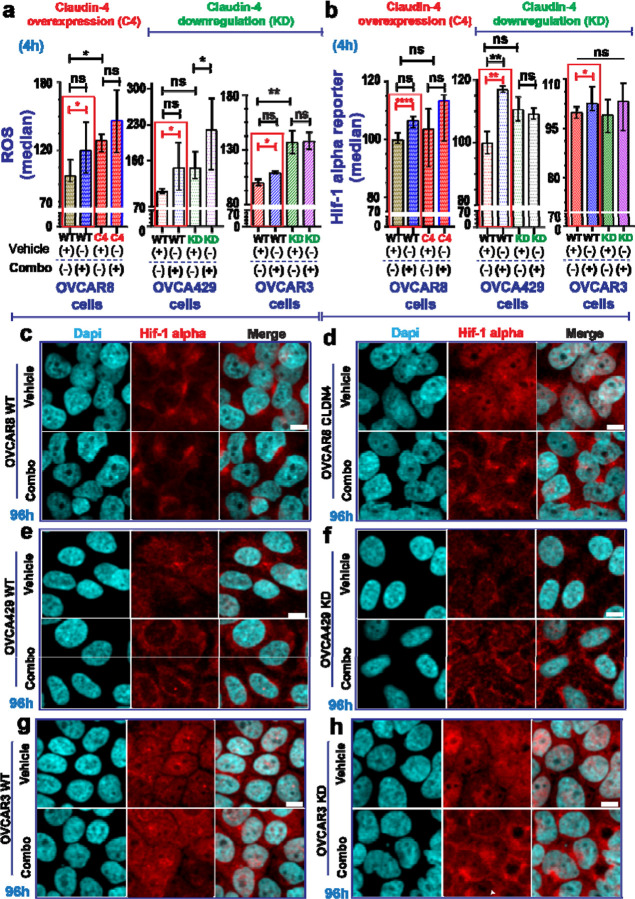
During cancer development, the interplay between the nucleus and the cell cycle leads to a state of genomic instability, often accompanied by observable morphological aberrations. These aberrations can be controlled by tumor cells to evade cell death, either by preventing or eliminating genomic instability. In epithelial ovarian cancer (EOC), overexpression of the multifunctional protein claudin-4 is a key contributor to therapy resistance through mechanisms associated with genomic instability. However, the molecular mechanisms underlying claudin-4 overexpression in EOC remain poorly understood. Here, we altered claudin-4 expression and employed a unique claudin-4 targeting peptide (CMP) to manipulate the function of claudin-4. We found that claudin-4 facilitates genome maintenance by linking the nuclear envelope and cytoskeleton dynamics with cell cycle progression. Claudin-4 caused nuclei constriction by excluding lamin B1 and promoting perinuclear F-actin accumulation, associated with remodeling nuclear architecture, thus altering nuclear envelope dynamics. Consequently, cell cycle modifications due to claudin-4 overexpression resulted in fewer cells entering the S-phase and reduced genomic instability. Importantly, disrupting biological interactions of claudin-4 using CMP and forskolin altered oxidative stress cellular response and increased the efficacy of PARP inhibitor treatment. Our data indicate that claudin-4 protects tumor genome integrity by remodeling the crosstalk between the nuclei and the cell cycle, leading to resistance to genomic instability formation and the effects of genomic instability-inducing agents.

Keywords: HIF-1; LAT1; Ovarian cancer; PARPi; ROS; forskolin; genomic integrity; lamin B1; nuclei; perinuclear F-actin.


Figures

Figure 1.
Figure 1.. Cell cycle progression during claudin-4 modulation.
Ovarian tumor cells were cultured and stained for propidium iodide (PI) at 24h and 48h, and cell cycle progression was evaluated via flow cytometry. (a) Representative histograms of cell cycle phases during claudin-4 overexpression; right, percentages of cells at each cell cycle stage. Effect of claudin-4 downregulation in OVCA429 (b) and OVCAR3 (c). (d) Model illustrating that claudin-4 overexpression reduces the proportion of tumor cells in the S-phase of the cell cycle, while its downregulation results in an accumulation of cells in the G2-M phase and a decrease in the G0-G1 phase. (4 independent experiments; Two-tailed Unpaired t test; significance p<0.05). Graphs show mean and SEM (standard error of the mean).
Figure 2.
Figure 2.. Claudin-4 modifies the nuclear architecture of ovarian tumor cells.
The association of claudin-4 with the actin cytoskeleton was evaluated in fixed and living cells. Ovarian tumor cells were treated with CMP (400µM) for 48 h and were stained via immunofluorescence to mark lamin B1 and lamin A/C, while the actin-cytoskeleton was stained with phalloidin. We then carried out a morphometric characterization. (a). Top, selected confocal images (maximum projections) corresponding to OVCAR8 cells overexpressing claudin-4 and claudin-4 downregulation in OVCA429 cells (bottom) (b). Results of similar experiments in OVCAR3 claudin-4 KD cells (c), showing the nuclear lamina components (lamin B1, and lamin A/C), bottom, with corresponding quantification of nuclear accumulation of the nuclear lamina components (yellow arrowheads highlight comparison of lamin B1 during claudin-4 overexpression and downregulation) under different conditions (three independent experiments; Kruskal-Wallis test with Dunn’s multiple comparisons, p<0.05). (d), (e), and (f), top, show reconstructions of perinuclear F-actin and genomic DNA (from confocal z-stacks), and, bottom, corresponding quantification in OVCAR8, OVCA429, and OVCAR3 cells, respectively. Additionally, a drawing highlights the remodeling effect of claudin-4 in the nuclear architecture (n= OVCAR8, 1711 cells; OVCA429, 2630 cells; OVCAR3, 2365 cells; Two-tailed Mann Whitney test, Kruskal-Wallis test with Dunn’s multiple comparisons). Graphs show mean and SEM, scale bar 5µm.
Figure 3.
Figure 3.. Disruption of claudin-4 impacts dynamics of junctional actin.
Ovarian tumor cells were treated with CMP (400µM) for 48h and stained to mark the actin-cytoskeleton. Additionally, ovarian tumor cells expressing LifeAct (a marker of F-actin) were used to visualize actin dynamics in living cells. (a) and (b), left, quantification of junctional F-actin from reconstructions (from confocal z-stacks); right, confocal images (maximum projection) and zoom, followed by reconstruction of selected regions of interest, ROIs (at junctional F-actin) from OVCA429 cells and OVCAR3 cells (bottom), respectively (n= OVCA429, 783 cells; OVCAR3, 825 cells; Kruskal-Wallis test with Dunn’s multiple comparisons). (c) and (d), kymographs illustrating the movement of junctional F-actin (vertical brown arrow) over time (horizontal blue arrow), generated from different regions of interest (ROIs) during confocal live-cell imaging of transduced OVCA429 cells (n=142) with LifeAct to mark F-actin (without any stimuli and cultured for 24h) and OVCAR3 cells (bottom) (n=116), respectively (Two-tailed Mann Whitney test) (3 independent experiments; significance, p<0.05). Graphs show mean and SEM.
Figure 4.
Figure 4.. Claudin-4’s association genomic instability correlates with nuclei constriction.
The association of claudin-4 with genomic instability was analyzed in human tumors (TCGA) and in vitro by treating cells with CMP (400µM) for 48h followed by single cell analysis of fixed cells (stained with DAPI to mark DNA). (a), correlation of genomic instability (indicated as % of altered chromosomic copy numbers) in human ovarian tumors associated with levels of claudin-4 expression. (b), top, confocal images showing (maximum projections) genomic instability (indicated as nuclei size, bottom: corresponding quantification) associated with claudin-4 overexpression or downregulation (knockdown, KD) in OVCA429 (c) and OVCAR3 (d). (n= OVCAR8, 1711 cells; OVCA429, 2630 cells; Two-tailed Mann Whitney test, Kruskal-Wallis test with Dunn’s multiple comparisons). (3 independent experiments; significance, p<0.05. Graphs show mean and SEM, scale bar 5µm.
Figure 5.
Figure 5.. Targeting ovarian tumor cells during claudin-4 expression via forskolin and CMP to overcome resistance against olaparib.
Survival of ovarian tumor cells was analyzed using the 7 day colony formation assay and two cycles of treatment (at day 0 and day 3) for OVCAR8 and OVCAR3 cells, and one treatment for OVCA429 (at day 0). (a), percentage of tumor cell survival during olaparib treatment and claudin-4 overexpression, and similar information during claudin-4 downregulation in OVCA429 cells (b) and OVCAR3 cells (c). Immunoblotting for LAT1 and lamin B1 during forskolin treatment (5µM/ 48h) during claudin-4 overexpression in OVCAR8 cells (d, and bottom), and similar information during claudin-4 downregulation in OVCA429 cells (e, and bottom) and OVCAR3 cells (f, and bottom). (g), percentage of tumor cell survival during olaparib treatment vs olaparib + FSK (5µM) and claudin-4 overexpression, and similar information during claudin-4 downregulation in OVCA429 cells (h) and OVCAR3 cells (i). (j), percentage of tumor cell survival during olaparib + FSK (5µM) vs olaparib + FSK (5µM) + CMP (400µM) and claudin-4 overexpression, and similar information during claudin-4 downregulation in OVCA429 cells (k) and OVCAR3 cells (l). (3 independent experiments; Two-way ANOVA; significance p<0.05). Graphs show mean and SEM.
Figure 6.
Figure 6.. Effect of the combination treatment with olaparib, forskolin, and CMP on LAT1 expression.
Ovarian tumor cells were treated with a tripartite combination of olaparib (600nM), fsk (5µM), and CMP (400µM) for different time points. Subsequently, cell lysates were obtained to carry out immunoblotting for LAT1. (a), (b), and (c) show LAT1 protein expression at different time points in OVCAR8, OVCA429, and OVCAR3 cells, respectively. On the right are graphs showing corresponding quantification of LAT1 from (a), (b), and (c), relative to loding control.
Figure 7.
Figure 7.. Cellular stress response evaluation in ovarian tumor cells treated with olaparib, forskolin, and CMP.
Ovarian tumor cells were treated with a tripartite combination of olaparib (600nM), fsk (5µM), and CMP (400µM) for 4h to analyze reactive oxygen species (ROS) as well as a reporter gene for hif-1 alpha via flow cytometry. The same cells were treated similarly for 96h and then stained using immunofluorescence to mark lamin B1. ROS generation is indicated as normalization relative median of OVCAR8 WT, OVCA429 WT, and OVCAR3 WT cells without treatment (a) (2 independent experiments; Unpair t-test, red rectangle; One-way ANOVA and Tukey’s multiple comparison test, p<0.05). Reported hif-1 alpha is indicated as normalization relative median of OVCAR8 WT, OVCA429 WT, and OVCAR3 WT cells without treatment (b) (3 independent experiments; Unpair t-test; One-way ANOVA and Tukey’s multiple comparison test, p<0.05). (c) and (d) are confocal images showing hif-1 alpha during claudin-4 overexpression in OVCAR8 cells treated or not as indicated above at 96h. (e) and (f) are confocal images showing hif-1 alpha during claudin-4 downregulation in OVCA429 cells treated or not as indicated above at 96h. (g) and (h) are confocal images showing hif-1 alpha during claudin-4 downregulation in OVCAR3 cells treated or not as indicated above at 96h. Graphs shown median with 95% confidence interval (CI). Scale bar 10µm.

Similar articles

References

    1. Hanahan D. Hallmarks of Cancer: New Dimensions. Cancer Discov 2022;12(1):31–46 doi 10.1158/2159-8290.CD-21-1059. - DOI - PubMed
    1. Aguilar-Aragon M, Bonello TT, Bell GP, Fletcher GC, Thompson BJ. Adherens junction remodelling during mitotic rounding of pseudostratified epithelial cells. EMBO Rep 2020;21(4):e49700 doi 10.15252/embr.201949700. - DOI - PMC - PubMed
    1. Davidson PM, Cadot B. Actin on and around the Nucleus. Trends Cell Biol 2021;31(3):211–23 doi 10.1016/j.tcb.2020.11.009. - DOI - PubMed
    1. Lim S, Quinton RJ, Ganem NJ. Nuclear envelope rupture drives genome instability in cancer. Mol Biol Cell 2016;27(21):3210–3 doi 10.1091/mbc.E16-02-0098. - DOI - PMC - PubMed
    1. Maninova M, Vomastek T. Dorsal stress fibers, transverse actin arcs, and perinuclear actin fibers form an interconnected network that induces nuclear movement in polarizing fibroblasts. FEBS J 2016;283(20):3676–93 doi 10.1111/febs.13836. - DOI - PubMed

Publication types