[Preprint]. 2024 Sep 3:2024.09.02.610840.
doi: 10.1101/2024.09.02.610840.

Early brain neuroinflammatory and metabolic changes identified by dual tracer microPET imaging in mice with acute liver injury

Affiliations

Early brain neuroinflammatory and metabolic changes identified by dual tracer microPET imaging in mice with acute liver injury

Santhoshi P Palandira et al. bioRxiv. .

Abstract

Background: Acute liver injury (ALI) that progresses into acute liver failure (ALF) is a life-threatening condition with an increasing incidence and associated costs. Acetaminophen (N-acetyl-p-aminophenol, APAP) overdosing is among the leading causes of ALI and ALF in the Northern Hemisphere. Brain dysfunction defined as hepatic encephalopathy is one of the main diagnostic criteria for ALF. While neuroinflammation and brain metabolic alterations significantly contribute to hepatic encephalopathy, their evaluation at early stages of ALI remained challenging. To provide insights, we utilized post-mortem analysis and non-invasive brain micro positron emission tomography (microPET) imaging of mice with APAP-induced ALI.

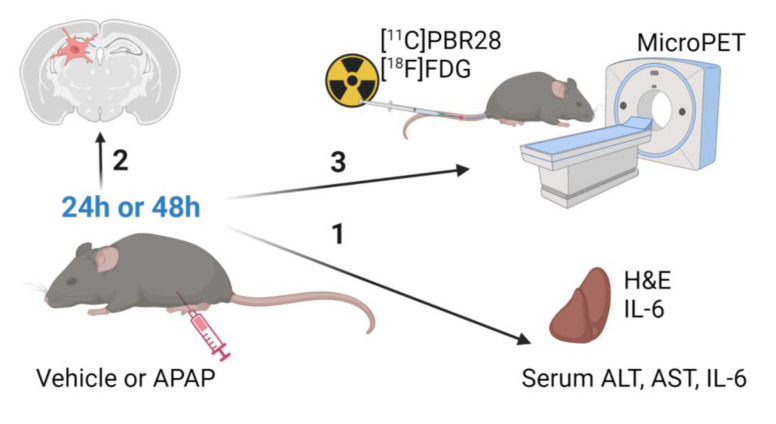
Methods: Male C57BL/6 mice were treated with vehicle or APAP (600 mg/kg, i.p.). Serum alanine aminotransferase (ALT), aspartate aminotransferase (AST), liver damage (using H&E staining), hepatic and serum IL-6 levels, and hippocampal IBA1 (using immunolabeling) were evaluated at 24h and 48h. Vehicle and APAP treated animals also underwent microPET imaging utilizing a dual tracer approach, including [11C]-peripheral benzodiazepine receptor ([11C]PBR28) to assess microglia/astrocyte activation and [18F]-fluoro-2-deoxy-2-D-glucose ([18F]FDG) to assess energy metabolism. Brain images were pre-processed and evaluated using conjunction and individual tracer uptake analysis.

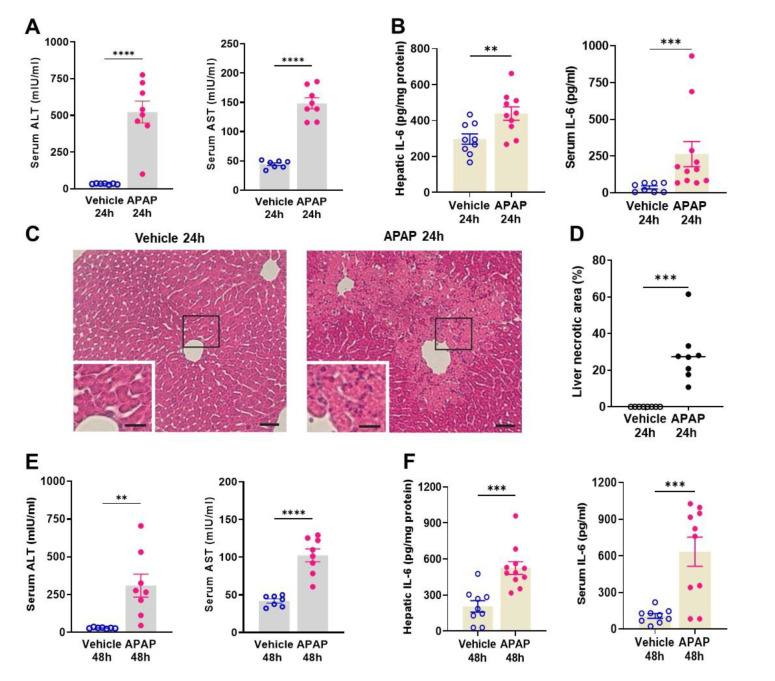
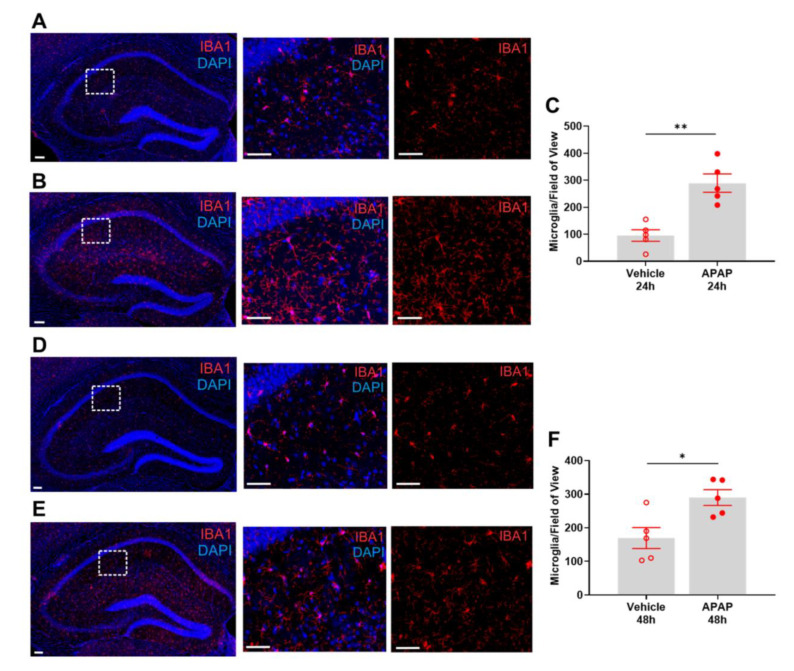
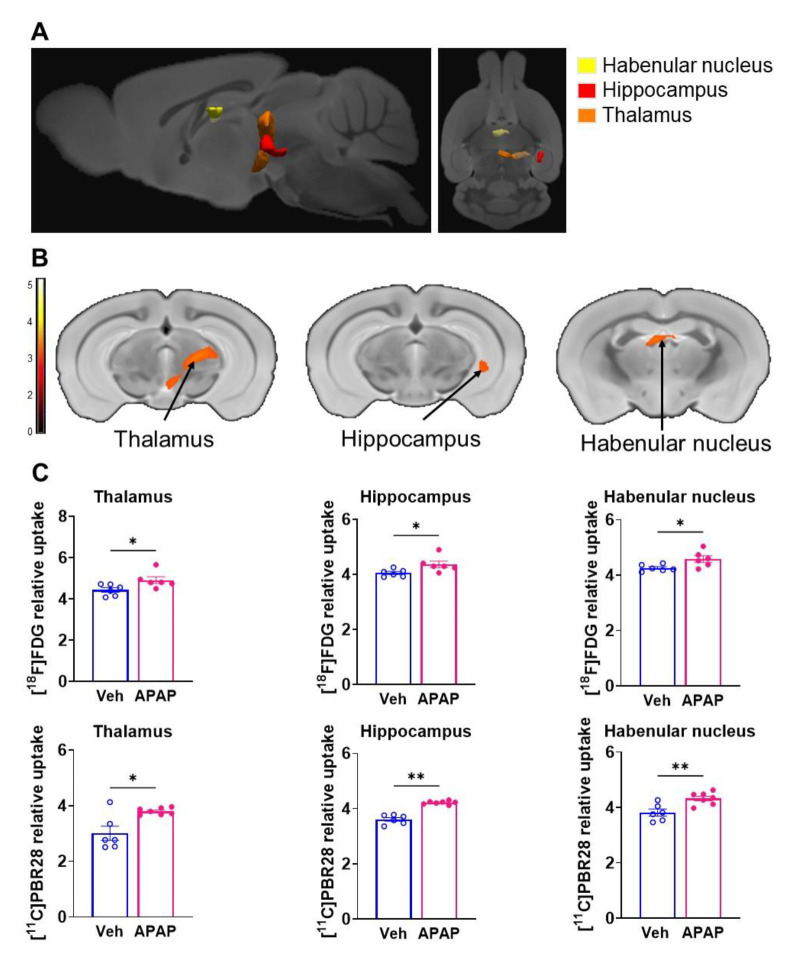
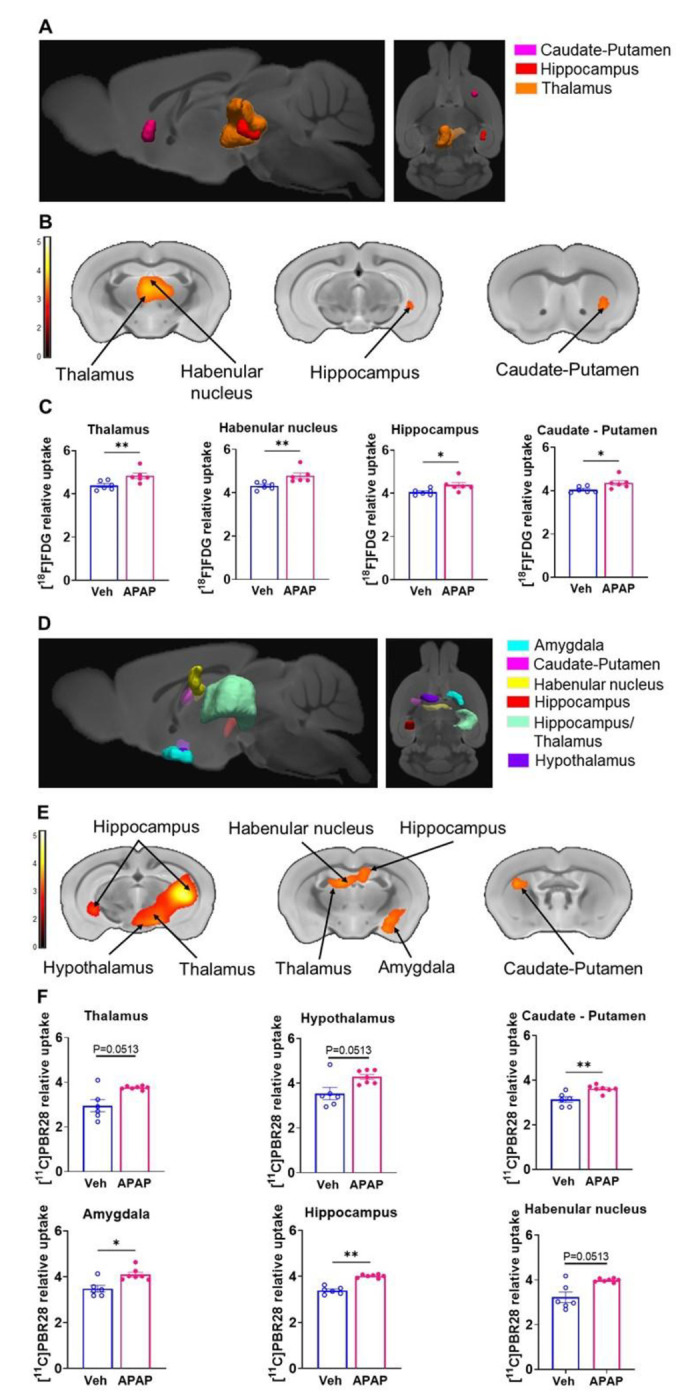
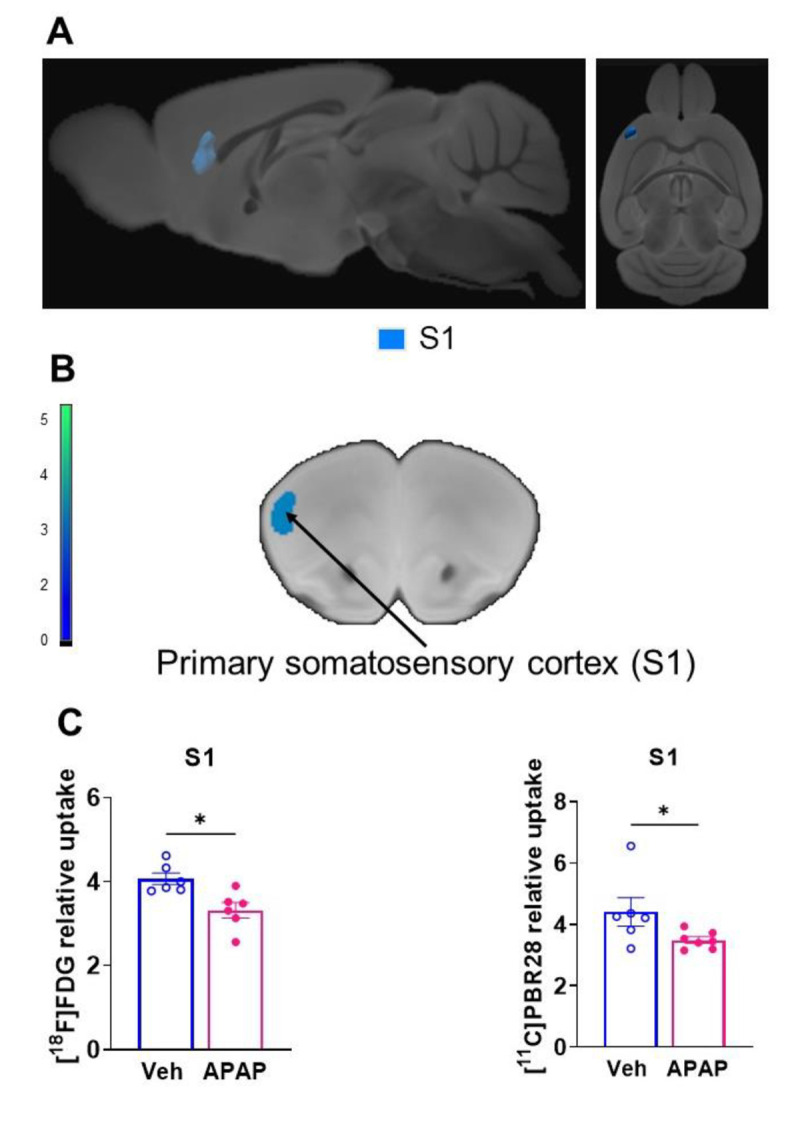
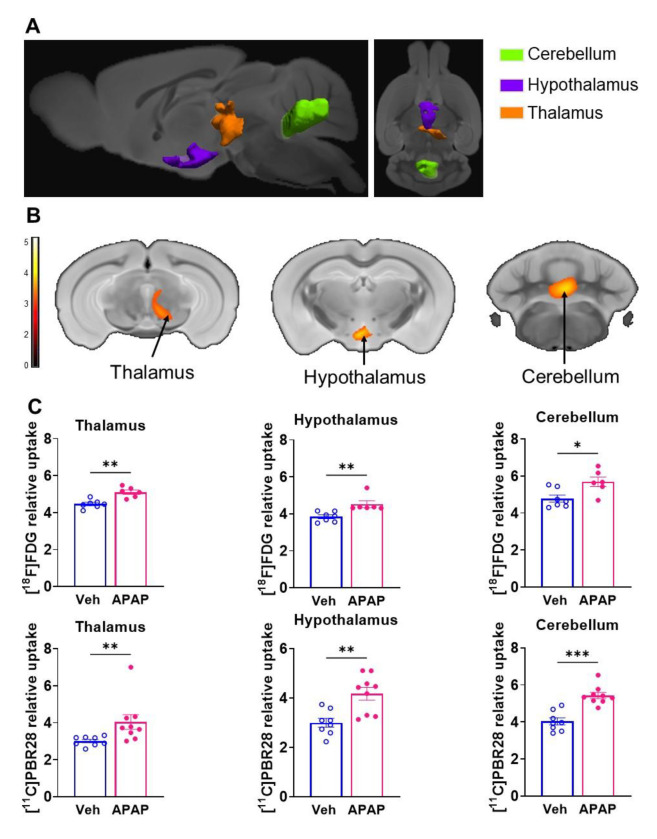
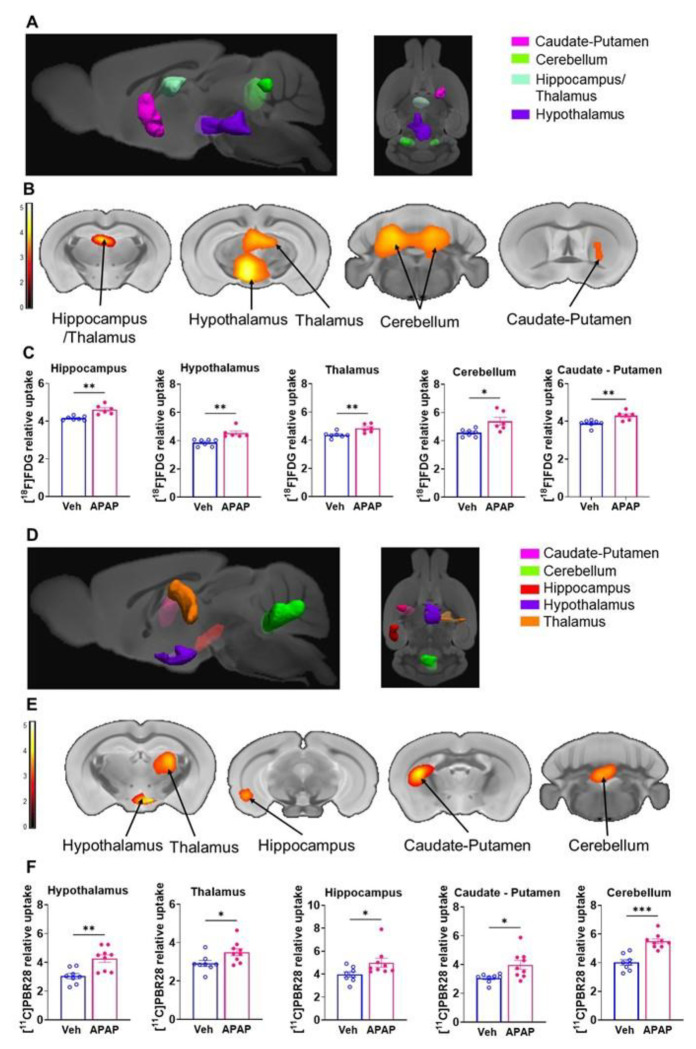
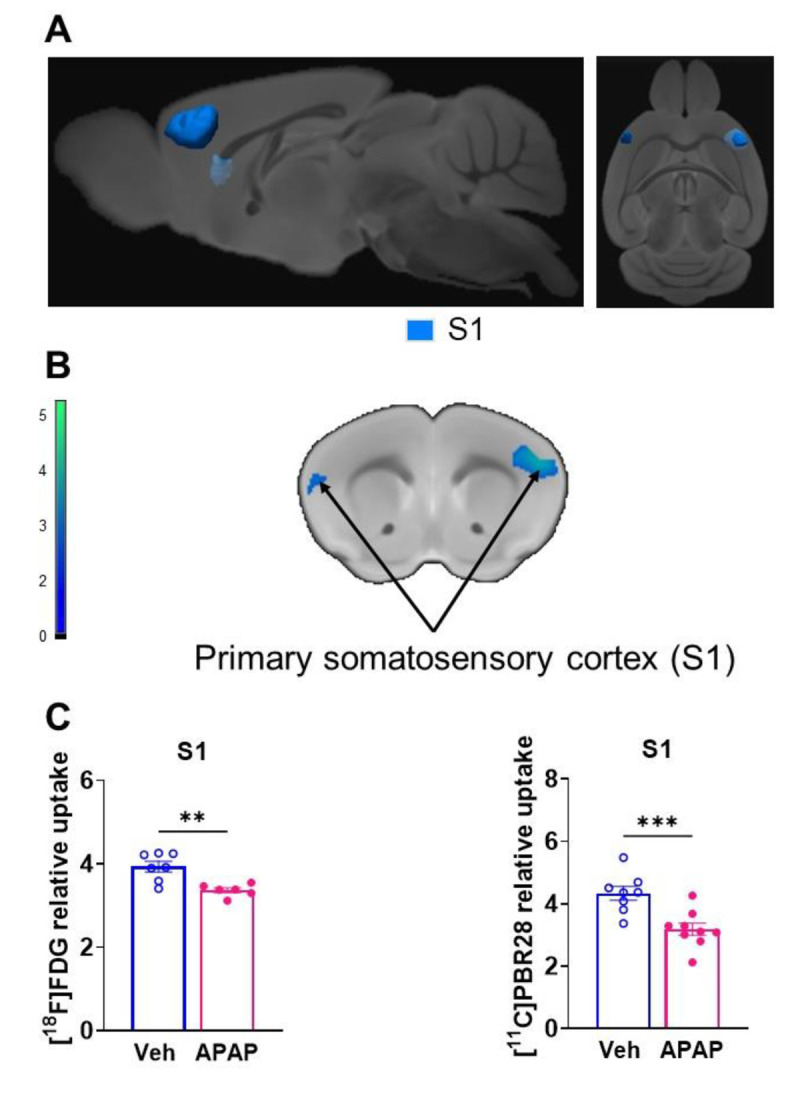
Results: APAP-induced ALI and hepatic and systemic inflammation were detected at 24h and 48h by significantly elevated serum ALT and AST levels, hepatocellular damage, and increased hepatic and serum IL-6 levels. In parallel, increased microglial numbers, indicative for neuroinflammation were observed in the hippocampus of APAP-treated mice. MicroPET imaging revealed overlapping increases in [11C]PBR28 and [18F]FDG uptake in the hippocampus, thalamus, and habenular nucleus indicating microglial/astroglial activation and increased energy metabolism in APAP-treated mice (vs. vehicle-treated mice) at 24h. Similar significant increases were also found in the hypothalamus, thalamus, and cerebellum at 48h. The individual tracer uptake analyses (APAP vs vehicle) at 24h and 48h confirmed increases in these brain areas and indicated additional tracer- and region-specific effects including hippocampal alterations.

Conclusion: Peripheral manifestations of APAP-induced ALI in mice are associated with brain neuroinflammatory and metabolic alterations at relatively early stages of disease progression, which can be non-invasively evaluated using microPET imaging and conjunction analysis. These findings support further PET-based investigations of brain function in ALI/ALF that may inform timely therapeutic interventions.

Keywords: acetaminophen; acute liver injury; brain; brain glucose metabolism; conjunction analysis; neuroinflammation; non-invasive microPET imaging.


Figures

Figure 1.
Figure 1.. Experimental design.
Cohorts of animals were injected (i.p.) with vehicle or APAP. 24h or 48h later the following analyses were performed: 1) mice were euthanized and processed for analyzing liver injury and hepatic and serum IL-6 levels; 2) brains were isolated and processed for IBA1 immunohistochemistry for hippocampal microglia evaluation; and 3) mice were subjected to dual tracer microPET imaging for a non-invasive assessment of neuroinflammation and brain energy metabolism.
Figure 2.
Figure 2.. APAP induces significant liver injury and increases hepatic and serum IL-6 levels.
(A) Serum ALT and AST levels are significantly higher in APAP-treated compared with vehicle-treated mice (****P < 0.0001; Student’s t-test) at 24h. (B) Hepatic IL-6 levels (**P = 0.009; Student’s t-test) and serum IL-6 levels (***P = 0.0002; Mann-Whitney test) are significantly increased in APAP-mice compared with controls at 24h. (C) APAP induces hepatocellular damage at 24h, including loss of cellular integrity and vacuolization as indicated in representative images (scale bar = 50 μm in the main images and scale bar = 25 μm in the inserted images). (D) Quantification of liver injury based on necrotic areas of liver slices (***P = 0.0002; Kolmogorov-Smirnov test) ( E) Serum ALT and AST levels are significantly higher in APAP administered mice compared with vehicle treated controls (**P = 0.005, ****P < 0.0001; Student’s t-test) at 48h. (F) Hepatic (***P = 0.0004; Students t-test) and serum IL-6 levels (*** P = 0.0007; Students t-test) are significantly increased in APAP mice compared with controls at 48h. Data are presented as individual mouse data points with mean ± SEM.
Figure 3.
Figure 3.. APAP is associated with significant increases of hippocampal microglia.
(A) Representative images of hippocampal IBA1 positive cells in vehicle treated mice at 24h. Low magnification image (panel 1, scale bar = 100 μM) with designated (broken line) area that is magnified and presented as panel 1 (IBA1 and DAPI immunostaining) and panel 3 (IBA1 immunostaning) (scale bar = 50 μm). (B) Representative images of hippocampal IBA1 positive cells in APAP treated mice at 24h. 20X magnification image (panel 1, scale bar = 100 μm) with designated (broken line) area that is magnified and presented as panel 1 (IBA1 and DAPI immunostaining) and panel 3 (IBA1 immunostaning) (scale bar = 50 μm). (C) Microglial quantitation based on IBA1 staining demonstrating a significant increase in the hippocampus of APAP-treated mice compared with vehicle treated controls (**P = 0.008, Mann-Whitney test). Data are presented as individual mouse data points with mean ± SEM. (D) Representative images of hippocampal IBA1 positive cells in vehicle treated mice at 48h. 20X magnification image (panel 1, scale bar = 100 μm) with designated (broken line) area that is magnified and presented as panel 1 (IBA1 and DAPI immunostaining) and panel 3 (IBA1 immunostaining) (scale bar = 50 μm). (E) Representative images of hippocampal IBA1 positive cells in APAP treated mice at 48h. Low magnification image (panel 1, scale bar = 100 μm) with designated (broken line) area that is magnified and presented as panel 1 (IBA1 and DAPI immunostaining) and panel 3 (IBA1 immunostaning) (scale bar = 50 μm). (F) Microglial quantitation based on IBA1 staining demonstrating significant increase in the hippocampus of APAP-treated mice compared with vehicle treated controls (*P = 0.03, Mann-Whitney test). Data are presented as individual mouse data points with mean ± SEM.
Figure 4.
Figure 4.. Brain regions with overlapping [11C]PBR28 and [18F]FDG uptake increases at 24h during ALI.
Cumulative dual tracer uptake increases (statistically significant clusters at P < 0.01) in the thalamus, the hippocampus, and the habenular nucleus in APAP administered vs control mice as: (A) 3D shapes overlaid on brain sagittal and transverse MRI templates; and (B) affected areas overlaid on brain coronal MRI templates (color bar represents t-value height, cutoff threshold T = 2.4). See Supplementary Table 1 for stereotaxic coordinates. (C) Post-hoc analysis for the same statistically significant increases in [18F]FDG and [11C]PBR28 uptake in vehicle (control)- and APAP-treated mice. Statistically significant clusters show overlapping regions of increased uptake of [18F]FDG in the thalamus (*P = 0.0152; Mann-Whitney test), the hippocampus (*P= 0.02; Mann-Whitney test), and the habenular nucleus (*P = 0.03; Mann-Whitney test) as well as [11C]PBR28 in the thalamus (*P = 0.05; Mann-Whitney test), the hippocampus (**P = 0.001; Mann-Whitney test), and the habenular nucleus (**P = 0.009; Mann-Whitney test) in APAP administered vs control mice.
Figure 5.
Figure 5.. Brain regions with individual [11C]PBR28 and [18F]FDG uptake increases at 24h during ALI.
Cumulative [18F]FDG uptake increases (statistically significant clusters at P < 0.01) in the thalamus, the hippocampus, the habenular nucleus, and the caudate-putamen in APAP administered vs control mice as: (A) 3D shapes overlaid on brain sagittal and transverse MRI templates; and (B) affected areas overlaid on brain coronal MRI templates (color bar represents t-value height, cutoff threshold T = 2.4). See Supplementary Table 1 for stereotaxic coordinates. (C) Post-hoc analysis of [18F]FDG tracer uptake in the thalamus (**P = 0.009; Mann-Whitney test), habenular nucleus (**P = 0.002; Mann-Whitney test), hippocampus (*P = 0.03; Mann-Whitney test) and caudate-putamen (*P = 0.02; Mann-Whitney test). (D) 3D shapes of cumulative increased in [11C]PBR28 uptake (P < 0.01) in the thalamus, the hippocampus, the habenular nucleus, the hypothalamus, the amygdala, and the caudate putamen in APAP administered vs control mice. (E) cumulative increases in [11C]PBR28 uptake (P < 0.01) on brain coronal MRI brain templates (color bar represents t-value height, cutoff threshold T = 2.4). See Supplementary Table 1 for stereotaxic coordinates. (F) Post-hoc analysis of [11C]PBR28 uptake in the thalamus (P = 0.05, Mann-Whitney test), the hippocampus (**P = 0.0012; Mann-Whitney test), the habenular nucleus (P = 0.05; Mann-Whitney test), the hypothalamus (P = 0.05, Mann-Whitney test), the amygdala (*P = 0.02; Mann-Whitney test), and the caudate putamen (**P = 0.0052; Mann-Whitney test).
Figure 6.
Figure 6.. Brain regions with decreased overlapping [11C]PBR28 and [18F]FDG uptake at 24h during ALI.
Cumulative dual tracer uptake decreases (statistically significant clusters at P < 0.01) in the primary somatosensory cortex in APAP administered vs control mice as: (A) 3D shapes overlaid on sagittal and transverse MRI templates; and (B) affected areas overlaid on coronal MRI templates (color bar represents t-value height, cutoff threshold T = 2.4). (C) Post-hoc analysis of [18F]FDG (*P = 0.02; Mann-Whitney test) and [11C]PBR28 (*P = 0.04; Mann-Whitney test) decreases in the primary somatosensory cortex in the same groups of mice.
Figure 7.
Figure 7.. Brain regions with overlapping [11C]PBR28 and [18F]FDG uptake increases at 48h during ALI.
Cumulative dual tracer uptake increases (statistically significant clusters at P < 0.01) in the thalamus, the hypothalamus and the cerebellum in APAP administered vs control mice as: (A) 3D shapes overlaid on brain sagittal and transverse MRI templates; and (B) affected areas overlaid on brain coronal MRI templates (color bar represents t-value height, cutoff threshold T = 2.4). See Supplementary Table 2 for stereotaxic coordinates. (C) Post-hoc analysis for the same statistically significant increases in [18F]FDG uptake in the thalamus (**P = 0.002; Mann-Whitney test), hypothalamus (**, P = 0.001; Mann-Whitney test) and the cerebellum (*P = 0.02; Mann-Whitney test) as well as [11C]PBR28 uptake in the thalamus (**P = 0.006; Mann-Whitney test), hypothalamus (**P = 0.002; Mann-Whitney test) and the cerebellum (***P = 0.0002; Mann-Whitney test) in control and APAP mice. (For one vehicle treated mouse and three APAP treated mice only [11C]PBR28 (and no [18F]FDG) image acquisition was achieved and used in the analysis at 48h)
Figure 8.
Figure 8.. Brain regions with individual [11C]PBR28 and [18F]FDG uptake increases at 48h during AL
Cumulative [18F]FDG uptake increases (statistically significant clusters at P < 0.01) in the in the thalamus, the hippocampus, the hypothalamus, the caudate-putamen and the cerebellum as: (A) 3D shapes overlaid on brain sagittal and transverse MRI templates; and (B) affected areas overlaid on brain coronal MRI templates (color bar represents t-value height, cutoff threshold T = 2.4). See Table 2 for specific stereotaxic coordinates. Statistically significant clusters (P < 0.01; color bar represents t-value height, cutoff threshold T = 2.4) overlaid onto MRI template for visualization. (C) Post-hoc analysis of [18F]FDG tracer uptake in the hippocampus (**P = 0.001; Mann-Whitney test), hypothalamus (**P = 0.001; Mann-Whitney test), thalamus (**P = 0.008; Mann-Whitney test), cerebellum (*P =0.01; Mann-Whitney test) and the caudate-putamen (**P = 0.006; Mann-Whitney test). (D) 3D shapes of cumulative increased in [11C]PBR28 uptake (P < 0.01) the thalamus, the hypothalamus, the hippocampus, the caudate-putamen, and the cerebellum in APAP administered vs control mice. (E) cumulative increased in [11C]PBR28 uptake (P < 0.01) on brain coronal MRI brain templates (color bar represents t-value height, cutoff threshold T = 2.4). See Supplementary Table 2 for stereotaxic coordinates. (F) Post-hoc analysis of [11C]PBR28 uptake in the hypothalamus (**P = 0.003; Mann-Whitney test), thalamus (*P = 0.036; Mann-Whitney test), hippocampus (*P = 0.03; Mann-Whitney test), caudate-putamen (*P = 0.01; Mann-Whitney test) and the cerebellum (***P = 0.0002; Mann-Whitney test).
Figure 9.
Figure 9.. Brain regions with decreased overlapping [11C]PBR28 and [18F]FDG uptake at 48h during ALI.
Cumulative dual tracer uptake decreases (statistically significant clusters at P < 0.01) in the primary somatosensory cortex in APAP administered vs control mice as: (A) 3D shapes overlaid on sagittal and transverse MRI templates; and (B) affected areas overlaid on coronal MRI templates (color bar represents t-value height, cutoff threshold T = 2.4) (C) Post-hoc analysis of [18F]FDG (**P = 0.005; Mann-Whitney test) and [11C]PBR28 (***P = 0.0009; Mann-Whitney test) decreases in the primary somatosensory cortex of the same groups of mice.

Similar articles

References

    1. Schiodt FV, Atillasoy E, Shakil AO, Schiff ER, Caldwell C, Kowdley KV, et al. Etiology and outcome for 295 patients with acute liver failure in the United States. Liver transplantation and surgery : official publication of the American Association for the Study of Liver Diseases and the International Liver Transplantation Society. 1999;5(1):29–34. - PubMed
    1. Ostapowicz G, Fontana RJ, Schiodt FV, Larson A, Davern TJ, Han SH, et al. Results of a prospective study of acute liver failure at 17 tertiary care centers in the United States. Annals of internal medicine. 2002;137(12):947–54. - PubMed
    1. Russo MW, Galanko JA, Shrestha R, Fried MW, Watkins P. Liver transplantation for acute liver failure from drug induced liver injury in the United States. Liver transplantation : official publication of the American Association for the Study of Liver Diseases and the International Liver Transplantation Society. 2004;10(8):1018–23. - PubMed
    1. Stravitz RT, Lee WM. Acute liver failure. The Lancet. 2019;394(10201):869–81. - PMC - PubMed
    1. Reuben A, Tillman H, Fontana RJ, Davern T, McGuire B, Stravitz RT, et al. Outcomes in Adults With Acute Liver Failure Between 1998 and 2013: An Observational Cohort Study. Annals of internal medicine. 2016;164(11):724–32. - PMC - PubMed

Publication types

LinkOut - more resources