[Preprint]. 2024 Sep 4:2024.09.03.610959.
doi: 10.1101/2024.09.03.610959.

Sex-specific differences in brain activity dynamics of youth with a family history of substance use disorder

Affiliations

Sex-specific differences in brain activity dynamics of youth with a family history of substance use disorder

Louisa Schilling et al. bioRxiv. .

Abstract

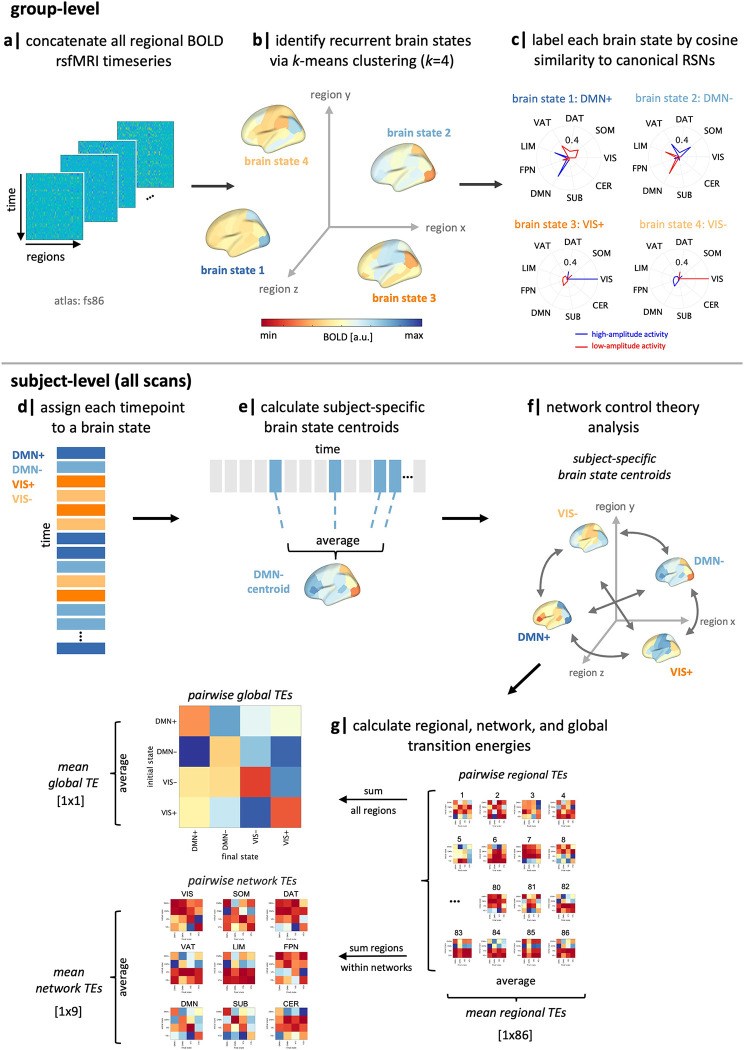
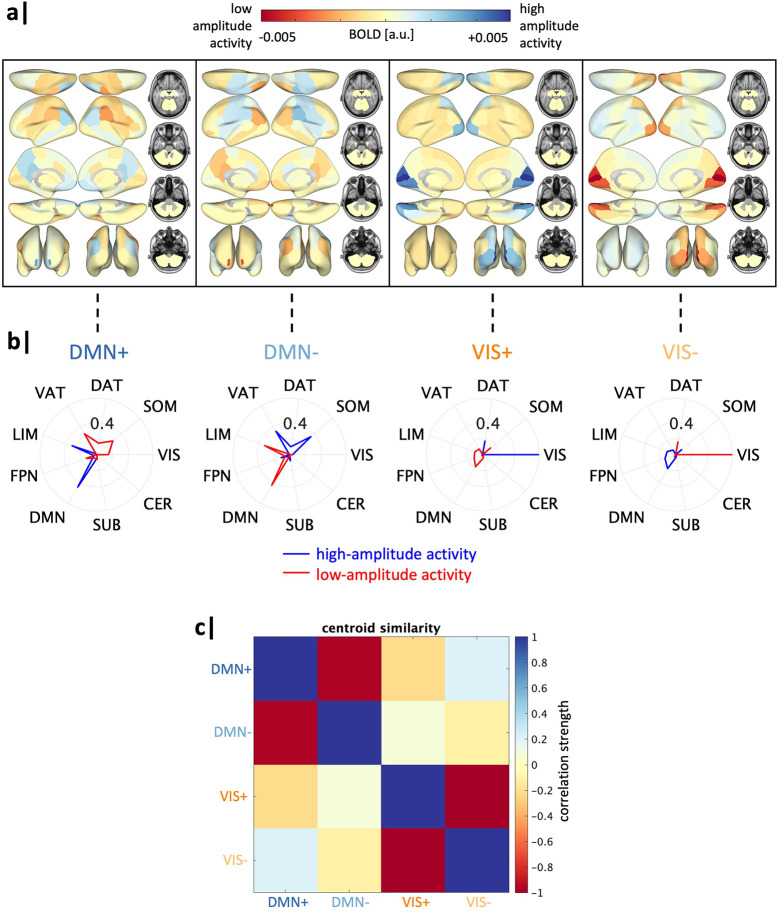
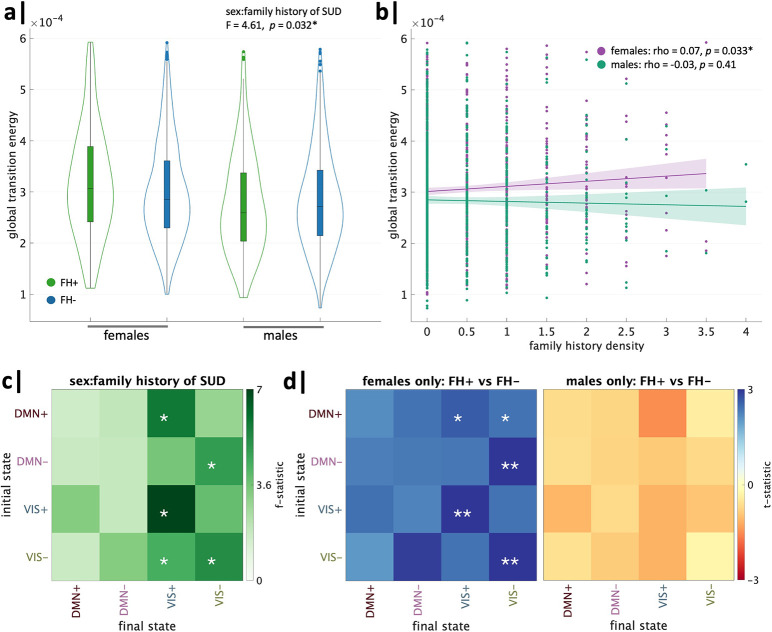
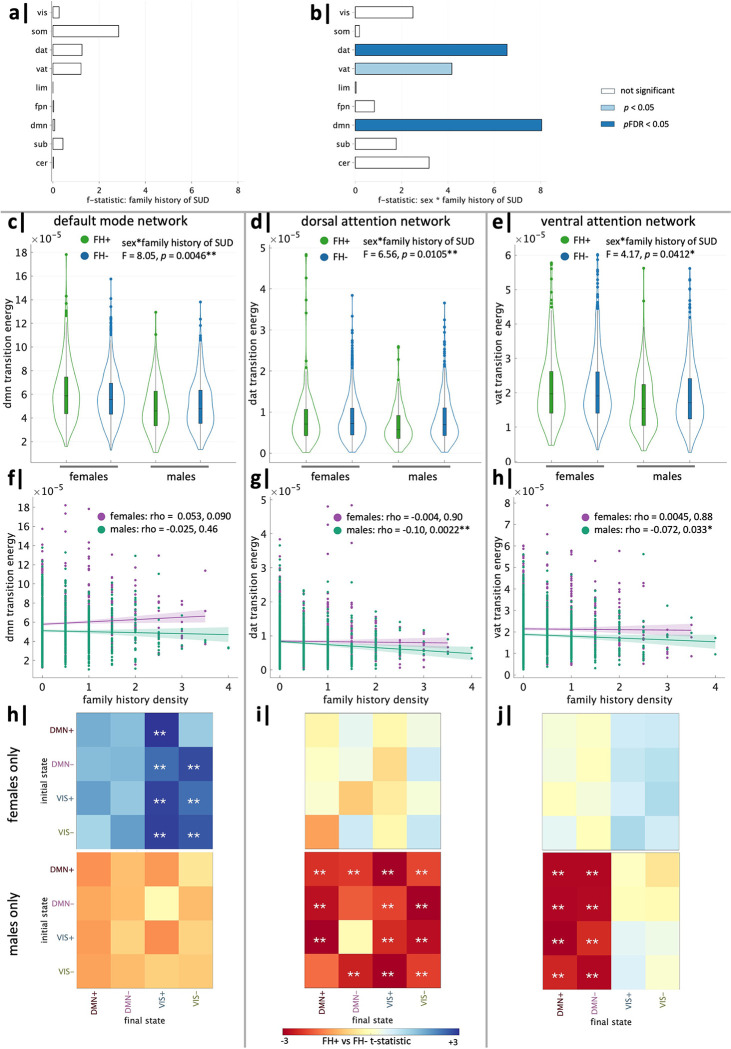
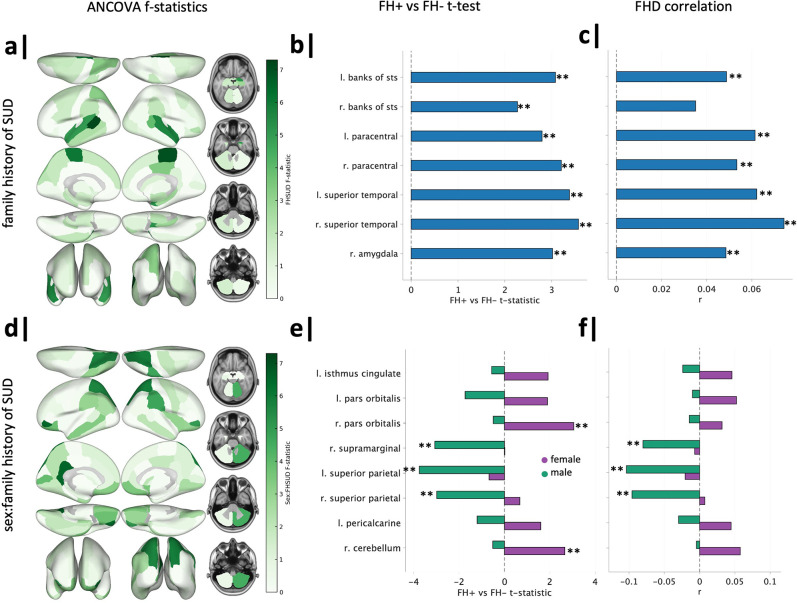
An individual's risk of substance use disorder (SUD) is shaped by a complex interplay of potent biosocial factors. Current neurodevelopmental models posit vulnerability to SUD in youth is due to an overreactive reward system and reduced inhibitory control. Having a family history of SUD is a particularly strong risk factor, yet few studies have explored its impact on brain function and structure prior to substance exposure. Herein, we utilized a network control theory approach to quantify sex-specific differences in brain activity dynamics in youth with and without a family history of SUD, drawn from a large cohort of substance-naïve youth from the Adolescent Brain Cognitive Development Study. We summarize brain dynamics by calculating transition energy, which probes the ease with which a whole brain, region or network drives the brain towards a specific spatial pattern of activation (i.e., brain state). Our findings reveal that a family history of SUD is associated with alterations in the brain's dynamics wherein: i) independent of sex, certain regions' transition energies are higher in those with a family history of SUD and ii) there exist sex-specific differences in SUD family history groups at multiple levels of transition energy (global, network, and regional). Family history-by-sex effects reveal that energetic demand is increased in females with a family history of SUD and decreased in males with a family history of SUD, compared to their same-sex counterparts with no SUD family history. Specifically, we localize these effects to higher energetic demands of the default mode network in females with a family history of SUD and lower energetic demands of attention networks in males with a family history of SUD. These results suggest a family history of SUD may increase reward saliency in males and decrease efficiency of top-down inhibitory control in females. This work could be used to inform personalized intervention strategies that may target differing cognitive mechanisms that predispose individuals to the development of SUD.

Keywords: adolescence; brain activity dynamics; family history; network control theory; neuroimaging; sex differences; substance use disorder.


Figures

Figure 1.
Figure 1.
Workflow. (a-b) We applied k-means clustering to regional rsfMRI time series of all subjects to identify four recurring “brain states”. (c) We calculated the cosine similarity of high and low amplitude activity with the Yeo 7-networks (59) plus subcortical and cerebellar networks and named each state by taking the maximum of those values. (d-e) For each subject, individual time frames in the fMRI scan were assigned to a brain state, and subject-specific brain state centroids were calculated. (f) Network control theory was then implemented using a group-average structural connectome to calculate the transition energy (TE) required for transitioning between pairs of subject-specific brain states. (g) Pairwise and mean TE values were computed at global, network, and regional levels for every individual in the dataset. SUB = subcortical structures, CER = cerebellar structures, VIS = visual network, SOM = somatomotor network, DAT = dorsal attention network, VAT = ventral attention network, LIM = limbic network, FPN = frontoparietal network, DMN = default mode network, RSN = resting-state network, TE = transition energy.
Figure 2.
Figure 2.. Global transition energy differences in family history of SUD vary by sex.
Four recurrent states of brain activity (brain states) identified via k-means clustering across all subjects. Group-average centroids are used for all illustrations. (a) Mean BOLD activation of each brain state plotted on the brain’s surface. a.u. = arbitrary units. (b) Cosine similarity with canonical resting-state networks (59) was calculated for the positive (high-amplitude) and negative (low-amplitude) components of each brain state’s group-average centroid separately. Each brain state is assigned the label of the network with the maximal cosine similarity value, with a sign indicating the maximal similarity was determined using high amplitude activity (+) or low amplitude activity (−). (c) Pearson correlation values between each pair of brain states. a.u. = arbitrary units, SUB = subcortical structures, CER = cerebellar structures, VIS = visual network, SOM = somatomotor network, DAT = dorsal attention network, VAT = ventral attention network, LIM = limbic network, FPN = frontoparietal network, DMN = default mode network.
Figure 3.
Figure 3.
Global transition energy differences in family history of SUD vary by sex. Analysis of global transition energy revealed a significant effect of family history of SUD by sex, wherein (a) FH+ females > FH− females and FH+ males < FH− males, (b) family history density had a trend toward a weak positive correlation with global TE in females and no correlation in males. (c) Whole brain TE between pairs of states revealed the interaction between family history of SUD and sex was driven by transitions to/from visual network states. (d) Post-hoc t-tests revealed FH+ females had higher TE than FH− females across all transitions, particularly in persistence of visual network states, and FH+ males had lower TE than FH− males across all transitions (none significant). *significant before and **significant after correcting for the 16 (4×4) comparisons.
Figure 4.
Figure 4.. Network-level transition energy differences in family history of SUD vary by sex.
ANCOVA analysis of mean network transition energy revealed (a) no significant effects of family history of SUD and (b) significant effects of family history of SUD by sex in the default mode (DMN), dorsal attention (DAT) and ventral attention (VAT) networks. DMN: (c) The interaction effect was driven by FH+ females > FH− females. (f) Family history density trended toward a weak positive correlation with DMN network TE in females but not in males. (h) FH+ females > FH− females in pairwise DMN network TE in transitions to VIS+/− brain states. DAT: (d) The interaction effect was driven by FH+ males < FH− males. (g) Family history density had a significant negative correlation with DAT network TE in males but not females. (i) FH+ males < FH− males in pairwise DAT network TE across almost all transitions. VAT: (e) The interaction effect was driven by FH+ males < FH− males. (h) Family history density had a significant negative correlation with VAT network TE in males but not females. (j) FH+ males < FH− males in pairwise VAT network TE to DMN+/− brain states. *significant before and **significant after correction.
Figure 5.
Figure 5.. Regional transition energy differences in family history of SUD and family history of SUD by sex.
(a) ANCOVA of mean regional TE revealed significant effects of family history of SUD on seven regions, though they did not survive correction. (b) FH+ vs FH− t-tests revealed significant (post-correction across t tests of seven regions) FH+ > FH− across all seven regions. (c) Family history density had significant mild positive correlations with regional TE of all seven regions, except the right bank of STS. (d) ANCOVA of mean regional TE revealed significant effects of family history of SUD by sex in eight regions, though they did not survive correction. (e) Within-sex t-tests revealed FH+ females > FH− females in the right pars orbitalis and right cerebellum and FH+ males < FH− males in bilateral superior parietal lobules and right supramarginal gyrus (significant post-correction across t tests of eight regions). (f) Family history density had significant but weak negative correlations with regional TE of bilateral superior parietal lobules and right supramarginal in males. *significant before and **significant after correction.

Similar articles

References

    1. Substance Abuse and Mental Health Services Administration. Key substance use and mental health indicators in the United States: Results from the 2021 National Survey on Drug Use and Health (HHS Publication No. PEP22-07-01-005, NSDUH Series H-57). Center for Behavioral Health Statistics and Quality, Substance Abuse and Mental Health Services Administration. (2022).
    1. Nestler E. J. & Lüscher C. The Molecular Basis of Drug Addiction: Linking Epigenetic to Synaptic and Circuit Mechanisms. Neuron 102, 48–59, DOI: 10.1016/j.neuron.2019.01.016 (2019). - DOI - PMC - PubMed
    1. Hatoum A. S. et al. Multivariate genome-wide association meta-analysis of over 1 million subjects identifies loci underlying multiple substance use disorders. Nat. mental health 1, 210–223, DOI: 10.1038/s44220-023-00034-y (2023). - DOI - PMC - PubMed
    1. Whitesell M., Bachand A., Peel J. & Brown M. Familial, Social, and Individual Factors Contributing to Risk for Adolescent Substance Use. J. Addict. 2013, e579310, DOI: 10.1155/2013/579310 (2013). Publisher: Hindawi. - DOI - PMC - PubMed
    1. Squeglia L. M. & Cservenka A. Adolescence and Drug Use Vulnerability: Findings from Neuroimaging. Curr. opinion behavioral sciences 13, 164–170, DOI: 10.1016/j.cobeha.2016.12.005 (2017). - DOI - PMC - PubMed

Publication types

LinkOut - more resources