[Preprint]. 2024 Sep 6:2024.09.05.611389.
doi: 10.1101/2024.09.05.611389.

Interhemispheric CA1 projections support spatial cognition and are affected in a mouse model of the 22q11.2 deletion syndrome

Affiliations

Interhemispheric CA1 projections support spatial cognition and are affected in a mouse model of the 22q11.2 deletion syndrome

Noelia S de León Reyes et al. bioRxiv. .

Abstract

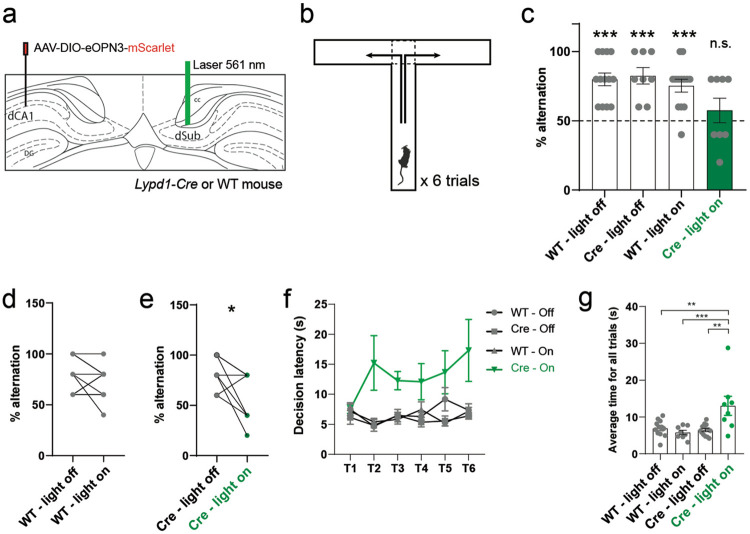
Untangling the hippocampus connectivity is critical for understanding the mechanisms supporting learning and memory. However, the function of interhemispheric connections between hippocampal formations is still poorly understood. So far, two major hippocampal commissural projections have been characterized in rodents. Mossy cells from the hilus of the dentate gyrus project to the inner molecular layer of the contralateral dentate gyrus and CA3 and CA2 pyramidal neuron axonal collaterals to contralateral CA3, CA2 and CA1. In contrary, little is known about commissural projection from the CA1 region. Here, we show that CA1 pyramidal neurons from the dorsal hippocampus project to contralateral dorsal CA1 as well as dorsal subiculum. We further demonstrate that the interhemispheric projection from CA1 to dorsal subiculum supports spatial memory and spatial working memory in WT mice, two cognitive functions impaired in male mice from the Df16(A) +/- model of 22q11.2 deletion syndrome (22q11.2DS) associated with schizophrenia. Investigation of the CA1 interhemispheric projections in Df16(A) +/- mice revealed that these projections are disrupted with male mutants showing stronger anatomical defects compared to females. Overall, our results characterize a novel interhemispheric projection from dCA1 to dorsal subiculum and suggest that dysregulation of this projection may contribute to the cognitive deficits associated with the 22q11.2DS.


Figures

Figure 1.
Figure 1.. dCA1 pyramidal neurons project to contralateral dorsal CA1 and subiculum.
a. Lypd1-Cre mice injected in dCA1 with AAV2/DJ hSyn.FLEX.mGFP.2A.Synatophysin-mRuby. b-c. Coronal section labelled for GFP and mRuby. d-e. Number and percentage of GFP+ cells in deep and superficial layers of dCA1. Each point corresponds to one observation (4 mice, 3 sections per mouse). f-n. Coronal hippocampal sections showing GFP+ cells in anterior (f), medial (i) and posterior ipsilateral dCA1 (l) and GFP+ fibers and mRuby+ pre-synaptic terminals in contralateral dCA1 and dSUB. For the entire figure, bar graphs represent mean ± SEM. Scale bars: 1mm (b), 300 μm (f,g,i,j,l,m) and 100 μm (c,h,k,n). (alv.): alveus, (s.o): stratum oriens and (s.r.): stratum radiatum.
Figure 2.
Figure 2.. dCA1 projection to contralateral subiculum is necessary for spatial memory.
a. Lypd1-Cre or WT mice from both sexes injected in the right dCA1 with AAV2/1 hSyn1-DIO-eOPN3-mScarlet-WPRE and implanted with an optic fiber above the left dSUB to silence dCA1 to dSUB interhemispheric terminals. b. Schematic of the object location test of spatial memory. c. Time of interaction with the object located in the familiar or novel position. d. Discrimination index for the novel vs. familiar location. e. Paired discrimination index for the novel location versus familiar in each WT mouse with and without light. f. Paired discrimination index for the novel versus familiar location in each Lypd1-Cre mouse with and without light. g. Total distance traveled during test trial. h. Total interaction time with objects during T4. i. Distance traveled during learning trials (T1-T3). j. Total interaction time with the object during learning trials (T1-T3). For the entire figure: bar graphs represent mean ± SEM and each point represents one mouse (13 WT and 8 Lypd1-Cre mice).
Figure 3:
Figure 3:. dCA1 projection to contralateral subiculum is necessary for spatial working memory.
a. Lypd1-Cre or WT mice from both sexes injected in the right dCA1 with AAV2/1 hSyn1-DIO-eOPN3-mScarlet-WPRE and implanted with an optic fiber above the left dSUB to silence dCA1 to dSUB interhemispheric terminals. b. Schematic of the spontaneous alternation T-maze test for spatial working memory. c. Percentage of alternations in each group during the 6 consecutive trials. Each point corresponds to one mouse (13 WT and 8 Lypd1-Cre mice). d. Paired percentage of alternations in each WT mouse with or without light. e. Paired percentage of alternations in each Lypd1-Cre mouse with or without light. f. Decision latency (time spent before entering one arm) in each trial. g. Average decision time for all trials (T1-T6) in each group.
Figure 4.
Figure 4.. Spatial cognition of male and female Df16(A)+/− mice is differentially impaired.
a. Df16(A)+/− or WT female and male mice were tested. b. Schematic of Object location test of spatial memory. c. Discrimination index for the novel vs. familiar location. In (c-e) each point represents one mouse (13 WT males, 11 Df16(A)+/− males, 16 WT females and 14 Df16(A)+/− females). d. Total distance traveled during test trial. e. Total interaction time with objects during the entire test. f. Distance traveled during learning trials (T1-T3). g. Total interaction time with the object during learning trials (T1-T3). h. Schematic of the T-maze test of spontaneous alternation for spatial working memory. i. Percentage of alternations in each group during the 6 consecutive trials. In (i-k), each point corresponds to one mouse (13 WT males, 11 Df16(A)+/− males, 12 WT females, and 10 Df16(A)+/− females). j. Decision latency (time spent before entering one arm) in each trial. k. Average decision latency for all trials. For the entire figure, bar graphs represent mean ± SEM.
Figure 5.
Figure 5.. dCA1 projections to contralateral dCA1 are dysregulated in Df16(A)+/− mice.
a. Injection of CtB-488 in the right dCA1 of Df16(A)+/− mice and littermates. b. Coronal section showing injection site and diffusion of CtB-488 in the right dCA1. c. Representative images of CtB+ cells in distal, intermediate and proximal contralateral dCA1 (left CA1) from Df16(A)+/− male mice and littermates. d. Number of CtB+ cells in distal, intermediate and proximal contralateral dCA1. Each point corresponds to one observation (5 WT and 4 Df16(A)+/− mice, 3 observations per mouse). e. Representative images of CtB+ cells in distal, intermediate and proximal contralateral dCA1 from WT and Df16(A)+/− female mice. f. Number of CtB+ cells in distal, intermediate and proximal contralateral dCA1 from WT and Df16(A)+/− male mice. Each point corresponds to one observation (8 WT and 6 Df16(A)+/− mice, 3 observations per mouse). For the entire figure, bar graphs represent mean ± SEM. Scale bars: 500 μm (b) and 50 μm (c,e).
Figure 6:
Figure 6:. dCA1 interhemispheric projections into contralateral dSUB are dysregulated in Df16(A)+/− mice.
a. WT and Df16(A)+/− mice injected with CtB-488 in the right dSUB. b. Coronal section showing injection site and diffusion of CtB-488. c. Representative images of CtB+ cells in distal, intermediate and proximal contralateral dCA1 of WT and Df16(A)+/− male mice. d. Number of CtB+ cells. Each point represents one observation (5 WT and 4Df16(A)+/− mice, 3 observations per mouse). e. Representative images of CtB+ cells in distal, intermediate and proximal contralateral dCA1 of WT and Df16(A)+/− female mice. f. Number of CtB+ cells. Each point represents one observation (4 WT and 4 Df16(A)+/− mice, 3 observations per mouse). For the entire figure, bar graphs represent mean ± SEM. Scale bars: 500 μm (b) and 50 μm (c,e).

References

    1. Hinkley L.B.N., Marco E.J., Findlay A.M., Honma S., Jeremy R.J., Strominger Z., Bukshpun P., Wakahiro M., Brown W.S., Paul L.K., et al. (2012). The role of corpus callosum development in functional connectivity and cognitive processing. PLoS One 7. 10.1371/JOURNAL.PONE.0039804. - DOI - PMC - PubMed
    1. Seoane L.F. (2023). Optimality Pressures toward Lateralization of Complex Brain Functions. Phys Rev X 13, 031028. 10.1103/PHYSREVX.13.031028/FIGURES/11/MEDIUM. - DOI
    1. Butler A.B., and Hodos W. (2005). Comparative Vertebrate Neuroanatomy: Evolution and Adaptation: Second Edition. Comparative Vertebrate Neuroanatomy: Evolution and Adaptation: Second Edition, 1–715. 10.1002/0471733849. - DOI
    1. Marlin B.J., Mitre M., D’Amour J.A., Chao M. V., and Froemke R.C. (2015). Oxytocin enables maternal behaviour by balancing cortical inhibition. Nature 520, 499–504. 10.1038/nature14402. - DOI - PMC - PubMed
    1. Halpern M.E., Güntürkün O., Hopkins W.D., and Rogers L.J. (2005). Lateralization of the Vertebrate Brain: Taking the Side of Model Systems. The Journal of Neuroscience 25, 10351. 10.1523/JNEUROSCI.3439-05.2005. - DOI - PMC - PubMed

Publication types

LinkOut - more resources