[Preprint]. 2024 Oct 17:2024.09.07.611010.
doi: 10.1101/2024.09.07.611010.

Antigen specificity of clonally-enriched CD8+ T cells in multiple sclerosis

Affiliations

Antigen specificity of clonally-enriched CD8+ T cells in multiple sclerosis

Kristen Mittl et al. bioRxiv. .

Abstract

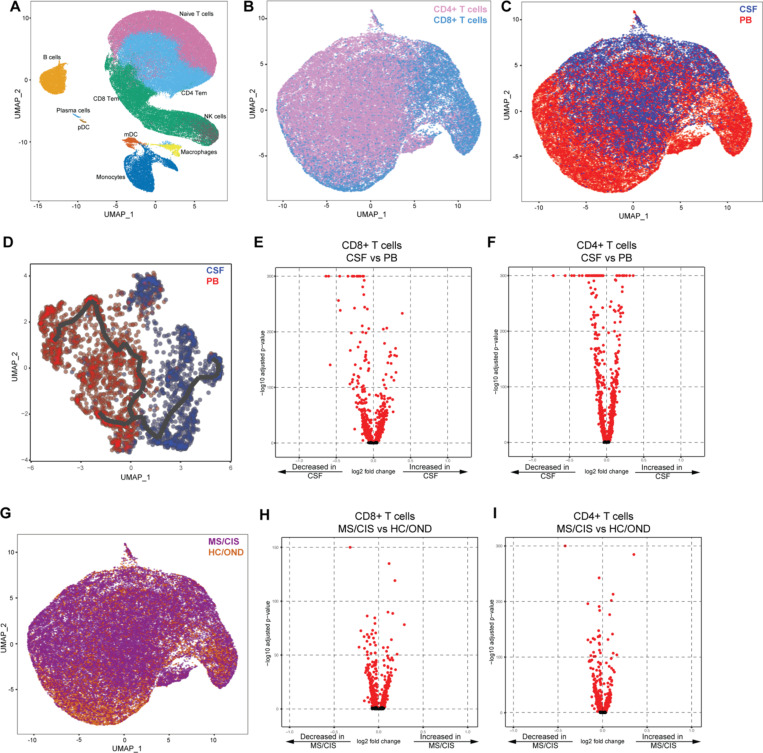
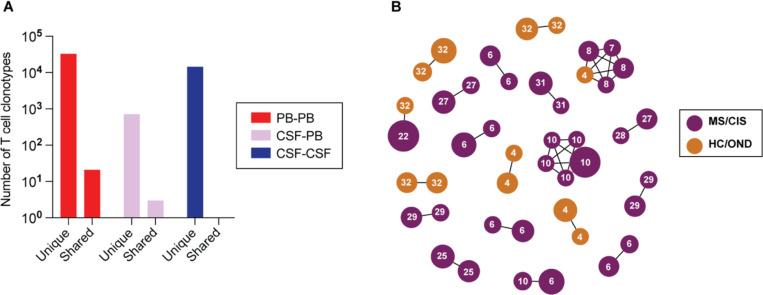
CD8+ T cells are the dominant lymphocyte population in multiple sclerosis (MS) lesions where they are highly clonally expanded. The clonal identity, function, and antigen specificity of CD8+ T cells in MS are not well understood. Here we report a comprehensive single-cell RNA-seq and T cell receptor (TCR)-seq analysis of the cerebrospinal fluid (CSF) and blood from a cohort of treatment-naïve MS patients and control participants. A small subset of highly expanded and activated CD8+ T cells were enriched in the CSF in MS that displayed high activation, cytotoxicity and tissue-homing transcriptional profiles. Using a combination of unbiased and targeted antigen discovery approaches, MS-derived CD8+ T cell clonotypes recognizing Epstein-Barr virus (EBV) antigens and multiple novel mimotopes were identified. These findings shed vital insight into the role of CD8+ T cells in MS and pave the way towards disease biomarkers and therapeutic targets.


Figures

Fig. 1.
Fig. 1.. T cell single cell sequencing analysis in blood and CSF.
Major immune cell subsets from combined blood and CSF of all patients were identified by scRNA-seq (A). T cells were defined after integration of scRNA-seq and scTCR-seq data, allowing segregation of T cells by CD4/CD8 status (B), compartment (CSF) (C), and disease status (G). Pseudotime trajectory analysis of CSF and PB is shown in D. Volcano plot analysis of differential gene expression between the CSF and PB for CD8+ T cells (E) and CD4+ T cells (F) and between MS/CIS and HC/OND for CD8+ T cells (H) and CD4+ T cells (I). Genes with adjusted p-values < 0.05 are indicated in red. Abbreviations: PB = peripheral blood; CSF = cerebrospinal fluid; MS = multiple sclerosis; CIS = clinically isolated syndrome; HC = healthy control; OND = other neuroinflammatory disorder.
Fig. 2.
Fig. 2.. T cell clonal expansion in CSF.
CD8+ and CD4+ T cell clonal expansion was compared between MS/CIS and HC/OND subjects (A). Non-expanded are T cell clonotypes that were present at singletons, moderately expanded clonotypes were more than one but less than 0.75% of the CSF repertoire and highly expanded T cell clonotypes comprised at least 0.75% of the CSF repertoire in a given individual. Clonal frequency of all T cell clonotypes in the CSF and blood that were highly expanded T cells and enriched at least 2-fold more frequently than the blood of the same individual are highlighted in red (B). The frequencies of highly expanded and enriched T cells is shown for CD8/CD4 status (C) and disease status (D). Volcano plot analysis of differential gene expression between highly expanded and non-expanded T cells in the CSF where genes with adjusted p-values < 0.05 are indicated in red (E). Unbiased clustering of all CSF T cells (F) overlaid with highly expanded/enriched T cells (G).
Fig. 3.
Fig. 3.. T cell clonal relationships.
The number of unique or shared clonotypes between different compartments across different individuals is shown (A). GLIPH2 analysis of highly expanded and enriched T cell clonotypes in the CSF compared to all other CSF T cell clonotypes (B). Clonal size is indicated by node size and clonally related populations are connected by lines. The number in each clonotype refers to the subject ID.
Fig. 4.
Fig. 4.. Antigen discovery of highly expanded CSF-enriched CD8+ T cells.
Individual TCRαβ pairs were cloned into plasmids and expressed in primary human CD8+ T cells by non-viral CRISPR knockin. Candidate antigens for testing specificity were identified in three parallel strategies and were screened by pMHC tetramer binding and validated by cytokine production to cognate antigen (A). Candidate antigens for four TCRs identified by pMHC yeast display (unbiased antigen discovery) were tested for tetramer binding and cytokine reactivity (B). Each peptide was tested a minimum of two times using T cells from different donors for all tetramer and cytokine experiments.
Fig. 5.
Fig. 5.. EBV specificity of highly expanded CSF-enriched CD8+ T cells.
Representative flow cytometry analysis of tetramer binding (A) and cytokine production (B) for three MS patient TCRs with predicted reactivity to four different viral epitopes. Summary of tetramer binding and cytokine reactivity of each TCR (C) where cytokine reactivity reflects subtracted background from no stimulation control. FLRGRAYGL is EBV EBNA3A193–201 restricted by HLA-B*08:01, EPLPQGQLTAY is EBV BZLF154–64 restricted by HLA-B*35:01, and VTEHDTLLY is CMV pp50245–253 restricted by HLA-A*01:01. The frequencies and degree of enrichment of the two EBV-specific clonotypes relative to all other highly enriched and expanded T cell clonotypes is shown (D). Summary of functional reactivity of Jurkat cells expressing the indicated TCR specific for EBV EBNA3A193–201:B*08:01 (E) or EBV BZLF154–64:B*35:01 (F) to the indicated peptides. Responses reflect frequency of CD69/mCherry double-positive cells with no stimulation background control subtracted. Amino acid differences between cognate EBV peptides (left-most of each plot) and self-peptide homologs are indicated in red. Each peptide was tested in a minimum of two independent experiments.

References

    1. Baecher-Allan C., Kaskow B. J. & Weiner H. L. Multiple Sclerosis: Mechanisms and Immunotherapy. Neuron 97, 742–768 (2018). - PubMed
    1. Gay F. W., Drye T. J., Dick G. W. & Esiri M. M. The application of multifactorial cluster analysis in the staging of plaques in early multiple sclerosis. Identification and characterization of the primary demyelinating lesion. Brain 120, 1461–1483 (1997). - PubMed
    1. Machado-Santos J. et al. The compartmentalized inflammatory response in the multiple sclerosis brain is composed of tissue-resident CD8+ T lymphocytes and B cells. Brain 141, 2066–2082 (2018). - PMC - PubMed
    1. van Nierop G. P. et al. Phenotypic and functional characterization of T cells in white matter lesions of multiple sclerosis patients. Acta Neuropathologica 134, 383–401 (2017). - PMC - PubMed
    1. Babbe H. et al. Clonal expansions of CD8(+) T cells dominate the T cell infiltrate in active multiple sclerosis lesions as shown by micromanipulation and single cell polymerase chain reaction. The Journal of experimental medicine 192, 393–404 (2000). - PMC - PubMed

Publication types