[Preprint]. 2024 Sep 5:2024.09.04.611137.
doi: 10.1101/2024.09.04.611137.

Brain-wide circuitry underlying altered auditory habituation in zebrafish models of autism

Affiliations

Brain-wide circuitry underlying altered auditory habituation in zebrafish models of autism

Maya Wilde et al. bioRxiv. .

Abstract

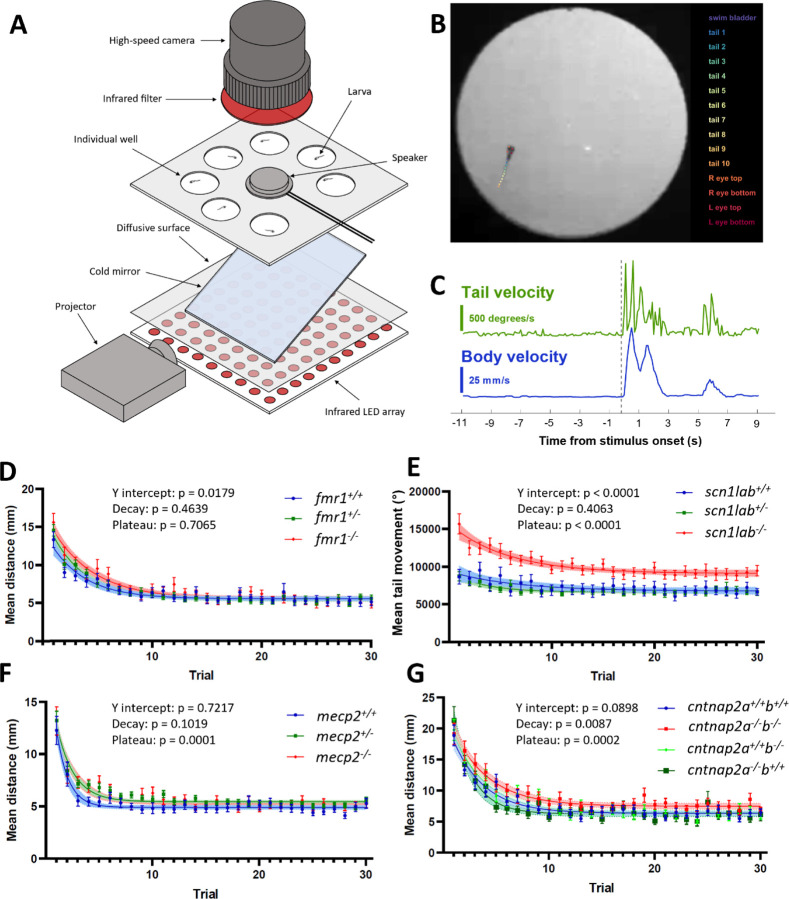
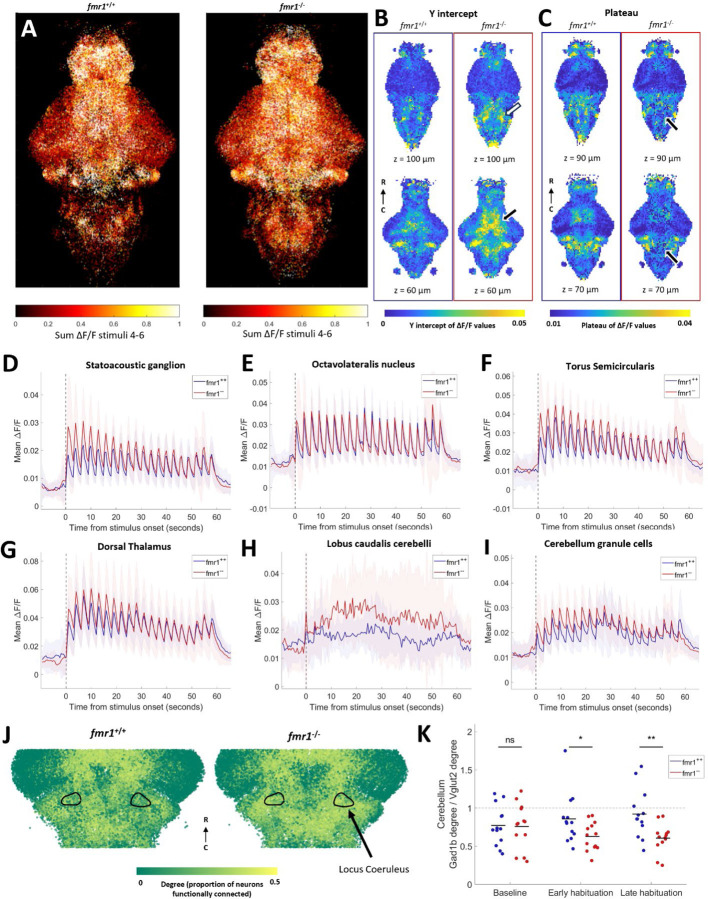
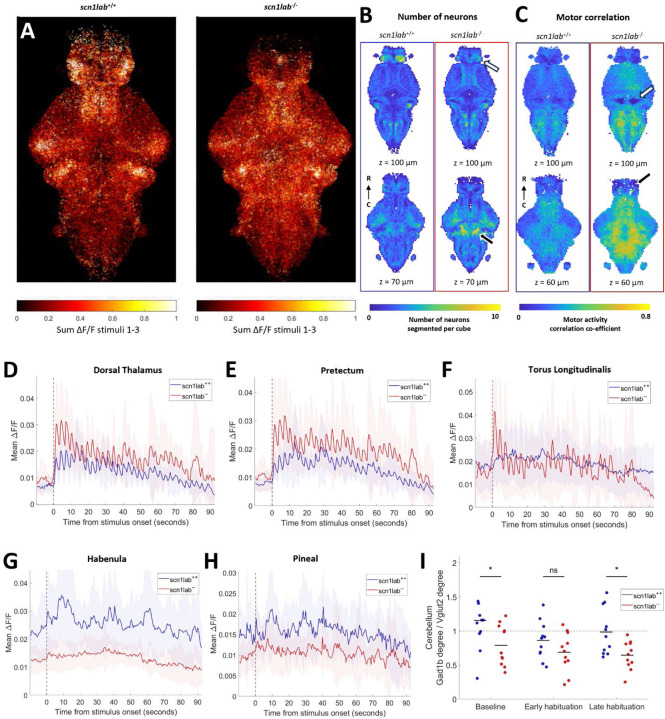
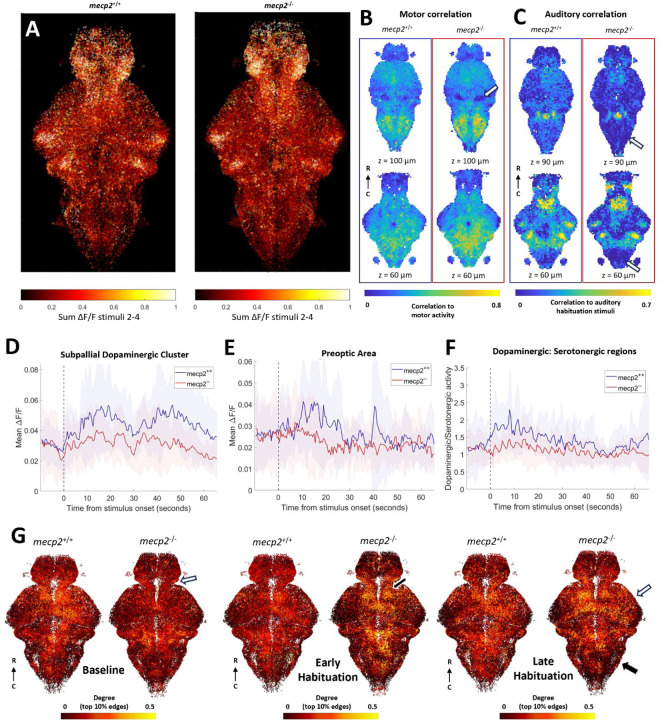
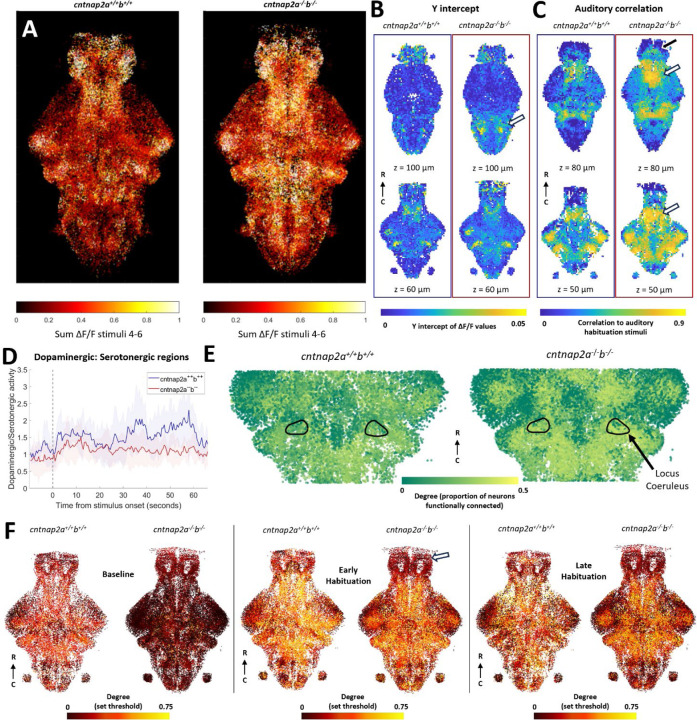
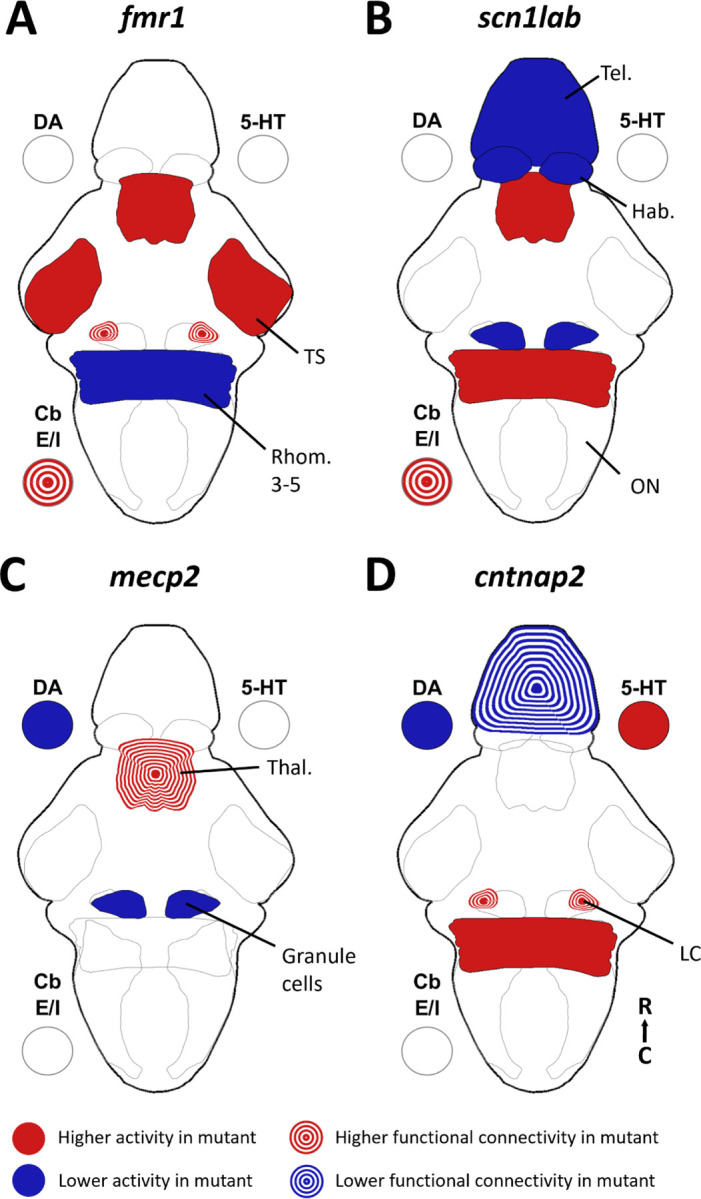
Auditory processing is widely understood to occur differently in autism, though the patterns of brain activity underlying these differences are not well understood. The diversity of autism also means brain-wide networks may change in various ways to produce similar behavioral outputs. We used larval zebrafish to investigate auditory habituation in four genetic lines relevant to autism: fmr1, mecp2, scn1lab and cntnap2. In free-swimming behavioral tests, we found each line had a unique profile of auditory hypersensitivity and/or delayed habituation. Combining the optical transparency of larval zebrafish with genetically encoded calcium indicators and light-sheet microscopy, we then observed brain-wide activity at cellular resolution during auditory habituation. As with behavior, each line showed unique alterations in brain-wide spontaneous activity, auditory processing, and adaptation in response to repetitive acoustic stimuli. We also observed commonalities in activity across our genetic lines that indicate shared circuit changes underlying certain aspects of their behavioral phenotypes. These were predominantly in regions involved in sensory integration and sensorimotor gating rather than primary auditory areas. Overlapping phenotypes include differences in the activity and functional connectivity of the telencephalon, thalamus, dopaminergic regions, and the locus coeruleus, and excitatory/inhibitory imbalance in the cerebellum. Unique phenotypes include loss of activity in the habenula in scn1lab, increased activity in auditory regions in fmr1, and differences in network activity over time in mecp2 and cntnap2. Comparing these distinct but overlapping brain-wide auditory networks furthers our understanding of how diverse genetic factors can produce similar behavioral effects through a range of circuit- and network-scale mechanisms.


Figures

Figure 1:
Figure 1:
Behavioral auditory habituation phenotypes in four genetic lines. A) Experimental set-up for recording behavior of seven larvae simultaneously. B) Tracking with DeepLabCut43. Automated identification of points in the swim bladder, eyes, and along the tail enables kinematic analysis of behavioral responses. C) Example outputs of tail velocity (green) and whole-body velocity (blue) in response to an auditory stimulus, indicated by the dotted line. D-G) Behavioral responses during habituation for fmr1, scn1lab, mecp2, and cntnap2, respectively. Responses are calculated for a 1-second window after the stimulus. For each group, the p-value is indicated for y-intercept (Y0), slope, and plateau, comparing fish carrying the mutation to wild-type siblings.
Figure 2:
Figure 2:
Auditory habituation phenotypes in fmr1. A) All segmented neurons from all fish, colored by sum of activity between stimuli 4 and 6. B-C) Comparison within 10 µm cubes of curve fit values during habituation period. Two different z-depths for each measure are shown for fmr1+/+ (left, n = 12) and fmr1−/− (right, n = 13). B) Y-intercept values are higher in the fmr1−/− fish, notably in the thalamus (white arrow) and hindbrain (black arrow). C) Plateau values are lower in fmr1−/− fish than wild types in several parts of the hindbrain (black arrows). D-I) Mean activity of all neurons in the SAG (D), ON (E), TS (F) dorsal thalamus (G) lobus caudalis cerebelli (H), and the granule cell region of the cerebellum (I). D-I: Shading indicates SD. J) A subset of ROIs, colored by degree, identified using the top 10% of edges from correlation during the whole habituation period. Black outlines indicate the locus coeruleus. K) Ratio between the degree of all neurons in gad1b and vglut2 regions of the cerebellum at different periods during habituation. Degree is based on the top 10% of edges. Each dot represents one fish, and black lines indicate the means. Significant effect of genotype (p = 0.0289) and interaction between genotype and time (p = 0.0401), but no significant effect of time alone (p = 0.9167, repeated measures ANOVA). No difference between genotypes at baseline (p = 0.9063), but significantly lower gad1b:vglut2 ratio in fmr1−/− in the early (p = 0.0380) and late (p = 0.0050) habituation periods (Dunn-Sidak test).
Figure 3:
Figure 3:
Auditory habituation phenotype in scn1lab. A) All segmented neurons from all fish, colored by sum of activity between stimuli 1 and 3. B) Comparison within 10 µm cubes of number of neurons segmented. Two different z-depths for each measure are shown for scn1lab+/+ (left, n = 11) and scn1lab−/− (right, n = 11). Fewer neurons were segmented in the habenula (white arrow), and more in the cerebellum (black arrow) in scn1lab−/− fish than wild types. C) Comparison within 10 µm cubes of motor correlation values. Motor correlation is higher in most of the brain in scn1lab−/− fish, except for the granule cells of the cerebellum (white arrow) and the telencephalon (black arrow). D-H) Mean activity of all neurons in the dorsal thalamus (D), pretectum (E), torus longitudinalis (F), habenula (G) and pineal (H). D-H: Shading indicates SD. I) Ratio between the degree of all neurons in the gad1b region of the cerebellum and the vglut2 region of the cerebellum at different periods during habituation. Degree is based on the top 10% of edges design. Each dot represents one fish, black lines indicate the means. Significant effect of genotype (p = 0.0078), non-significant effect of time (p = 0.0567) and interaction between genotype and time (p = 0.4682, repeated measures ANOVA). The ratio is significantly lower in scn1lab−/− fish at baseline (p = 0.0437) and in the late habituation period (p = 0.0102), but not different in the early habituation period (p = 0.1629, Dunn-Sidak test).
Figure 4:
Figure 4:
Auditory habituation phenotype in mecp2. A) All segmented neurons from all fish, colored by the sum of fluorescent activity between stimuli 2 and 4. B) Comparison within 10 µm cubes of motor correlation values. Two different z-depths for each measure are shown for mecp2+/+ (left, n = 10) and mecp2−/− (right, n = 13). Motor correlations are not different in most of the brain in mecp2−/− fish, except for the granule cells of the cerebellum (white arrow). C) Auditory correlation during the habituation period is decreased in mecp2−/− fish in the inferior olive and the posterior hindbrain (white arrows). Mean activity of all neurons in the subpallial dopaminergic cluster (D)and the preoptic area (E). F) Mean ratio between activity in dopaminergic regions and serotonergic regions. D-F: Shading indicates SD. G) All neurons from all fish in a region of interest in the z-dimension. Each neuron colored by its degree as defined by the top 10% of edges during the baseline, early habituation, and late habituation periods. Differences in degree between mecp2−/− and wild-type fish are indicated in the diencephalon at baseline (white arrow), the dorsal thalamus (black arrow) during early habituation, and in the rhombencephalon (black arrow) and the mesencephalon (white arrow) during late habituation.
Figure 5:
Figure 5:
Auditory habituation phenotype in cntnap2. A) All segmented neurons from all fish, colored by the sum of fluorescent activity between stimuli 4 and 6. B) Voxel-based representations of curve fits during habituation period. Two different z-depths for each measure are shown for cntnap2a+/+b+/+ (left, n = 5) and cntnap2a−/−b−/− (right, n = 7). Y-intercepts are higher in cntnap2a−/−b−/− fish than wild types in the pineal and most of the rhombencephalon (white arrow). C) Voxel-based auditory correlation values during the habituation period. Auditory correlation is not different in most of the brain in cntnap2a−/−b−/− fish, except for the subpallium (black arrow), preoptic area (white arrows), and pineal. D) Mean ratio of activity in dopaminergic regions versus serotonergic regions. Shading indicates SD. E) Sub-selection of neurons, colored by degree, as determined using the top 10% of edges from correlation during the whole habituation period. Black outlines indicate the locus coeruleus. F) All neurons from all fish in a section of interest between 50–75 µm depth in the z-dimension. Each neuron is colored by its degree as defined by a set correlation threshold during the baseline, early habituation, and late habituation periods. At baseline, neurons have lower degree throughout the brain in the cntnap2a−/−b−/− fish compared to wild types. In the early habituation period, only the telencephalon has lower degree cntnap2a−/−b−/− fish compared to wild types (white arrow).
Figure 6:
Figure 6:
Summary of brain activity underlying auditory habituation phenotypes. A summary of the brain-wide phenotypes for activity and functional connectivity found in fmr1 (A), scn1lab (B), mecp2 (C), and cntnap2 (D). 5-HT = serotonin, DA =dopamine, Cb E/I = cerebellum excitatory/inhibitory regions, Hab = habenula, LC = locus coeruleus, ON = octavolateralis nucleus, Rhomb. = rhombomere, Tel. = telencephalon, Thal = thalamus, TS = torus semicircularis.

References

    1. Marco E.J., Hinkley L.B.N., Hill S.S., and Nagarajan S.S. (2011). Sensory processing in autism: A review of neurophysiologic findings. Pediatric Research CS, 48R. 10.1203/PDR.0b013e3182130c54. - DOI - PMC - PubMed
    1. Crane L., Goddard L., and Pring L. (2009). Sensory processing in adults with autism spectrum disorders. Autism 13, 215–228. 10.1177/1362361309103794. - DOI - PubMed
    1. Simpson K., Adams D., Alston-Knox C., Heussler H.S., and Keen D. (2019). Exploring the Sensory Profiles of Children on the Autism Spectrum Using the Short Sensory Profile-2 (SSP-2). Journal of Autism and Developmental Disorders 4S, 2069–2079. 10.1007/s10803-019-03889-2. - DOI - PubMed
    1. Tomchek S.D., and Dunn W. (2007). Sensory processing in children with and without autism: a comparative study using the short sensory profile. American Journal of Occupational Therapy C1, 190–200. 10.5014/ajot.61.2.190. - DOI - PubMed
    1. Mansour Y., Burchell A., and Kulesza R.J. (2021). Central Auditory and Vestibular Dysfunction Are Key Features of Autism Spectrum Disorder. Frontiers in Integrative Neuroscience 15, 32. 10.3389/FNINT.2021.743561/BIBTEX. - DOI - PMC - PubMed

Publication types