[Preprint]. 2025 Sep 8:2024.09.04.611262.
doi: 10.1101/2024.09.04.611262.

Enhancer activation from transposable elements in extrachromosomal DNA

Affiliations

Enhancer activation from transposable elements in extrachromosomal DNA

Katerina Kraft et al. bioRxiv. .

Update in

  • Enhancer activation from transposable elements in extrachromosomal DNA.
    Kraft K, Murphy SE, Jones MG, Shi Q, Bhargava-Shah A, Luong C, Hung KL, He BJ, Li R, Park SK, Montgomery MT, Weiser NE, Wang Y, Luebeck J, Bafna V, Boeke JD, Mischel PS, Boettiger AN, Chang HY. Kraft K, et al. Nat Cell Biol. 2025 Nov;27(11):1914-1924. doi: 10.1038/s41556-025-01788-6. Epub 2025 Oct 21. Nat Cell Biol. 2025. PMID: 41120733 Free PMC article.

Abstract

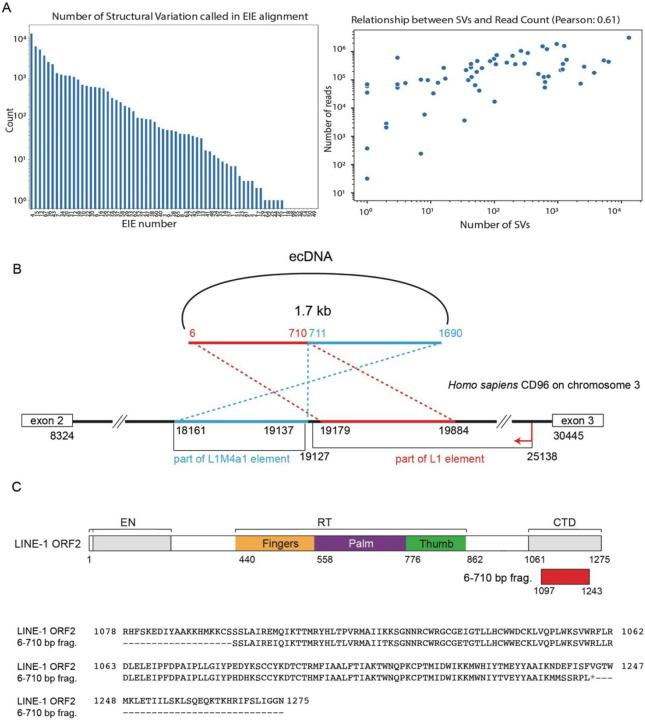
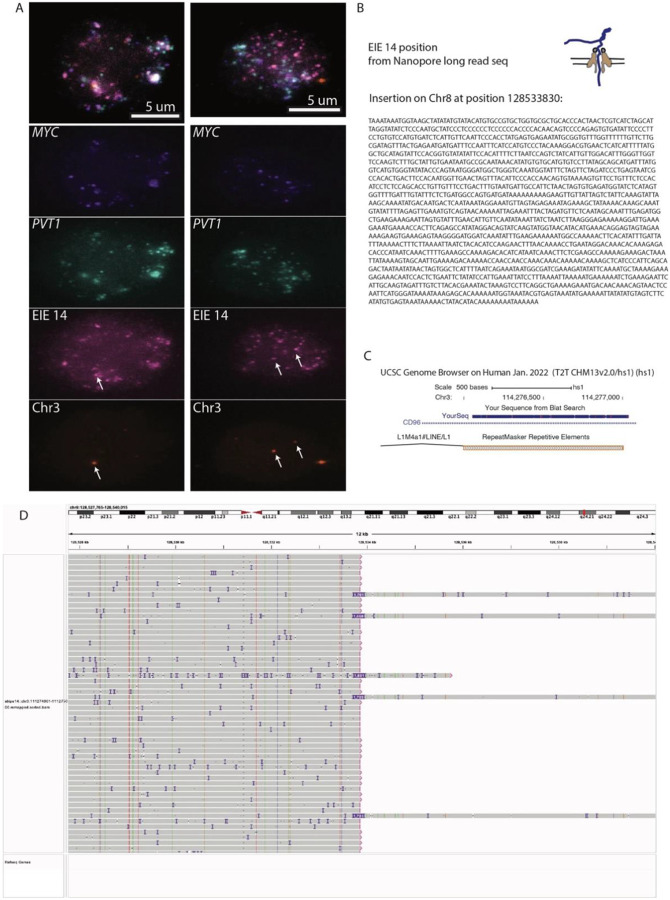
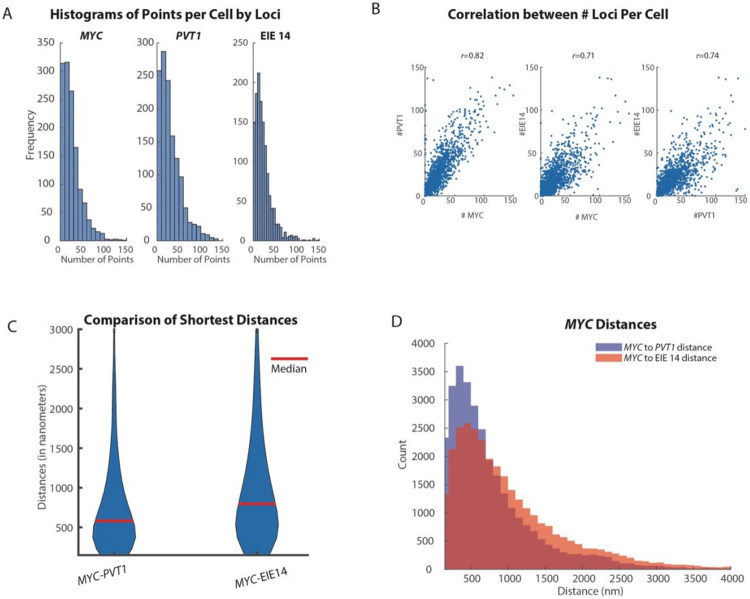
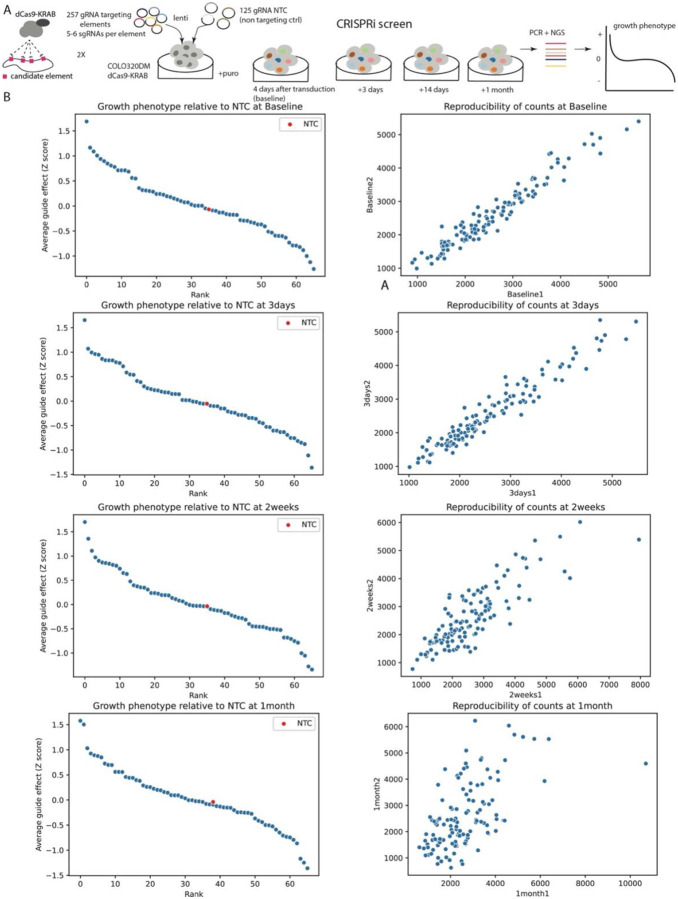
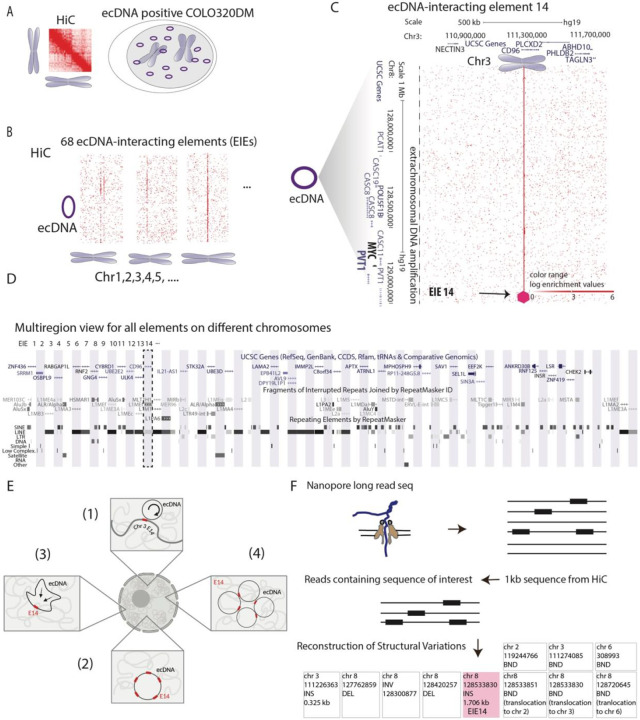
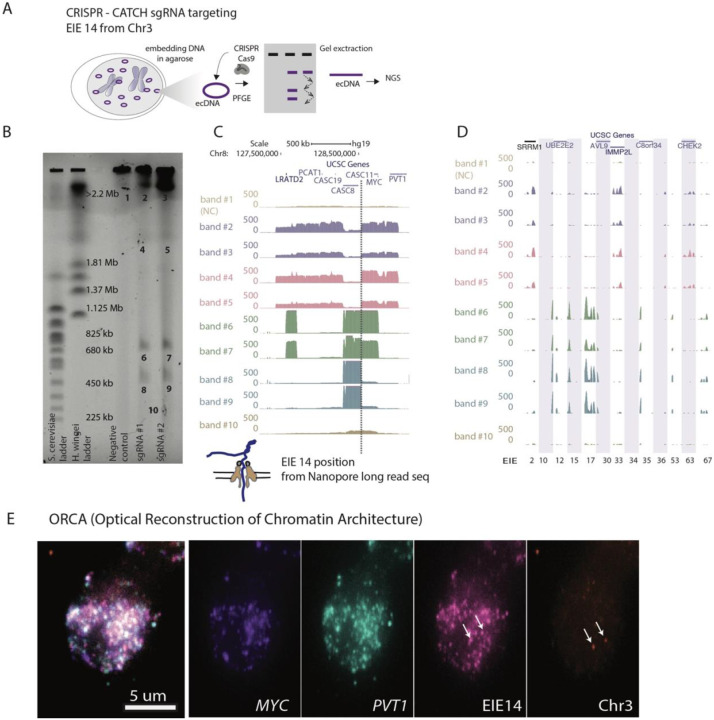
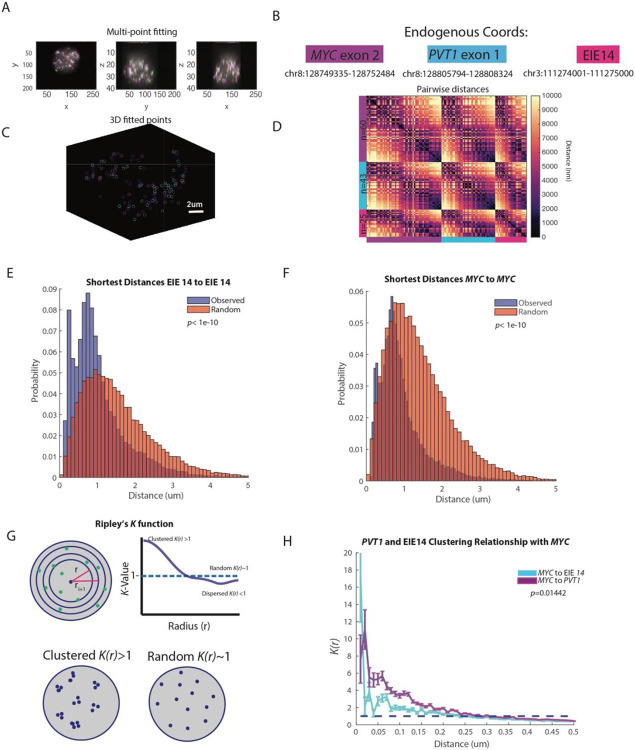
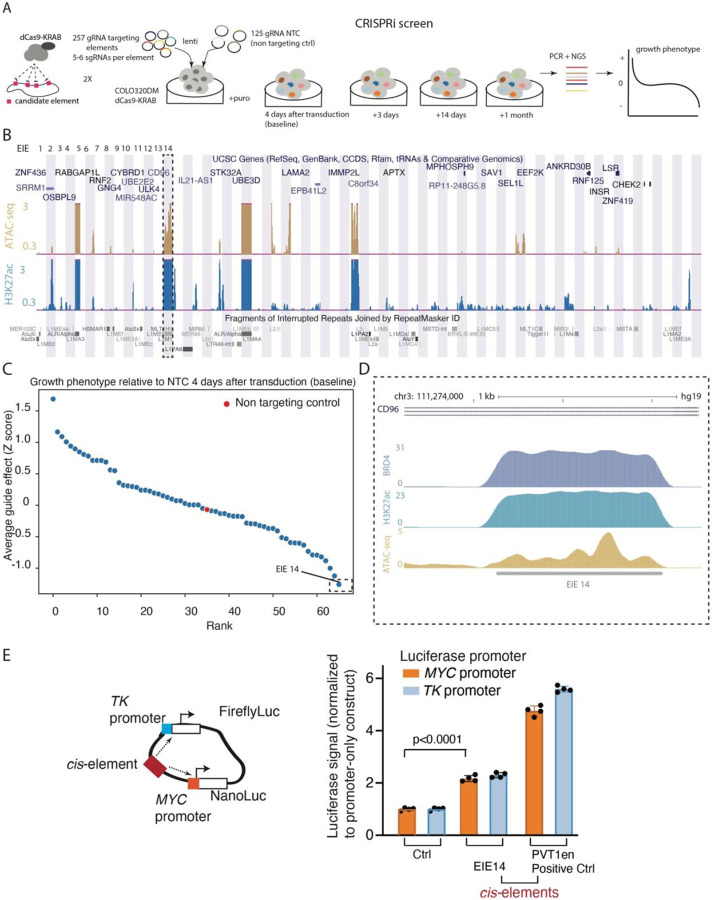
Extrachromosomal DNA (ecDNA) drives oncogene amplification and intratumoral heterogeneity in aggressive cancers. While transposable element (TE) reactivation is common in cancer, its role on ecDNA remains unexplored. Here, we map the 3D architecture of MYC-amplified ecDNA in colorectal cancer cells and identify 68 ecDNA-interacting elements (EIEs)-genomic loci enriched for TEs that are frequently integrated onto ecDNA. We focus on an L1M4a1#LINE/L1 fragment co-amplified with MYC, which functions only in the ecDNA amplified context. Using CRISPR-CATCH, CRISPR interference, and reporter assays, we confirm its presence on ecDNA, enhancer activity, and essentiality for cancer cell fitness. These findings reveal that repetitive elements can be reactivated and co-opted as functional rather than inactive sequences on ecDNA, potentially driving oncogene expression and tumor evolution. Our study uncovers a mechanism by which ecDNA harnesses repetitive elements to shape cancer phenotypes, with implications for diagnosis and therapy.


Conflict of interest statement

Competing Interests H.Y.C. is a cofounder of Accent Therapeutics, Boundless Bio, Cartography Biosciences and Orbital Therapeutics; he was an advisor of 10x Genomics, Arsenal Biosciences, Chroma Medicine and Spring Discovery until 15 December 2024. H.Y.C. is an employee and stockholder of Amgen as of 16 December 2024. M.G.J. is a consultant and holds equity in Tahoe Therapeutics. P.S.M. is a co-founder and advisor of Boundless Bio. J.D.B. is a founder and director of CDI Labs, Inc.; a founder of and consultant to Opentrons LabWorks/Neochromosome, Inc.; and serves or served on the scientific advisory boards of the following: CZ Biohub New York, LLC; Logomix, Inc.; Modern Meadow, Inc.; Rome Therapeutics, Inc.; Sangamo, Inc.; Tessera Therapeutics, Inc.; and the Wyss Institute. V.B. is a cofounder, serves on the scientific advisory board of Boundless Bio and Abterra and holds equity in both companies. Q.S. is an employee and stockholder of Amgen as of 20 February 2025. The remaining authors declare no competing interests.

Figures

Extended Data Fig. 1:
A. The graph (left) demonstrates the number of structural variations called in stripe alignments. Relationship between structural variations and read count for each element (right). Pearson correlation is 0.61. B. Schematics of ecDNA harboring 1.7 kb sequence obtained from long-read analysis of EIE 14. The region spanning 6-710 bp shows alignments with 3’ end of the LINE-1 element, whereas the region from 711-1690 bp is notably unique to intron 2 of the CD96 locus on chromosome 3. C. Top panel, alignment of predicted protein from 6-710 bp with LINE-1 ORF2. Bottom panel, amino acids alignment of LINE-1 ORF2 and 6-710 bp coding protein by clustalW. Google doc
Extended Data Fig. 2:
A. ORCA (Optical Reconstruction of Chromatin Architecture) visualization of the COLO320DM cell nucleus. The images show the spatial arrangement of the MYC oncogene, Element 14 and the PVT1 locus, labeled in different colors. The scale bar represents 5 micrometers. Chr3 probe maps to the breakpoints of the EIE 14 origin inside CD96 intron. B. EIE 14 position and structural variant “insertion” on Chr8 between CASC8 and CASC11, full sequence is listed in the methods part for the luciferase enhancer assay. The full SV list is in Supplementary Tables T4 and T5. C. Sequence alignment of the T2T genome. D. Screenshot of the IGV viewer with selected long reads depicting insertion sizes in purple.
Extended Data Fig. 3:
A. Quantification of copy number of MYC, PVT1 and EIE 14 across all measured cells (n=1329). Mean copy number of MYC is 29 copies per cell, PVT1 is 31 copies per cell and EIE 14 is 22 copies per cell. Copies for all species ranged from 0 to 150 copies. B. Correlation plots between the loci per cell. Pearson’s correlation coefficient calculated for PVT1-MYC r=0.82, EIE 14-MYC r=0.71, EIE 14-PVT1 r=0.74. C. Violin plots of shortest distances of MYC to PVT1 and EIE 14 (median distance denoted by red line). Red line denotes median distance. C. Histogram of shortest distances of MYC to PVT1 (blue) and MYC to EIE 14 (orange) (Wilcoxon two-sided ranksum p=1.23e^-05).
Extended Data Fig. 4:
A. Schematic of the CRISPRi screening strategy used to evaluate the regulatory potential of 257 genomic elements near the MYC oncogene in COLO320DM cells. For each element, 5-6 sgRNAs were designed and 125 non-targeting control sgRNAs. The screen involved the transduction of cells with a lentivirus expressing dCas9-KRAB and the sgRNAs, followed by calculation of cell growth phenotype over a series of time points (4 days (baseline), 3 days, 14 days, and 1 month). B. The growth phenotype of COLO320DM cells and reproducibility of counts between two biological replicates at different timepoints. Each point represents the average guide effect (Z-score)
Extended Data Fig. 5:
Zoom-in on EIE14 in UCSC genome browser. From top to down:ENCODE Histone modifications, H3K9me3 in red and H3K27ac in green ChIP-Seq Signal and called Peaks. H3K27ac modification is absent in all cell lines in ENCODE,, GRO-Seq COLO320DM cell line plus strand and minus strand, H3K27ac in COLO320DM.
Extended Data Fig. 6:
Comparison in chromatin accessibility between COLO320DM (top) and SNU16 (bottom) ATAC-seq signal displayed in UCSC browser.
Figure 1:
Figure 1:. Identification of ecDNA interacting elements (EIEs)
A. Hi-C analysis in COLO320DM cell line: method schematics B. Identification of 68 ecDNA-interacting elements (EIEs). The visualization represents the ecDNA from Chromosome 8 with lines indicating the interactions with ecDNA-interacting elements (EIEs) localized on other chromosomes. C. An example of a specific interaction, EIE 14 on Chromosome 3, is enlarged and associated genes are shown for both loci. Arrow and purple hexagon indicate EIE. D. UCSC Genome Browser multiregion view snapshot showing the genomic context of the EIEs. Each element on different chromosomes is indicated by a vertical bar, with EIE 14 highlighted. The browser displays the annotations for genes and repetitive elements such as Alu, LINE, and LTR elements (RepeatMasker). Detailed mapping of each EIE is in Supplementary Table T2, T3 E. Hypothetical models for interaction between ecDNA and elements: (1) the ecDNA is interacting with the endogenous EIE making frequent contacts with the endogenous sequence (2) multiple copies of the EIE integrate at multiple locations on the ecDNA becoming extra-chromosomally amplified; (3) a single copy of the element integrates in the ecDNA at a specific site, but the ecDNA is folded in a way that allows extensive contact within the ecDNA molecule; or (4) whether a copy of the EIE inserts into the ecDNA, and clustering of multiple ecDNA copies enables the extensive contact. F. Schematic representation of the Nanopore long-read sequencing methodology used to identify structural variations associated with the 1 kb EIEs. Reads containing the sequence of interest were extracted, aligned, and analyzed for structural variation. Reconstruction of Structural Variations is shown for EIE 14.
Figure 2:
Figure 2:. CRISPR-CATCH Elucidates ecDNA Composition and EIE Insertions
A. Schematic diagram illustrating the CRISPR-CATCH experiment designed to isolate and characterize ecDNA components. The process involves the use of guide RNA targeting the EIE 14 from Chromosome 3. DNA is embedded in agarose, followed by pulse-field gel electrophoresis (PFGE), allowing for the band extraction and subsequent next-generation sequencing (NGS) of ecDNA fragments. B. PFGE gel image displays the separation of DNA fragment, lines from left ladder, ladder, empty lane, Negative control, sgRNA #1, sgRNA #2 and band numbers for NGS. The EIE 14 targeted by the guide RNAs leads to cutting of the ecDNA's chromosome 8 sequences to form multiple discrete bands. sgRNA #1 ATATAGGACAGTATCAAGTA; sgRNA #2 TATATTATTAGTCTGCTGAA; Full EIE 14 sequences from long-read sequencing is in Supplementary Table T6. C. Visualization of the sequencing results confirms the presence of EIE 14, originally annotated on Chromosome 3, within the ecDNA, between the CASC8 and CASC11 genes, approximately 200 kilobases upstream from MYC. The dotted line indicates the position of this insertion. D. Additional EIEs identified in the initial Hi-C screen, captured, and sequenced in the CRISPR-CATCH, each EIE is one one vertical shaded box with coordinates. E. ORCA (Optical Reconstruction of Chromatin Architecture) visualization of the COLO320DM cell nucleus. The images show the spatial arrangement of the MYC oncogene, EIE 14 and the PVT1 locus, labeled in different colors. The scale bar represents 5 micrometers. Chr3 probe maps to the breakpoints of the EIE 14 origin inside CD96 intron.
Figure 3:
Figure 3:. EIE 14 spatially clusters with MYC
A. X, Y, Z projections of MYC exon (purple), PVT1 (blue), and EIE 14 (pink) B. Endogenous coordinates of all three measured genomic regions. C. Single cell projection of the 3D fitted points from (A). D. Pairwise distances between MYC (purple), PVT1 (blue), and EIE 14 (pink) of a single cell. Number of fitted points per genomic region n=60, n=43, and n=25 respectively. E. Histogram of distribution of distances of the observed shortest pairwise EIE 14 to EIE 14 distances and the expected shortest pairwise distances of points randomly simulated in a sphere (two-tailed Wilcoxon ranksum p<1e-10) of n=1329 analyzed cells. F. As in (E) but for MYC to MYC shortest pairwise distances (two-tailed Wilcoxon ranksum p<1e-10). G. Schematic of Ripley’s K function to describe clustering behaviors over different nucleus volumes. Top shows the nucleus divided into different shell intervals and how the K value is plotted for increasing radius (r). Bottom shows an example of what clustered K(r)>1 vs. random K(r)~1 points could look like. H. The average K(r) value across distance intervals of 0.01 to 0.5um in 0.02um step sizes to describe the clustering relationship of PVT1 and EIE 14 relative to MYC across different distance intervals (um). Error bars denote SEM. (Two-tailed Wilcoxon ranksum p=0.01442).
Figure 4:
Figure 4:. CRISPRi Screen Reveals EIE-Dependent Growth Phenotypes in COLO320DM Cells
A. Schematic of the CRISPRi screening strategy used to evaluate the regulatory potential of 257 genomic EIEs near the MYC oncogene in COLO320DM cells. For each EIE, 5-6 sgRNAs were designed and 125 non-targeting control sgRNAs. The screen involved the transduction of cells with a lentivirus expressing dCas9-KRAB and the sgRNAs, followed by calculation of cell growth phenotype over a series of time points (4 days, 3 days, 14 days, and 1 month). B. UCSC Genome Browser multi-region view showing the locations of the EIEs within the genome. Each EIE is indicated by a vertical bar. The browser displays the annotations for genes and repetitive elements such as Alu, LINE, and LTR elements (RepeatMasker), ATAC-seq and H3K27ac signal. C. The growth phenotype of COLO320DM cells 4 days post-transduction, relative to non-targeting control (NTC). Each point represents the average guide effect (Z-score) for sgRNAs targeting a specific EIE, ranked by their impact on cell growth. EIE 14 is indicated by dashed rectangle with negative Z-score < −1 (significant negative impact on cell viability). See Extended Data for additional timepoints. D. Zoom-in of EIE 14’s histone marks: enrichment of H3K27 acetylation, BRD4 binding, and ATAC-seq peaks. (H3K9me3 ChIP-seq is in Extended Data Fig. 5) E. Luciferase enhancer assay schematics and fold change in luciferase signal driven by either MYC or TK promoter normalized to promoter-only construct. 4 biological replicates. EIE 14 compared to positive control (PVT1 positive control from)

References

    1. Yi E., Chamorro Gonzalez R., Henssen A.G. & Verhaak R.G.W., Extrachromosomal DNA amplifications in cancer. Nat Rev Genet 23, 760–771 (2022). - PMC - PubMed
    1. Yan X., Mischel P. & Chang H. Extrachromosomal DNA in cancer. Nat Rev Cancer 24, 261–273 (2024). - PubMed
    1. Kim H. et al. Extrachromosomal DNA is associated with oncogene amplification and poor outcome across multiple cancers. Nat Genet 52, 891–897 (2020). - PMC - PubMed
    1. Wahl G.M. The importance of circular DNA in mammalian gene amplification. Cancer Res 49, 1333–40 (1989). - PubMed
    1. Benner S.E., Wahl G.M. & Von Hoff D.D. Double minute chromosomes and homogeneously staining regions in tumors taken directly from patients versus in human tumor cell lines. Anticancer Drugs 2, 11–25 (1991). - PubMed

Publication types

LinkOut - more resources