[Preprint]. 2024 Oct 31:2024.09.02.610794.
doi: 10.1101/2024.09.02.610794.

Dynamics of amylopectin granule accumulation during the course of the chronic Toxoplasma infection is linked to intra-cyst bradyzoite replication

Affiliations

Dynamics of amylopectin granule accumulation during the course of the chronic Toxoplasma infection is linked to intra-cyst bradyzoite replication

Aashutosh Tripathi et al. bioRxiv. .

Update in

Abstract

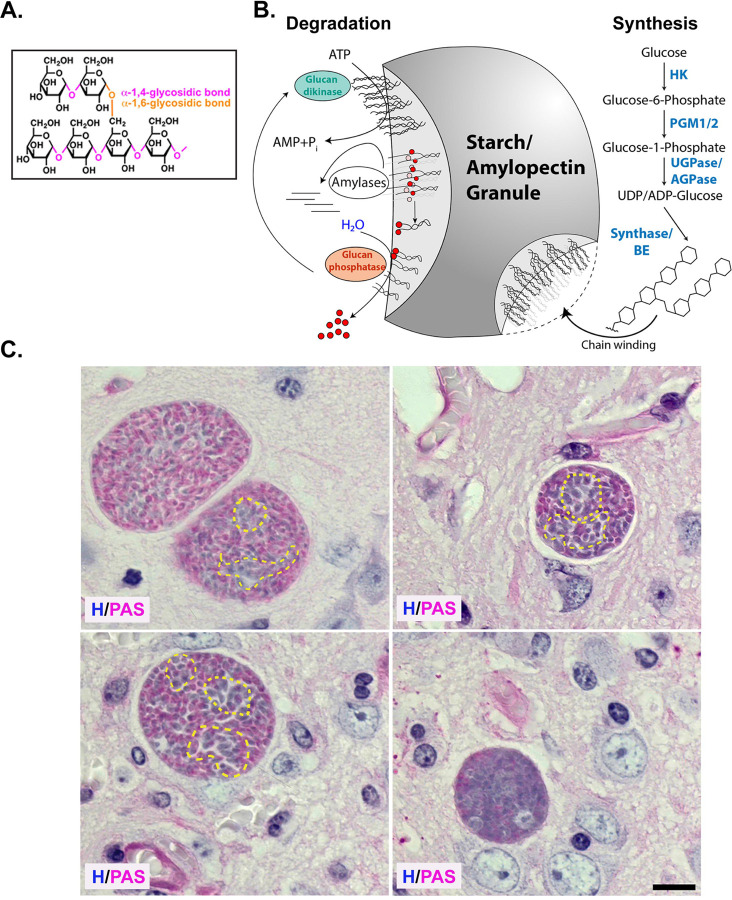
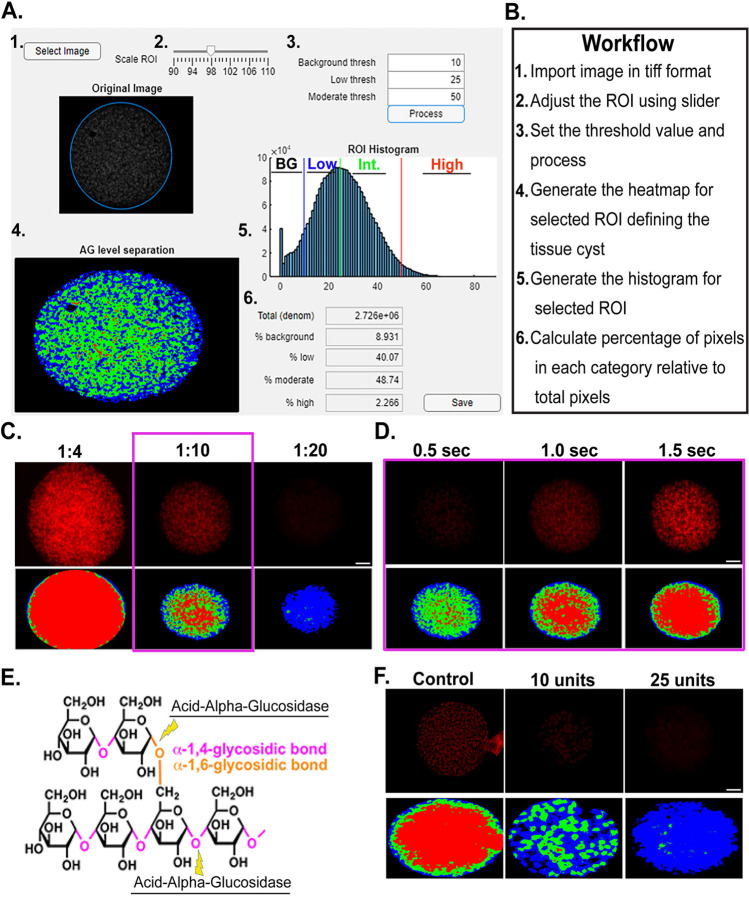
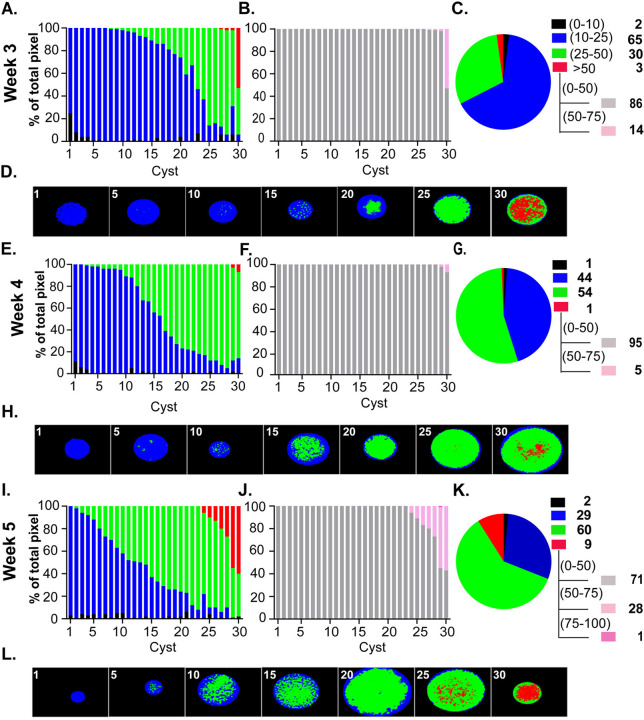
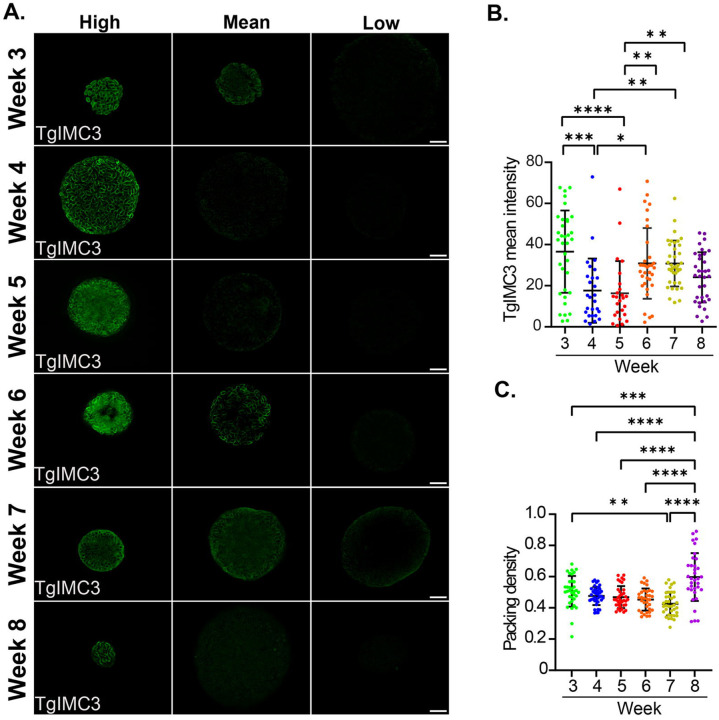
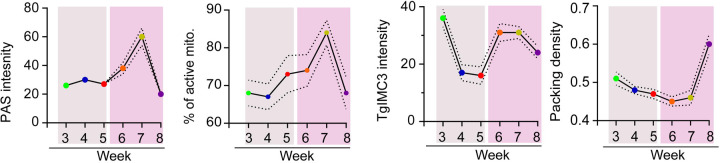
The contribution of amylopectin granules (AG), comprised of a branched chain storage homopolymer of glucose, to the maintenance and progression of the chronic Toxoplasma gondii infection has remained undefined. Here we describe the role of AG in the physiology of encysted bradyzoites by using a custom developed imaging-based application AmyloQuant that permitted quantification of relative levels of AG within in vivo derived tissue cysts during the initiation and maturation of the chronic infection. Our findings establish that AG are dynamic entities, exhibiting considerable heterogeneity among tissue cysts at all post infection time points examined. Quantification of relative AG levels within tissue cysts exposes a previously unrecognized temporal cycle defined by distinct phases of AG accumulation and utilization over the first 6 weeks of the chronic phase. This AG cycle is temporally coordinated with overall bradyzoite mitochondrial activity implicating amylopectin in the maintenance and progression of the chronic infection. In addition, the staging of AG accumulation and its rapid utilization within encysted bradyzoites was associated with a burst of coordinated replication. As such our findings suggest that AG levels within individual bradyzoites, and across bradyzoites within tissue cysts may represent a key component in the licensing of bradyzoite replication, intimately linking stored metabolic potential to the course of the chronic infection. This extends the impact of AG beyond the previously assigned role that focused exclusively on parasite transmission. These findings force a fundamental reassessment of the chronic Toxoplasma infection, highlighting the critical need to address the temporal progression of this crucial stage in the parasite life cycle.


Conflict of interest statement

Conflicts of Interest: None

Figures

Figure 1.
Figure 1.. Heterogenous distribution of amylopectin granules within encysted bradyzoites in vivo.
(A) Amylopectin is an α1,4-linked linear glucose polymer connected with α1,6 branched linkages. (B) Steady state levels of amylopectin in water insoluble stach/amylopectin granules (AG) are dictated by the balance between amylopectin synthesis and turnover. Enzymatic activities promoting synthesis include hexokinase (HK), phosphoglucomutases (PGM1/2), UDP-dependent glucose 1 phosphatase (UGPase/AGPase), the commitment step for starch synthesis, Starch/Glycogen synthase (Synthase) and Branching enzyme (BE). Upon synthesis branched amylopectin polymer chains wind expelling water to from the water insoluble starch/amylopectin granules. Degradation of amylopectin begins with the phosphorylation of the glucose moiety to unwind the amylopectin chain by a glucan kinase allowing access of amylase to the unwound starch molecule releasing glucose. Amylase activity is blocked at sites of glucan phosphorylation necessitating a glucan phosphatase to assure continued degradation. (C) PAS and hematoxylin-stained mouse brain histology showing encysted bradyzoites with variability in the distribution of amylopectin. Amylopectin within bradyzoites is evident with the pink stain. Variability of AG within the same cyst and across cysts is evident. Bradyzoite clusters with low levels of amylopectin within the cyst are encircled with a dashed yellow line. (Scale bar, 10μm).
Figure 2.
Figure 2.. Amylopectin levels are not defined by tissue cyst size.
(A) Tissue cysts were designated as small (<30μm diameter), medium sized (30–60μm diameter or large (>60μM diameter). Representative images of PAS intensity, defining low, mean and high ranges in cysts of each size class. PAS intensity is in grayscale values determined from the captured grayscale image. Scale bar = 10μm. (B) The relationship between cyst size and mean PAS intensity for 180 tissue cysts (30×6) acquired at random at 6 weekly time points from week 3–8 post infection. Of the 180 tissue cysts 38 (21%) were small, 118 (66%) were medium sized and 24 (13%) were large. Tissue cysts in this data set were analyzed by week in Figures 4,5. While a trend line (r2 = 0.0562) suggest a weak correlation between cyst size and AG levels based on PAS intensity. Pearson Coefficient = −0.236.
Figure 3.
Figure 3.. Implementation and validation of AmyloQuant and optimization of PAS labeling.
AmyloQuant is an intensity-based image analysis tool that analyzes the heterogeneity in amylopectin distribution in tissue cysts. (A,B) The AmyloQuant application allows for the establishment of a region of interest (tissue cyst) within which the distribution of PAS intensity is plotted. The application allows for the setting of 3 threshold cutoffs defining 4 intensity bins, 1. Background (BG-black), Low intensity (Blue), Moderate/Intermediate (Int) intensity (Green) with values above the moderate threshold defining the high intensity pixels (red). The total recorded pixels and proportions in each of the 4 bins is established and a spatial color-coded heat map generated for each cyst. (C) Optimization of PAS staining of tissue cyst for analysis. The Schiff reagents in PAS staining were diluted with tap water in a 1:4 (standard protocol), 1:10, and 1:20 ratio. All the images are captured at the same exposure conditions. The top panel shows the cyst image and their respective heatmap from AmyloQuant analysis. Based on the PAS intensity of the image, a 1:10 ratio is selected as the optimum condition. (D) Validation of AmyloQuant sensitivity. A PAS-stained cyst was imaged at varying exposure times and analyzed using AmyloQuant with identical threshold values for the pixel bins (BG thresh-10/Low thresh-25/High thresh-50). Longer exposure times result in brighter which is reflected in the AmyloQuant generated spatial heat maps. The 1 second exposure was selected as optimal with the optimized PAS staining conditions. (E) Acid-Alpha-Glucosidase targets both the linear α1,4 and branched α1,6 glucan linkages resulting in the breakdown of amylopectin. (F) The specificity of PAS staining for amylopectin is validated by enzymatic digestion of issue cysts with 10 and 25 units of Acid-Alpha-Glucosidase as is evident from both the intensity following PAS labeling and is captured by the AmyloQuant generated spatial heat map. The control sample was incubated only with a buffer without the addition of acid alpha glucosidase. (scale bars,10μm).
Figure 4.
Figure 4.. Amylopectin dynamics in the early phase of the chronic infection.
PAS stained images of thirty randomly acquired tissue cysts from mice infected for 3 (A,B,C,D), 4 (E,F,G,H) and 5 (I,J,K,L) weeks were analyzed using AmyloQuant. The background (black: 0–10), low (blue:10–25), moderate (green: 25–50) threshold values, with the final high (red: >50) bin defining the 4 bins for analysis presented in a stacked plot format. The tissue cysts were ordered based on the level of high (red) intensity pixels, and secondarily in cysts lacking high intensity pixels on level of moderate (green) intensity pixels. In order to capture the diversity of intensity in high range (red: >50), the background thresholds was set at 50 (gray: 0–50) with high range bins expanded to 50–75 (pink), 75–100 (magenta) and >100 (purple) (B,F,J). The pie charts (C,G,K) represent the pixel intensity distribution following aggregation of the tissue cysts analyzed at each time point. The values, represented as a percentage of the total pixels in each of bin, are presented in the accompanying legend. The tissue cysts represented at each time account for 4258 bradyzoites at week 3, 5485 bradyzoites at week 4 and 5946 bradyzoites at week 5 respectively. Finally, AmyloQuant generated spatial heat maps are presented as thumbnails for every 5th tissue cyst for each week post infection (D,H,L). Consistent with the accumulation of amylopectin during the course of the chronic infection, we observe as general trend of increased AG with a general increase in the levels of intermediate and high intensity pixels reflected for the population in the pie charts (C, G, K) and spatial heat maps (D, H, L).
Figure 5.
Figure 5.. Amylopectin dynamics with the maturation of the chronic infection.
PAS stained images of thirty randomly acquired tissue cysts from mice infected for 6 (A,B,C,D), 7 (E,F,G,H) and 8 (I,J,K,L) weeks analyzed using AmyloQuant. The background (black: 0–10), low (blue:10–25), moderate (green: 25–50) threshold values, with the final high (red: >50) bin defining the 4 bins for analysis presented in a stacked plot format. The tissue cysts were ordered based on the level of high (red) intensity pixels, and secondarily in cysts lacking high intensity pixels on level of moderate (green) intensity pixels. In order to capture the diversity of intensity in high range (red: >50), the background thresholds was set at 50 (gray: 0–50) with high range bins expanded to 50–75 (pink), 75–100 (magenta) and >100 (purple) (B,F,J). The pie charts (C,G,K) represent the pixel intensity distribution following aggregation of the tissue cysts analyzed at each time point. The values, represented as a percentage of the total pixels in each of bin, are presented in the accompanying legend. The tissue cysts represented at each time account for 8407 bradyzoites at week 6, 4347 bradyzoites at week 7 and 6802 bradyzoites at week 8 respectively. AmyloQuant generated spatial heat maps are presented as thumbnails for every 5th tissue cyst for each week post infection (D,H,L). The proportion of tissue cysts with high levels of AG increases dramatically at weeks 6 and 7 (A,B, E, F). This is reflected in the distribution of pixel intensities for the bradyzoite population evident in the pie charts (C,G) as well as within the spatial heat maps generated using AmyloQuant (D,E). The transition from week 7 to week 8 is defined by a profound reduction in AG levels (E,F,I,J) withing individual tissue cysts that is reflected in both the overall distribution of PAS intensities evident in the pie charts (G,K) as well as the spatial heat maps bradyzoite population (H,L).
Figure 6
Figure 6. Levels and distribution of active mitochondria based on the membrane potential is highly variable across tissue cysts and displays a temporal profile.
(A) MitoTracker labeling (red) of freshly isolated ex vivo tissue cysts (DBA-green) reveal considerable heterogeneity ranging from the absence of active mitochondrial to cysts with a high level of activity (left panel). Most tissue cysts display a patchwork of activity as observed in the overlay of the MitoTracker (red) and DIC image (right panel). Nuclei are labeled with DAPI (blue). (B) The proportion of active mitochondria relative to nuclei in tissue cysts harvested weekly from week 3 to 8 post infection show a trend of increasing activity from weeks 3–6 followed by a large increase in the number of cysts with >95% of active mitochondria relative to nuclei at week 7. A broad distribution is re-established at week 8 post infection. In instances where the number of mitochondrial profiles exceeded the number of nuclei within the cyst the value was corrected to 100%. Mitochondrial profiles exceeding the number of nuclei could be due to documented fragmentation of the organelle. 1 cyst out of 33 at week 6, 12 cysts out of 39 at week 7 and 2 cysts out of 34 at week 8 were subject to correction. Statistical analysis performed using one-way ANOVA with Tukey’s multiple comparisons test. A *: 0.021–0.030 p-value.
Figure 7.
Figure 7.. Amylopectin influences the replication of bradyzoites within tissue cysts.
(A) Recently replicated bradyzoites within tissue cysts can be identified by the intensity of TgIMC3 labeling. The mean intensity of tissue cysts harvested from weeks 3–8 was measured using Image J. The brightest, mean intensity and dimmest cyst at each timepoint Tissue cysts harvested weekly from week 3–8 are represented as a measure of relative mean intensity. All images were captured using identical exposure parameters. Images represent the center slice of a z-stack (z interval of 0.24μm) following iterative deconvolution. Scale bar represents 10 microns. (B) Distribution of mean TgIMC3 intensities in tissue cysts harvested at weeks 3–8 reveal an overall pattern of reducing recent replicative activity during the early phase of the chronic infection (week 3–5) that is followed by a burst of recent replication within tissue cysts in the latter half of the cycle (weeks 6–8). Data represent sample means for week 3 (n=35 cysts), week 4 (n=40), week 5 (n=35), week 6 (n=34), week 7 (n=37) and week 8 (n= 37). Statistical Analysis: One way ANOVA with Tukeys multiple comparisons test. Adjusted p values: *: 0.011, **: 0.002, ***: 0.0002, ****: <0.0001 (C) The packing density, a measure of cyst occupancy was determined for the TgIMC3 labeled cysts. Packing densities revealed a generally stable pattern from week 3–7 consistent with balanced sporadic intracyst replication. The transition from week 7 to week 8 was noted by extensive intra-cyst bradyzoite replication within most tissue cysts indicative of a coordinated replicative burst. Statistical analysis: One way ANOVA with Tukey’s multiple comparisons test. Adjusted p values: **: 0.0030, ***: 0.0007, ****: < 0.0001.
Figure 8.
Figure 8.. Correlation of AG dynamics, mitochondrial activity, recency of replication and packing density follow distinct patterns.
Panel 1: Mean PAS intensity for the analyzed tissue cyst populations harvested weekly from week 3–8 post infection reveal a slow increase in the early phase (weeks 3–5) followed by rapid accumulation of AG (weeks 6–7) and subsequent loss at week 8. (Dashed line +/− SEM) Panel 2: This pattern is largely mirrored by the proportion of active mitochondria with the increased levels of active mitochondria initiating at week 4, peaking at week 7 post infection. This is followed by a precipitous drop between weeks 7–8 resetting a potential cycle. Panel 3: Recency of replication based on mean TgIMC3 intensity reveals a shutting down of active replication between weeks 3–5 a period associated with limited AG accumulation. Increases in AG accumulation at weeks 6–8 are associated with a marked increase (week 6–7) of recent replicative activity that is sustained at week 8. Panel 4: A general trend for a stable packing density between weeks 3 and 8 is consistent with balanced cyst expansion matched with sporadic growth. The transition from week 7 to 8 is associated with coordinated intracyst replication that is accompanied by the depletion of AG reserves and overall mitochondrial activity. Statistical analyses: In each case the dashed line represents the boundary of the standard error of the mean (+/− SEM).

References

    1. Dubey J. P., Jones J. L., Toxoplasma gondii infection in humans and animals in the United States. International journal for parasitology 38, 1257–1278 (2008). - PubMed
    1. Hill D. E., Chirukandoth S., Dubey J. P., Biology and epidemiology of Toxoplasma gondii in man and animals. Anim Health Res Rev 6, 41–61 (2005). - PubMed
    1. Sinai A. P. et al. , Reexamining Chronic Toxoplasma gondii Infection: Surprising Activity for a “Dormant” Parasite. Curr Clin Microbiol Rep 3, 175–185 (2016). - PMC - PubMed
    1. Dubey J. P., Lindsay D. S., Speer C. A., Structures of Toxoplasma gondii tachyzoites, bradyzoites, and sporozoites and biology and development of tissue cysts. Clin Microbiol Rev 11, 267–299 (1998). - PMC - PubMed
    1. Watts E. et al. , Novel Approaches Reveal that Toxoplasma gondii Bradyzoites within Tissue Cysts Are Dynamic and Replicating Entities In Vivo. mBio 6, e01155–01115 (2015). - PMC - PubMed

Publication types