[Preprint]. 2025 Feb 7:2024.09.05.611490.
doi: 10.1101/2024.09.05.611490.

AI-Based Discovery and CryoEM Structural Elucidation of a KATP Channel Pharmacochaperone

Affiliations

AI-Based Discovery and CryoEM Structural Elucidation of a KATP Channel Pharmacochaperone

Assmaa ElSheikh et al. bioRxiv. .

Update in

Abstract

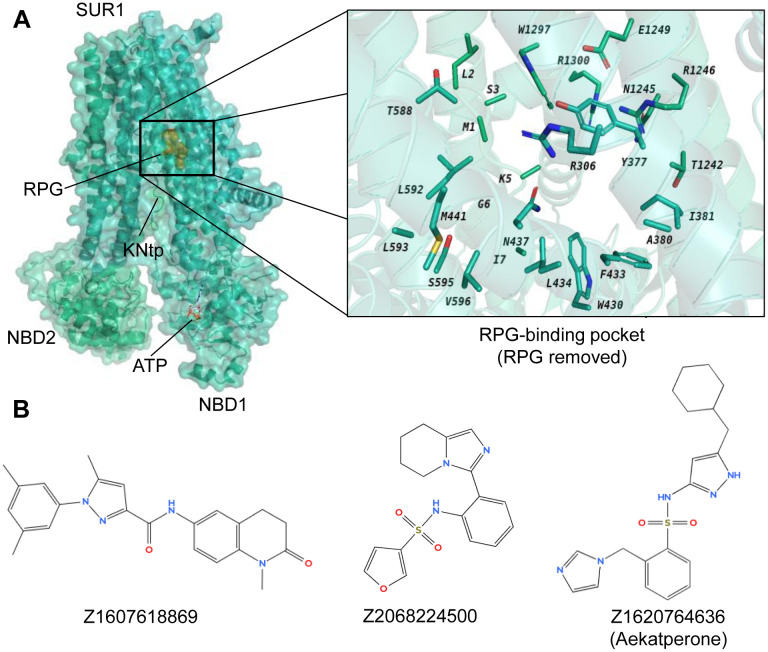
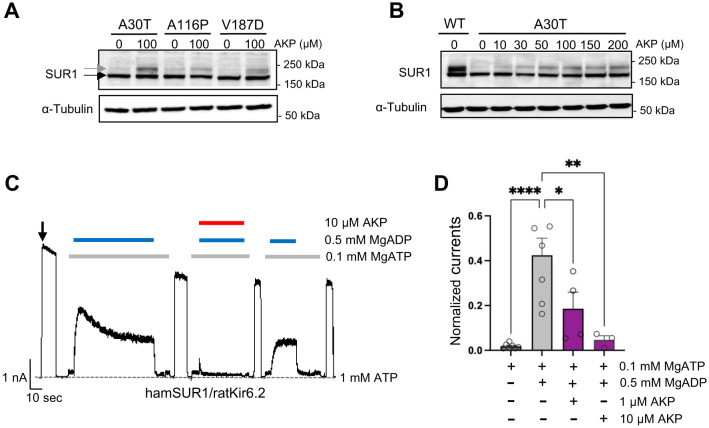
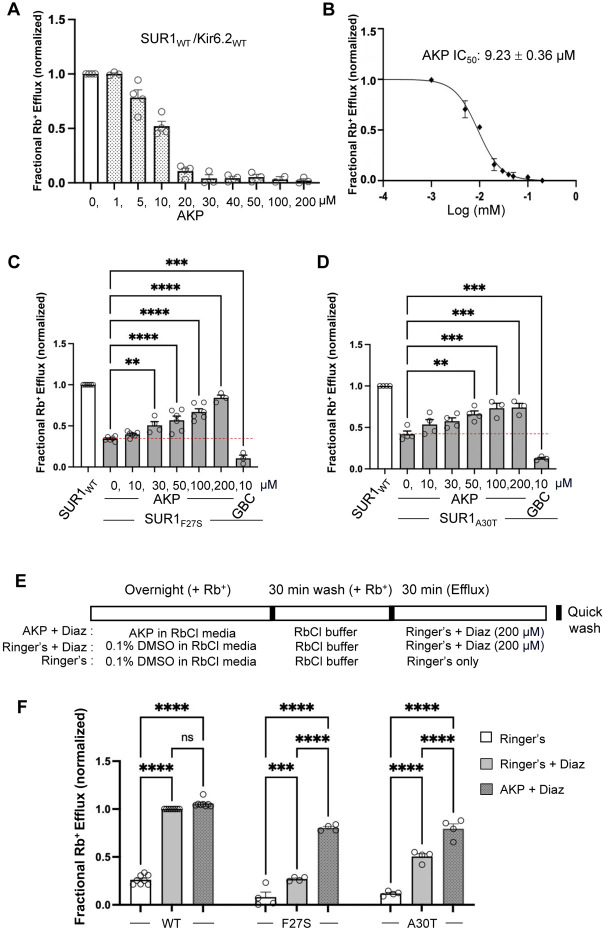
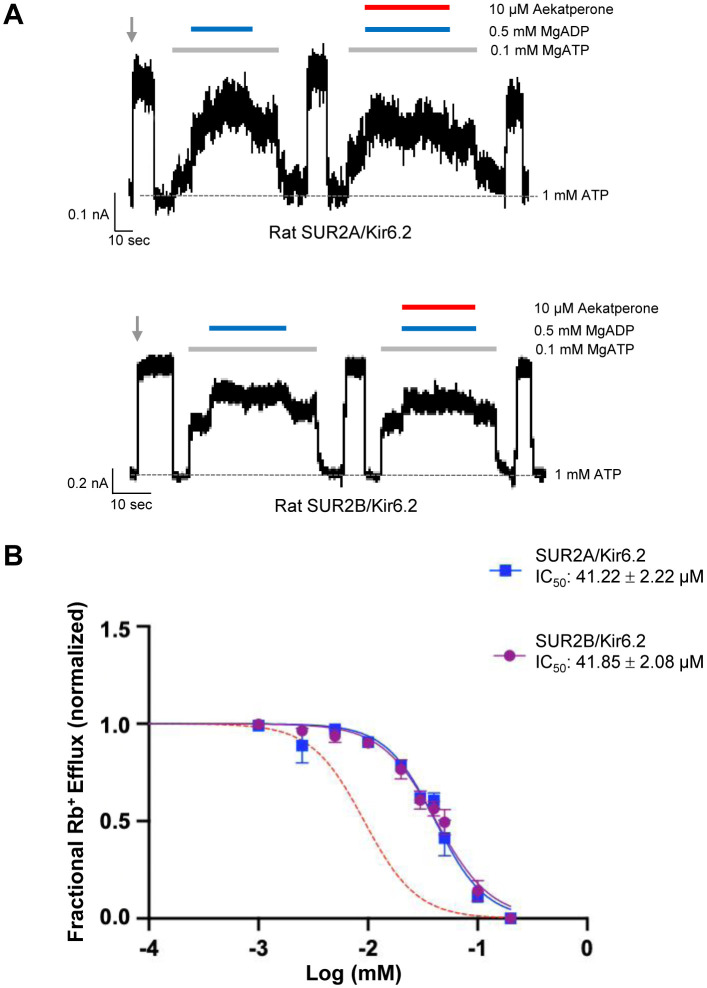
Pancreatic KATP channel trafficking defects underlie congenital hyperinsulinism (CHI) cases unresponsive to the KATP channel opener diazoxide, the mainstay medical therapy for CHI. Current clinically used KATP channel inhibitors have been shown to act as pharmacochaperones and restore surface expression of trafficking mutants; however, their therapeutic utility for KATP trafficking impaired CHI is hindered by high-affinity binding, which limits functional recovery of rescued channels. Recent structural studies of KATP channels employing cryo-electron microscopy (cryoEM) have revealed a promiscuous pocket where several known KATP pharmacochaperones bind. The structural knowledge provides a framework for discovering KATP channel pharmacochaperones with desired reversible inhibitory effects to permit functional recovery of rescued channels. Using an AI-based virtual screening technology AtomNet® followed by functional validation, we identified a novel compound, termed Aekatperone, which exhibits chaperoning effects on KATP channel trafficking mutations. Aekatperone reversibly inhibits KATP channel activity with a half-maximal inhibitory concentration (IC50) ~ 9 μM. Mutant channels rescued to the cell surface by Aekatperone showed functional recovery upon washout of the compound. CryoEM structure of KATP bound to Aekatperone revealed distinct binding features compared to known high affinity inhibitor pharmacochaperones. Our findings unveil a KATP pharmacochaperone enabling functional recovery of rescued channels as a promising therapeutic for CHI caused by KATP trafficking defects.

Keywords: ABC transporter; ATP-sensitive potassium channel; Kir6.2; SUR1; cryoEM structure; drug discovery; pharmacological chaperones.


Figures

Figure 1.
Figure 1.. Identification of potential pharmacochaperones for pancreatic KATP channels through virtual screening and experimental validation.
(A) Left: CryoEM structure of repaglinide (RPG)-bound pancreatic KATP channel (PDB ID: 6PZ9; only the SUR1 ABC core and Kir6.2-N terminal peptide (KNtp) are shown; RPG is shown in gold spheres and ATP bound at the NBD1 of SUR1 is shown as red sticks). Right: a close-up view of the target site used for virtual screening of a library of ~2.5 million compounds (from Enamine), utilizing the AtomNet model (RPG is removed to show only the binding residues from SUR1). From this screening, a set of 96 “top scoring compounds” was selected for experimental validation. (B) Chemical structures of the top three compounds, C24, C27, and C45, identified via experimental testing of pharmacochaperone effects on a KATP trafficking mutant (Supplementary Fig. 1) correspond to ZINC IDs Z1607618869, Z2068224500, and Z1620764636 respectively. These compounds are chemically distinct from one another. Note C27 and C45 both contain a sulfonamide group (-SO2-N-), which is different from the sulfonylurea group (-SO2-NH-CO-NH-) seen in known KATP inhibitors such as glibenclamide and tolbutamide.
Figure 2.
Figure 2.. Aekatperone has dual pharmacochaperone and inhibitory actions on pancreatic KATP channels.
(A) Representative western blots of SUR1 from COSm6 cells co-transfected with cDNAs of WT Kir6.2 and trafficking mutants of SUR1 TMD0 domain, A30T, A116P or V187D, and treated with either 0.1% DMSO (0 μM) or 100 μM Aekatperone (AKP) for 16 hours. The core-glycosylated immature SUR1 and the complex-glycosylated mature SUR1 are indicated by the black and grey arrows, respectively. The tubulin blot below serves as a loading control. (B) Representative western blots of SUR1 from COSm6 cells co-transfected with cDNAs of WT Kir6.2 and a SUR1 trafficking mutant A30T, and treated with either 0.1% DMSO (0 μM) or various concentrations of Aekatperone (10, 50, 100, 150, 200 μM) for 16 hours. WT SUR1 from cells co-transfected with WT Kir6.2 and WT SUR1 without Aekatperone treatment served as a control (left lane). (C) Representative recording from COSm6 cells co-transfected with hamster SUR1 and rat Kir6.2. Channels were exposed to K-INT solution upon patch excision (arrow) and exposed to solutions containing MgATP, MgADP, or Aekatperone as indicated by the bars above the recordings and the labels on the right. The patch was exposed to 1mM ATP periodically to ensure the baseline has not shifted (grey dashed line). (D) Quantification of currents (normalized to currents in K-INT/1 mM EDTA at the time of patch excision) in various solutions from recordings such as that shown in (A). Each bar represents the mean ± SEM of at least 3 patches, with circles showing individual patches. *p < 0.05 by one-way ANOVA and Dunnet’s post-hoc test.
Figure 3.
Figure 3.. Functional recovery of mutant KATP channels rescued by Aekatperone.
(A) Rb+ efflux assay results showing Aekatperone (AKP) dose-dependently inhibited WT pancreatic KATP channels (hamster SUR1 and rat Kir6.2) expressed in COSm6 cells and opened by metabolic inhibition (see Methods). The fractional Rb+ efflux was calculated by subtracting efflux in untransfected cells and normalizing to efflux in cells treated with 0.1% DMSO. (B) Dose-response curve of Aekatperone inhibition from data shown in (A) fitted with a Hill equation with variable slope using GraphPad Prism 10. The IC50 is 9.23 μM ± 0.36 μM. Error bars represent the SEM. (C, D) Bar graphs showing dose-response enhancement in KATP channel activity as assessed by Rb+ efflux assay in COSm6 cells expressing two different trafficking mutations, SUR1F27S (A) and SUR1A30T (B). The cells were treated with varying concentrations of Aekatperone (10, 30, 50, 100, or 200 μM), GBC at 10 μM, or 0.1% DMSO as a vehicle control (0 μM Aekatperone) for 16 hours. Aekatperone and GBC was excluded from the efflux solutions during the efflux assay. Untransfected (UT) cells were included to quantify background Rb+ efflux, which was subtracted from other experimental readings. The data were normalized to the fractional Rb+ efflux of cells expressing WT channels. Error bars represent the SEM of at least 3 independent experiments (circles are individual data points from 3-6 different experiments). Statistical significance was performed using one-way ANOVA followed by Dunnett’s post-hoc multiple comparison test, alpha = 0.05. *p < 0.05, **p< 0.01, ***p< 0.001, ****p< 0.0001. A red dashed line is shown to indicate the basal efflux of the mutant channels under vehicle control conditions (in the absence of Aekatperone). (E) Schematic of experimental design for (F). COSm6 cells transfected with WT or various mutant channels were treated with 0.1% DMSO (vehicle control) or 100 Aekatperone (AKP) overnight in the presence of Rb+. Before efflux measurements, cells were washed in a RbCl containing buffer lacking AKP for 30 min. Efflux was then measured for 30 min in a Ringer’s solution ± Diazoxide (Diaz) at 200 μM. Note, diazoxide was included in Ringer’s solution during the efflux assay but not during the overnight incubation. (F) Rb+ efflux experiments showing overnight treatment with AKP enhances acute Diaz response in COSm6 cells expressing trafficking mutants. Each bar represents the mean ± SEM of at least 3 different biological repeats, with circles indicating individual data points, alpha = 0.05. *p < 0.05, **p < 0.01, ***p < 0.001, ****p < 0.0001 by one-way ANOVA with Dunnett's multiple comparisons test.
Figure 4.
Figure 4.. SUR2-containing KATP channels are less sensitive to Aekatperone inhibitory effects.
(A) Representative recordings from COSm6 cells expressing SUR2A/Kir6.2 (top) or SUR2B/Kir6.2 channels. Channels were exposed to K-INT solution upon patch excision (grey arrow) and exposed to solutions containing MgATP, MgADP, or Aekatperone as indicated by the bars above the recordings and the labels on the right. The patch was exposed to 1 mM ATP periodically to ensure the baseline has not shifted (grey dashed line). (B) IC50 of Aekatperone on SUR2A/Kir6.2 or SUR2B/Kir6.2 channels transiently expressed in COSm6 cells Kir6.2 using Rb+ efflux assay. Data were fit with a Hill equation with variable slope using GraphPad Prism 10. The Aekatperone IC50 is 41.22 μM ± 2.22 μM (SEM) for SUR2A/Kir6.2 channels and 41.85 μM ± 2.08 μM (SEM) for SUR2B/Kir6.2 channels. The error bar for each data point represents the SEM. Red dotted line represents the dose response curve of Aekatperone on SUR1/Kir6.2 channels from Fig.3B for comparison.
Figure 5.
Figure 5.. Structure of the KATP channel in complex with Aekatperone.
(A) Structural model of the pancreatic KATP channel in complex with Aekatperone showing SUR1 in NBD-separated conformation and the Kir6.2 pore (red) constricted at the helical bundle crossing (HBC) and the selectivity filter (SF) gates. Aekatperone is shown as purple mesh (0.08V contour) and N-terminal domain of Kir6.2 (KNtp) as blue mesh (0.08 V contour). Only one SUR1 subunit attached to Kir6.2 core is shown based on the focused refinement cryoEM map of the Kir6.2 tetramer and a single SUR1 subunit. SUR1 transmembrane domain (TMD) 1 and 2 are colored in dark green and light green, respectively. NBD; Nucleotide binding domain, L0; L0 loop of SUR1. (B, C) Close-up sideview (B) and top-down view of the Aekatperone binding site. Aekatperone cryoEM density and model are shown in magenta and SUR1 residues that interact with Aekatperone are shown as sticks. KNtp is shown as a blue main chain peptide. Red numbers indicate the numbers of helices of SUR1. (D) Aekatperone cryoEM density map (0.08 V contour) and model fitting in two different views. Note at the contour shown, some surrounding density from interacting SUR1 and Kir6.2 is included.
Figure 6.
Figure 6.. Dynamical behavior of Aekatperone in the SUR1 cavity investigated by molecular dynamics (MD) simulations.
(A) Scatter of the positions of the centers of mass of individual fragments of Aekatperone during the simulation. The initial position is marked as sticks. Light green helices belong to TMD2, dark green to TMD1, and the blue fragment is KNtp. (B) Standard deviation of the positions of the centers of mass of individual fragments during the simulation. The fragments are color-coded throughout the figure. (C) Frequency of staying in close contact with SUR1 and KNtp residues during the simulation, divided by individual fragments. (D, E) An example snapshot from the simulation of Aekatperone in the pocket showing its interactions with SUR1 and KNtp residues - side view (D) and top view (E).
Figure 7.
Figure 7.. Mutagenesis studies supporting the Aekatperone binding site model derived from Cryo-EM.
(A) 2D Aekatperone binding site model showing chemical interactions between the compound and surrounding SUR1 residues and KNtp. (B) Rb+ efflux experiments testing the effect of mutating select binding site residues on channel response to Aekatperone. Each bar is the mean and error bars represent the SEM of 3 independent experiments (individual data points shown as circles). Statistical significance is based on two-way ANOVA with Dunnett's post-hoc multiple comparisons test, with alpha = 0.05. **p < 0.01, ***p < 0.001, ****p < 0.0001.
Figure 8.
Figure 8.. KNtp plays a role in Aekatperone-induced inhibitory effects on pancreatic KATP channel.
(A) CryoEM density map of the pancreatic KATP channel in complex with Aekatperone (AKP), with the SUR1 subunit in the front shown in vertical sliced view. KNtp is highlighted in blue and Aekaperone in magenta. (B) Close-up view of the AKP (magenta) and KNtp (blue) structures overlayed with corresponding cryoEM densities (at 0.08 V) showing the close proximity of the imidazole group of Aekatperone to KNtp. (C) Comparison of the effects of Aekatperone on COSm6 cells expressing either WT KATP channels or channels with KNtp deletions of either 5 or 10 amino acids ( Δ5 or Δ10 KNtp) using the Rb+ efflux assay. Rb+ efflux assays were performed in the presence of metabolic inhibitors with various concentrations of Aekatperone as indicated on the x-axis. The data were normalized against the fractional Rb+ efflux of untreated cells expressing either WT or KNtp mutant channels with metabolic inhibition but without Aekatperone. Each bar is the mean and error bars represent the SEM of 5-6 independent experiments (individual data points shown as light black circles). Statistical significance is based on two-way ANOVA and Tukey's post-hoc multiple comparisons test. Alpha = 0.05. **p < 0.01, ***p < 0.001, ****p < 0.0001.

Similar articles

References

    1. Aguilar-Bryan L., & Bryan J. (1999). Molecular biology of adenosine triphosphate-sensitive potassium channels. Endocrine reviews, 20(2), 101–135. - PubMed
    1. Ambrósio A. F., Silva A. P., Malva J. O., Soares-da-Silva P., Carvalho A. P., & Carvalho C. M. (1999). Carbamazepine inhibits L-type Ca2+ channels in cultured rat hippocampal neurons stimulated with glutamate receptor agonists. Neuropharmacology, 38(9), 1349–1359. 10.1016/s0028-3908(99)00058-1 - DOI - PubMed
    1. Ashcroft F. M. (2005). ATP-sensitive potassium channelopathies: focus on insulin secretion. J Clin Invest, 115(8), 2047–2058. 10.1172/JCI25495 - DOI - PMC - PubMed
    1. Ashcroft F. M. (2023). KATP Channels and the Metabolic Regulation of Insulin Secretion in Health and Disease: The 2022 Banting Medal for Scientific Achievement Award Lecture. Diabetes, 72(6), 693–702. 10.2337/dbi22-0030 - DOI - PMC - PubMed
    1. Atomwise-AIMS-Program. (2024). AI is a viable alternative to high throughput screening: a 318-target study. Scientific Reports, 14(1), 7526. 10.1038/s41598-024-54655-z - DOI - PMC - PubMed

Publication types

LinkOut - more resources