[Preprint]. 2024 Sep 8:2024.09.06.611737.
doi: 10.1101/2024.09.06.611737.

Mutagenesis Sensitivity Mapping of Human Enhancers In Vivo

Affiliations

Mutagenesis Sensitivity Mapping of Human Enhancers In Vivo

Michael Kosicki et al. bioRxiv. .

Update in

  • In vivo mapping of mutagenesis sensitivity of human enhancers.
    Kosicki M, Zhang B, Hecht V, Pampari A, Cook LE, Slaven N, Akiyama JA, Plajzer-Frick I, Novak CS, Kato M, Tran S, Hunter RD, von Maydell K, Barton S, Beckman E, Zhu Y, Dickel DE, Kundaje A, Visel A, Pennacchio LA. Kosicki M, et al. Nature. 2025 Jul;643(8072):839-846. doi: 10.1038/s41586-025-09182-w. Epub 2025 Jun 18. Nature. 2025. PMID: 40533554

Abstract

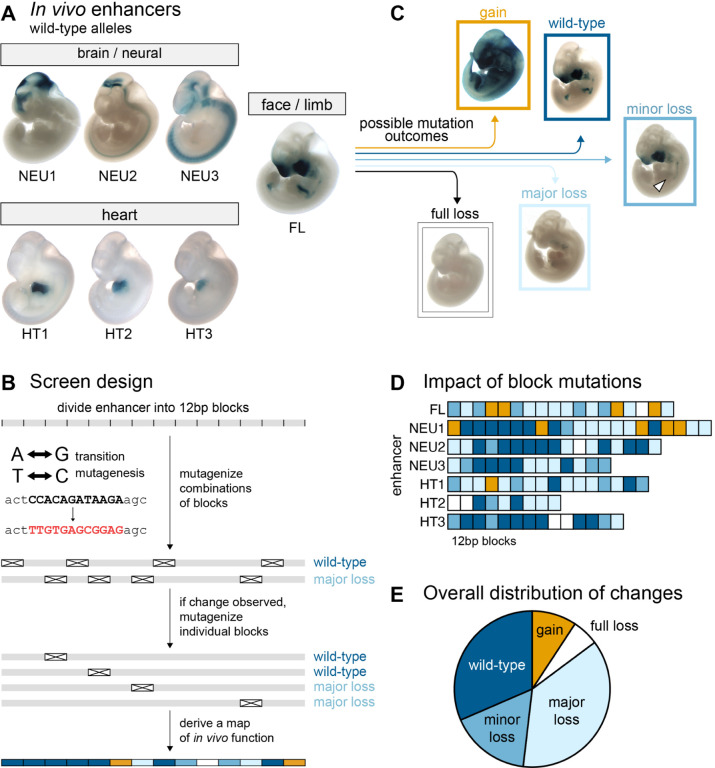
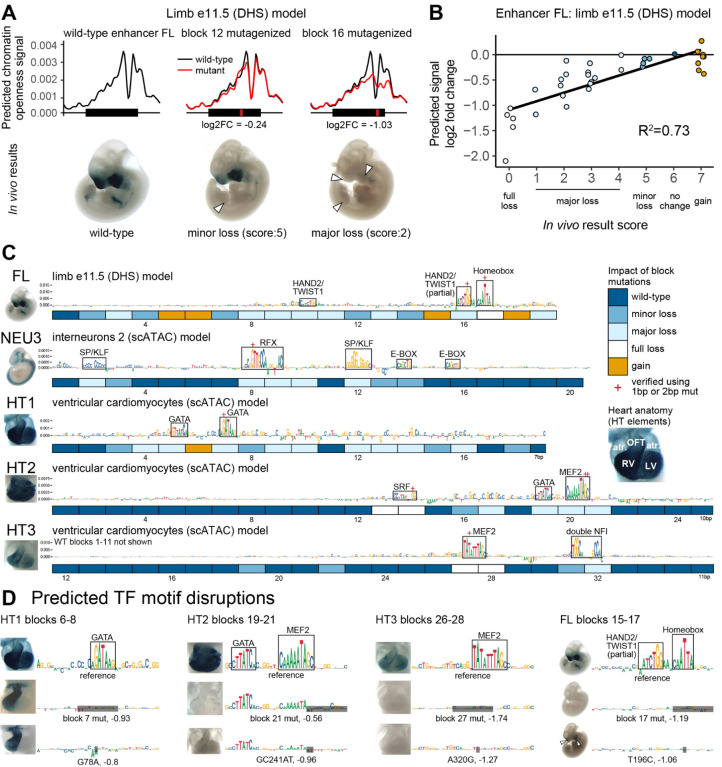
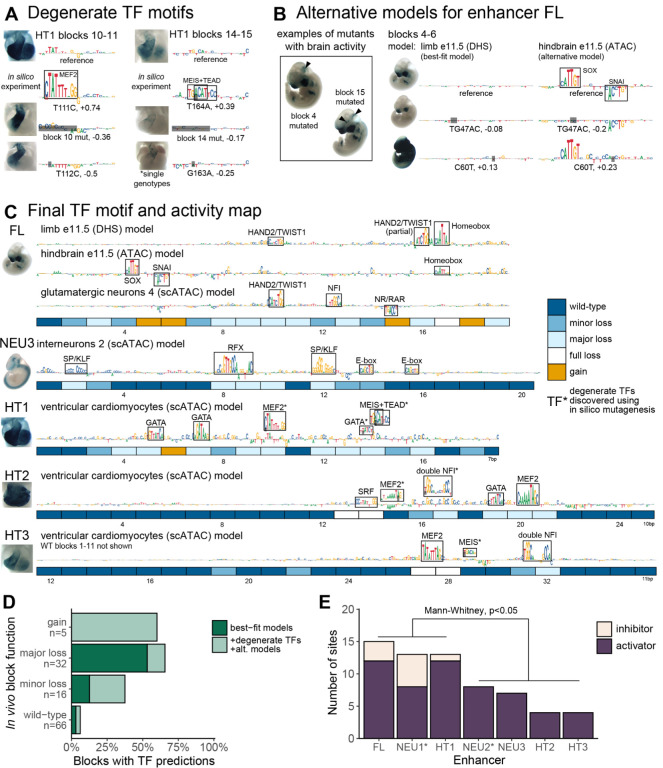
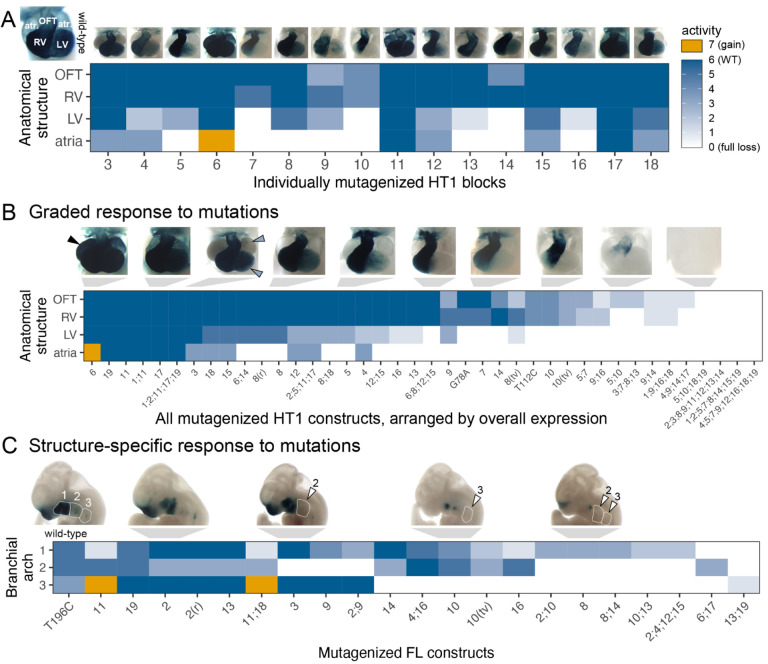
Distant-acting enhancers are central to human development. However, our limited understanding of their functional sequence features prevents the interpretation of enhancer mutations in disease. Here, we determined the functional sensitivity to mutagenesis of human developmental enhancers in vivo. Focusing on seven enhancers active in the developing brain, heart, limb and face, we created over 1700 transgenic mice for over 260 mutagenized enhancer alleles. Systematic mutation of 12-basepair blocks collectively altered each sequence feature in each enhancer at least once. We show that 69% of all blocks are required for normal in vivo activity, with mutations more commonly resulting in loss (60%) than in gain (9%) of function. Using predictive modeling, we annotated critical nucleotides at base-pair resolution. The vast majority of motifs predicted by these machine learning models (88%) coincided with changes to in vivo function, and the models showed considerable sensitivity, identifying 59% of all functional blocks. Taken together, our results reveal that human enhancers contain a high density of sequence features required for their normal in vivo function and provide a rich resource for further exploration of human enhancer logic.


Conflict of interest statement

Conflicts of Interest A.K. is on the scientific advisory board of SerImmune, AINovo, TensorBio and OpenTargets. A.K. was a scientific co-founder of RavelBio, a paid consultant with Illumina, was on the SAB of PatchBio and owns shares in DeepGenomics, Immunai, Freenome, and Illumina.

Figures

Figure 1.
Figure 1.. General enhancer properties.
(A) Wild-type pattern of seven enhancers mutagenized in this study (see Supplementary Table 1 for details). (B) Initial screen design. (C) Examples of patterns in mutagenized constructs. (D) Functional annotation of 12bp blocks (N=108; see Supplementary Note 2 for adjustments). (E) Distribution of block mutation outcomes (N=108).
Figure 2.
Figure 2.. Machine learning model selection and validation.
(A) Examples of ChromBPNet model output and in vivo results for reference and mutagenized constructs of enhancer FL. White arrowheads indicate partial or full loss of in vivo activity. (B) Correlation of model-predicted mutation effects (change in predicted signal between wild-type and mutagenized sequence) and the observed in vivo mutagenesis results. Each dot represents a construct with a mutagenized block or a combination of blocks. R2=Spearman correlation. (C) Contributions scores for wild-type sequences with per block in vivo experiment results in boxes below. Best-fit models depicted. Clusters with high contribution scores boxed in (N=14). OFT = outflow tract, LV = left ventricle, RV = right ventricle, atr. = atrium. (D) Single or double basepair mutations were introduced at clusters with high contribution scores. Also see Supplementary Figure 4B.
Figure 3.
Figure 3.. Refined map of binding motifs and enhancer activity.
(A) Discovery of additional sites through in silico mutagenesis and validation. Also see Supplementary Figure 5 A and B. (B) Examples of block mutants with gain of brain activity and additional motifs discovered using alternative FL models trained on neuronal datasets. Black arrowheads indicate gain of function. Also see Supplementary Figure 5C. (C) Final TF binding motif and activity map. Includes motifs discovered using alternative models (element FL) and degenerate motifs (marked with asterisks; elements HT1, HT2 and HT3). (D) Fraction of blocks with motif predictions, by experimentally determined function. Major loss includes full loss. (E) Number of activator and inhibitor sites as estimated from experimental data alone (marked with asterisk; NEU1 and NEU2) or from experimental data combined with model motif predictions (FL, NEU3, HT1–3), by enhancer (Methods, Supplementary Figure 5D for visual guide).
Figure 4.
Figure 4.. Patterns of multi-tissue in vivo responses to mutations.
(A) Activity of single block mutants of enhancer HT1, scored across four cardiac substructures. Flanking wild-type blocks not shown. (B) Activity all mutated HT1 constructs, scored across four cardiac substructures, arranged by overall expression (Methods). (C) Activity of mutated FL constructs, scored across three branchial arches. Arranged by structure-specific full loss of function. Only mutants with partial loss of function in one of the arches were included. OFT = outflow tract, LV = left ventricle, RV = right ventricle, atr. = atrium, (r) = random scrambling mutagenesis, (tv) = GC content preserving transversion mutagenesis, 1;11 = combinatorial mutagenesis of blocks 1 and 11, A190G = 1bp A to T mutation at position 190. Arrowheads: black = gain of function, blue = minor loss, white = full loss. Also see Supplementary Figure 7.
Figure 5.
Figure 5.. Comparison of individual and paired block mutations.
(A) Classification of outcomes of paired block mutagenesis. A combination of two loss-of-function mutations resulting in a more pronounced loss is considered additive, while any other outcome is classified as non-additive (also see Supplementary Figure 8A). (B) Distribution of additive and non-additive outcomes of paired block mutagenesis. (C) Examples of additive pairs. (D) An example of non-additive pair. White arrowheads highlight structures of interest (see main text). Also see Supplementary Figure 8.

References

    1. Lambert S. A. et al. The Human Transcription Factors. Cell 172, 650–665 (2018). - PubMed
    1. Fickett J. W. Quantitative discrimination of MEF2 sites. Mol. Cell. Biol. 16, 437–441 (1996). - PMC - PubMed
    1. Long H. K., Prescott S. L. & Wysocka J. Ever-Changing Landscapes: Transcriptional Enhancers in Development and Evolution. Cell 167, 1170–1187 (2016). - PMC - PubMed
    1. Gotea V. et al. Homotypic clusters of transcription factor binding sites are a key component of human promoters and enhancers. Genome Res. 20, 565–577 (2010). - PMC - PubMed
    1. Johnson D. S., Mortazavi A., Myers R. M. & Wold B. Genome-wide mapping of in vivo protein-DNA interactions. Science 316, 1497–1502 (2007). - PubMed

Publication types