[Preprint]. 2025 Feb 5:2024.09.03.611139.
doi: 10.1101/2024.09.03.611139.

Rhythmic circuit function is more robust to changes in synaptic than intrinsic conductances

Affiliations

Rhythmic circuit function is more robust to changes in synaptic than intrinsic conductances

Zachary Fournier et al. bioRxiv. .

Update in

Abstract

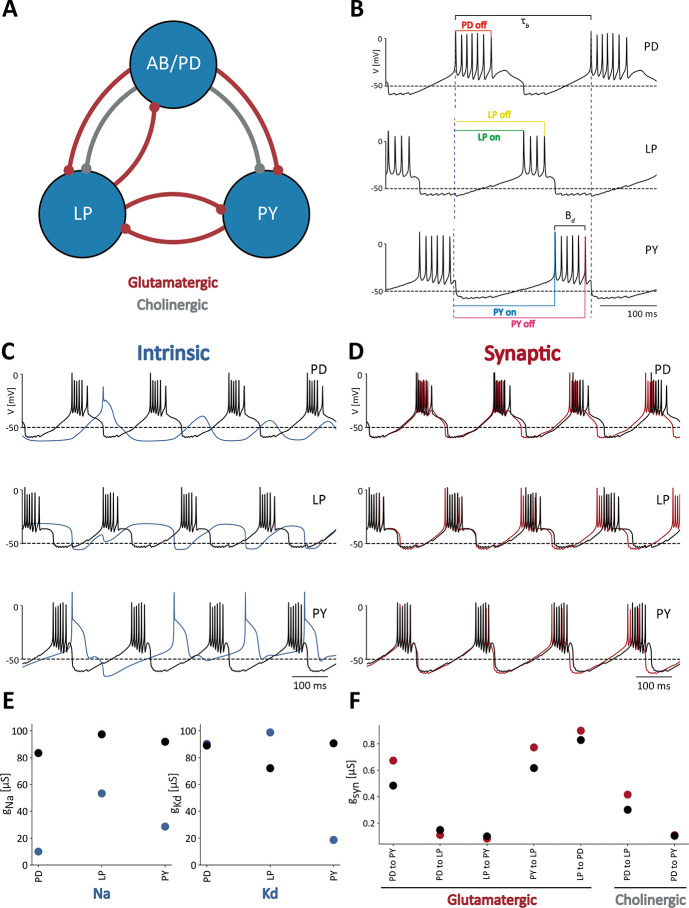
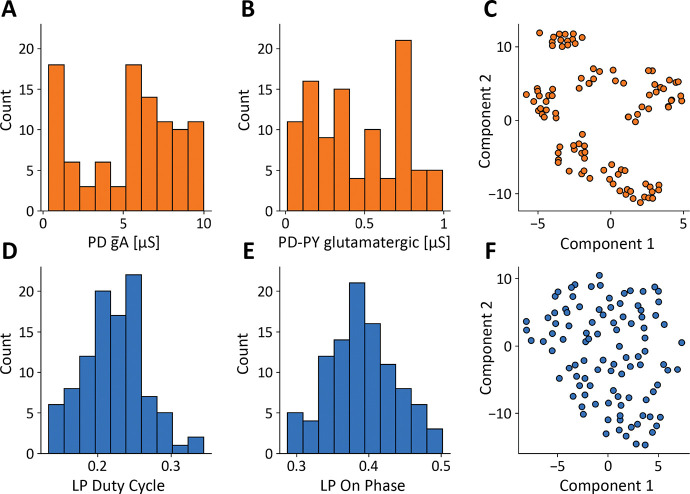
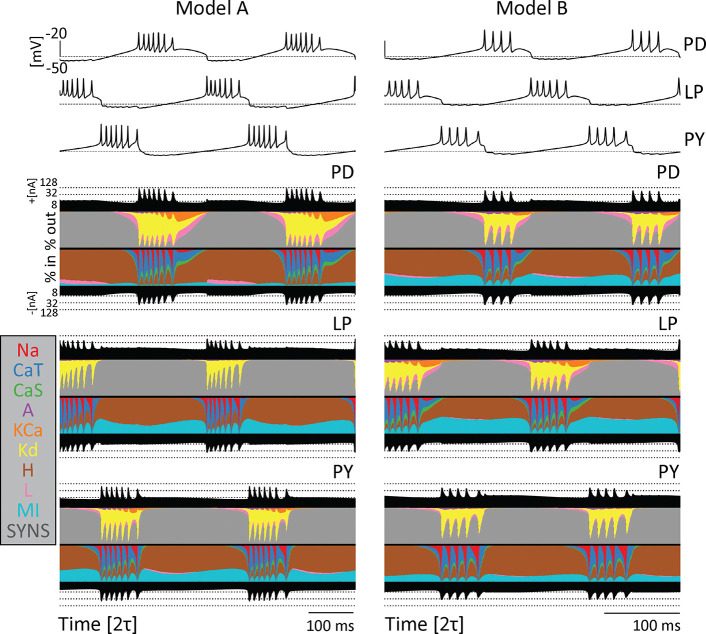
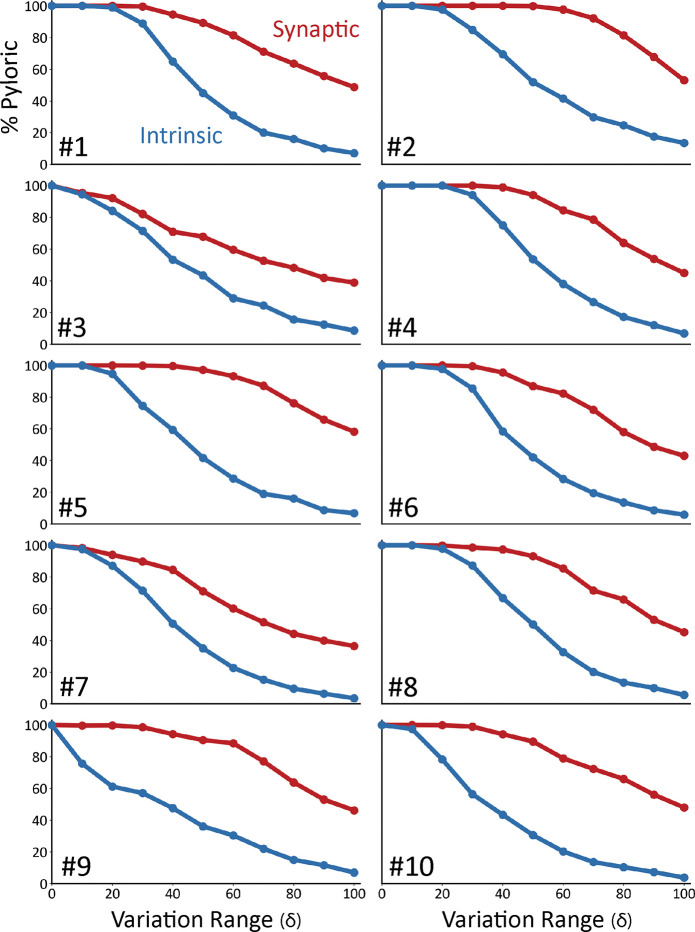
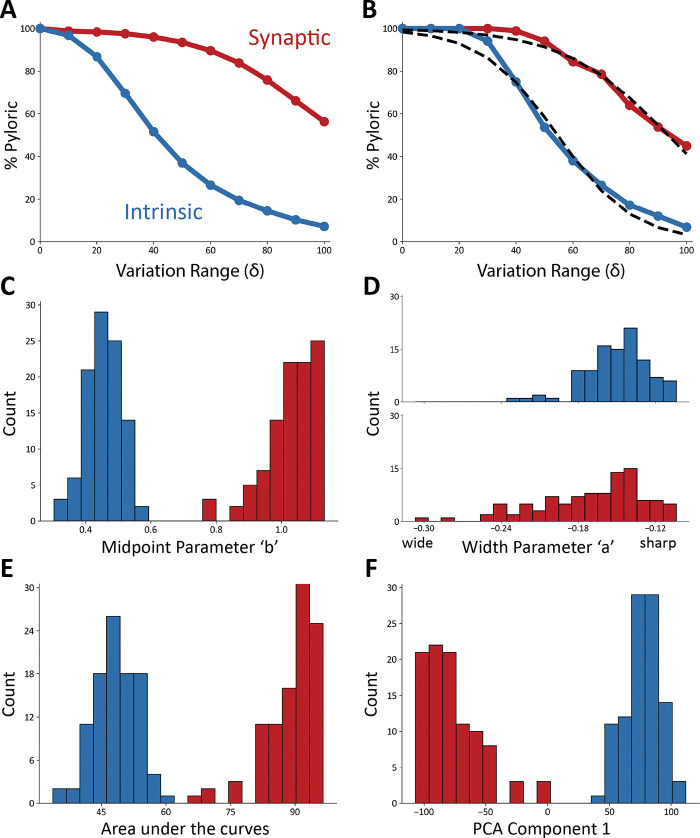
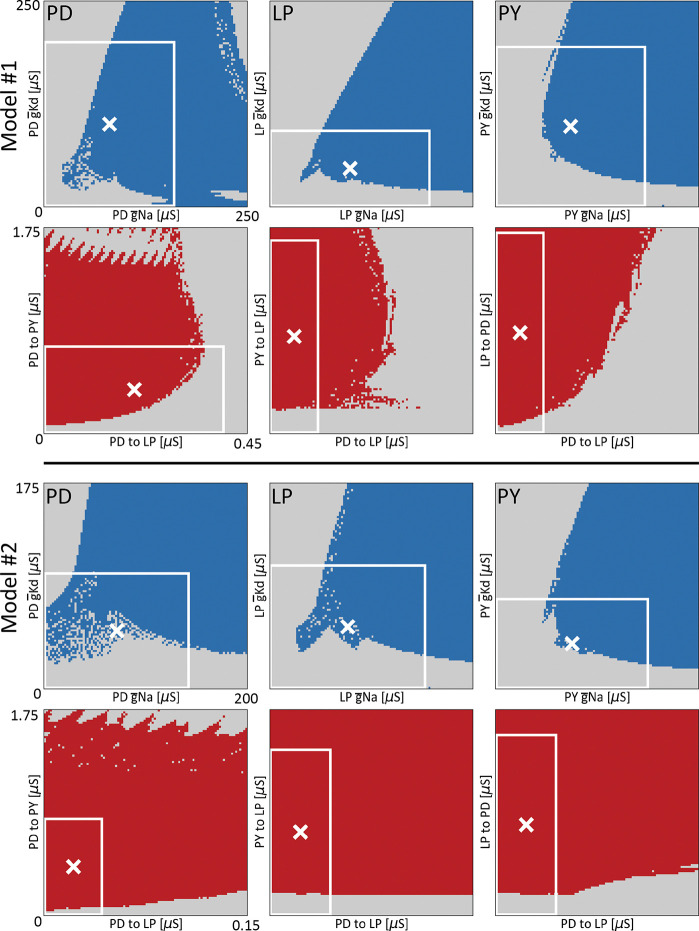
Circuit function results from both intrinsic conductances of network neurons and the synaptic conductances that connect them. In models of neural circuits, different combinations of maximal conductances can give rise to similar activity. We compared the robustness of a neural circuit to changes in their intrinsic versus synaptic conductances. To address this, we performed a sensitivity analysis on a population of conductance-based models of the pyloric network from the crustacean stomatogastric ganglion (STG). The model network consists of three neurons with nine currents: a sodium current (Na), three potassium currents (Kd, KCa, A-type), two calcium currents (CaS and CaT), a hyperpolarization-activated current (H), a non-voltage-gated leak current (leak), and a neuromodulatory current (MI). The model cells are connected by seven synapses of two types, glutamatergic and cholinergic. We produced one hundred models of the pyloric network that displayed similar activities with values of maximal conductances distributed over wide ranges. We evaluated the robustness of each model to changes in their maximal conductances. We found that individual models have different sensitivities to changes in their maximal conductances, both in their intrinsic and synaptic conductances. As expected the models become less robust as the extent of the changes increase. Despite quantitative differences in their robustness, we found that in all cases, the model networks are more sensitive to the perturbation of their intrinsic conductances than their synaptic conductances.

Keywords: central pattern generators; inhibitory synapses; ion channels; neuronal oscillators; pyloric rhythm.


Figures

FIG. 1.
FIG. 1.. Feature extraction to classify model network activity
(A) Schematic of the model used in Prinz et al. (2004). The three cells are connected by seven inhibitory chemical synapses of two types: the red curves are cholinergic synapses and the grey curves are glutamatergic synapses. (B) Pyloric network activity. Each cell displays periodic bursting activity and the cells fire in a sequence PD-LP-PY. The color lines indicate the measures used for calculating duty cycle and firing phases. (C) Membrane voltages of control network activity (in black), overlaid with the network activity that results from changing the intrinsic conductances (blue). (D) Membrane voltages of control network activity (in black) overlaid with network activity that results from changing the synaptic conductances (in red). (E) Changes in intrinsic maximal conductance values. The black dots show the unperturbed or control conductances and the blue dots correspond to the changed conductances that produced the blue voltage traces in Figure 1C. Only 2 maximal conductances per cell are shown for simplicity, but all 9 × 3 = 27 intrinsic conductances were changed. (F) Synaptic maximal conductance values for the control network (in black) and the perturbed network (in red) in Figure 1D.
FIG. 2.
FIG. 2.. A model database of degenerate solutions.
(A, B) Distributions of gA maximal conductance in PD cells and PDPYglut glutamatergic synapse maximal conductance (N = 100). (C) Dimensionality reduction (t-SNE) and visualization of models’ maximal conductances. (D, E) Distributions of features: LP duty cycle and LP-ON phase. (F)Dimensionality reduction (t-SNE) and visualization of models’ conductances models’ features.
FIG. 3.
FIG. 3.. Model networks produce similar behavior with different underlying currents.
Currentscapes for two different models. The voltage traces for both networks are plotted at the top. The filled curves on top and bottom of the currentscapes for each cell type show the total inward (outward) current over time in logarithmic scale. The colored filled curves indicate the percent contribution of each current over time.
FIG. 4.
FIG. 4.. Model networks are differentially sensitive to modification of intrinsic and synaptic conductances.
Curves representing the decrease in the percentage of pyloric models as a function of the variation range. Curves from intrinsic conductance perturbations are shown in blue, and synaptic in red. Ten sets of curves are shown for ten models with different combinations of maximal conductances.
FIG. 5.
FIG. 5.. Model networks are more sensitive to changes in intrinsic conductances
(A) Average sensitivity curves across models. The plots show the average percentage of pyloric models for each value of δ (intrinsic curves show in blue, synaptic in red). (B) Example sigmoidal fits for one set of intrinsic and synaptic sensitivity curves. (C) Distributions of midpoint parameters for all fits of the sensitivity curves (intrinsic in blue, synaptic in red, 20 bins). (D) Distributions of width parameters for all fits of the sensitivity curves (intrinsic in blue, synaptic in red, 20 bins). (E) Distributions of the areas under the curves (intrinsic in blue, synaptic in red, 20 bins). (F) Distribution of eigenvalues for the first PCA component (97.6%) (intrinsic in blue, synaptic in red, 20 bins).
FIG. 6.
FIG. 6.. Relative robustness of models visualized in conductance space.
Ranges of conductance space where the activity of the network is pyloric, for two different models (model #1 and model #2). All panels show the output of the classifier over 2D ranges of conductance space. The top panels show pairs of intrinsic maximal conductances (gNa and gKd of each cell). The blue dots correspond to values of the conductances that produce pyloric activity, while the gray dots indicate values were the network activity is not pyloric. The bottom panels show pairs of synaptic maximal conductances for which the activity is pyloric in red. The white cross indicates the values of the conductances for the models. The white boxes indicate the extent of the perturbations when they are allowed to be as large as a 100% deviation from their control values (δ=1).

References

    1. Abbott L. F. and Nelson S. B. (2000). Synaptic plasticity: taming the beast. Nature neuroscience, 3(11):1178–1183. - PubMed
    1. Alonso L. M. and Marder E. (2019). Visualization of currents in neural models with similar behavior and different conductance densities. Elife, 8:e42722. - PMC - PubMed
    1. Alonso L. M. and Marder E. (2020). Temperature compensation in a small rhythmic circuit. Elife, 9:e55470. - PMC - PubMed
    1. Atallah B. V. and Scanziani M. (2009). Instantaneous modulation of gamma oscillation frequency by balancing excitation with inhibition. Neuron, 62(4):566–577. - PMC - PubMed
    1. Baccaglini P. I. and Spitzer N. C. (1977). Developmental changes in the inward current of the action potential of rohon-beard neurones. The Journal of physiology, 271(1):93–117. - PMC - PubMed

Publication types