[Preprint]. 2025 Aug 14:2024.09.03.611068.
doi: 10.1101/2024.09.03.611068.

A flexible photoacoustic retinal prosthesis

Affiliations

A flexible photoacoustic retinal prosthesis

Audrey Leong et al. bioRxiv. .

Abstract

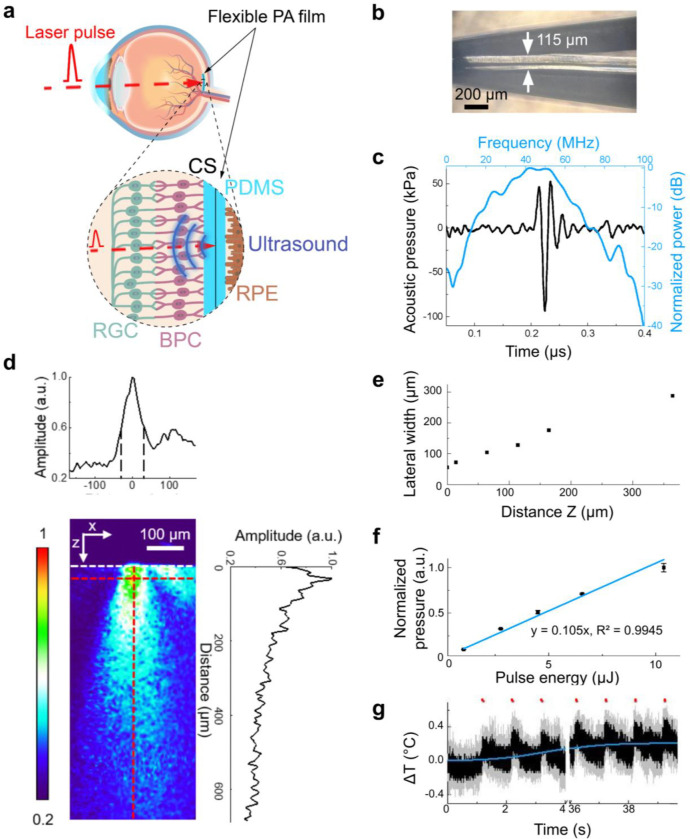
Retinal degenerative diseases of photoreceptors are a leading cause of blindness with no effective treatment. Retinal prostheses aim to restore sight by stimulating residual retinal cells. Here, we present a photoacoustic retinal stimulation technology. We designed a polydimethylsiloxane and carbon-based flexible film that converts near-infrared laser pulses into a localized acoustic field with 56-μm lateral resolution, allowing precise stimulation of mechanosensitive retinal cells. This photoacoustic stimulation robustly and locally modulated retinal ganglion cell activity in both wild-type and degenerated ex vivo rat retinae. In animals subretinally implanted with a millimeter-sized photoacoustic film , pulsed laser stimulation generated neural modulation along the visual pathway to the superior colliculus, as measured by functional ultrasound imaging. The biosafety of the film was confirmed by the absence of short-term adverse effects , while local thermal increases were measured below 1 °C. These findings demonstrate the potential of photoacoustic stimulation for high-acuity visual restoration in blind patients.


Conflict of interest statement

Competing interests This study was funded in part by the company Axorus SAS. J-DL and HM are major stakeholders in Axorus. CY and J-XC are minor stakeholders in Axorus.

Figures

Figure 1.
Figure 1.. Characterization of the flexible photoacoustic film.
(a) Working principle of the flexible photoacoustic (PA) film. Illumination of the PA film (cyan) with a nanosecond pulsed laser (red dashed line) produces an ultrasound emission (blue). CS: candle soot, PDMS: polydimethylsiloxane, RPE: retinal pigment epithelium, RGC: retinal ganglion cells, BPC: bipolar cells. (b) A photograph of the PDMS/CS/PDMS film with a three-layer design held by a tweezer. (c) Characterization of the PA film in the temporal domain (black) and frequency domain (blue) measured 0.9 mm away from the film surface. (d) Mapping of the ultrasound field generated by the PDMS/CS/PDMS film upon illumination through a 50-μm optical fiber. Center: measured distribution of the generated US field. The side lobe on the right of the field is due to the slight tilted angle when the optical fiber was put in contact with the sample film. White dotted line: interface between water and the film. Top and right: normalized lateral and axial profiles of the PA field, respectively, measured along the red dashed lines in the center panel. The amplitude of the acoustic signal was normalized to the maximum amplitude measured in the field. (e) Full width at half maximum of the lateral profile as a function of the axial position Z extracted from (d). (f) Peak-to-peak pressure of the PA signal as a function of laser energy per pulse measured from a PDMS/CS/PDMS film by a hydrophone. The pressure was normalized to the maximum pressure in all measurements. N = 3 for each data point. Blue line: linear fitting: y = 0.105x, R2 = 0.9945. (g) Temperature increase at the surface of the PA film following illumination with a 200-μm laser spot. N = 3 for each data point, mean (black line) ± SD (gray shade). Red dots: laser on. Laser parameters: energy of 10 μJ per pulse, repetition rate of 3 kHz (laser power density P = 0.95 W/mm2), and burst duration 50 ms, delivered every 1 s over 40 s. The baseline change due to cumulative thermal effect was determined by logistic curve fitting of the data (blue line).
Figure 2.
Figure 2.. Photoacoustic modulation of ex vivo wild type and degenerated retinae.
(a) The ex vivo retina was placed on a multi-electrode array (MEA) with the photoacoustic film against the photoreceptor layer. (b) Top: schematic of the laser sequence for photoacoustic stimulation. Laser pulses, with an energy of Ep = 10 μJ per pulse and duration dpulse = 4.2 ns, were delivered at a repetition frequency frep = 1.9 kHz during a single burst of duration db = 10 ms. Each laser pulse is converted by the PA film into an acoustic wave with a duration dUS = 36 ns. Bottom: Example high-pass filtered MEA recording from a single electrode displaying elicited spikes following a photoacoustic stimulation. Red shaded area: laser on. Inset: zoom in of action potentials following stimulation. (c) Examples of Long Evans (LE) and P23H RGC responses to photoacoustic stimulation. Cyan (LE) and brown (P23H) lines: mean firing rate. Gray shaded areas: 99% bootstrapped CI from 1000 samples. Red shaded area: PA stimulation. (d) Heatmaps of normalized firing rates for responsive LE RGCs (left, n = 100) and P23H RGCs (right, n = 88). Red shaded area: PA stimulation. Dashed black line: 45-ms cutoff for slow and fast latency responses. Cells with excited responses display an increase in firing rate after photoacoustic stimulation (red), and cells with inhibited responses display a decrease in firing rate (blue). (e) Percentage of cells modulated by photoacoustic stimulation per stimulation site. LE: 74% (4 rats, n = 10 stimulation sites), P23H: 39 %, (4 rats, n = 12 stimulation sites). *** p < 0.001, Mann Whitney U test. (f) Firing rates of LE and P23H RGCs during baseline (basal) and following stimulation (stim). Mean firing rates: LE: frbasal = 14 ± 1.0 Hz, frstim = 66 ± 3.7 Hz (n = 82 RGCs within stimulation range, p < 0.001, Wilcoxon signed-rank); P23H: frbasal = 10 ± 1.2 Hz, frstim = 29 ± 2.88 Hz (n = 72 RGCs within stimulation range, p < 0.001, Wilcoxon signed-rank). (g) Latencies of RGC responses for LE (51 ± 34.2 ms, mean ± standard deviation) and P23H (89 ± 65 ms, p < 0.001 Wilcoxon rank-sum)). Dashed black line: 45-ms cutoff for slow- and fast-latency responses. (h) Firing rate of modulated RGCs as a function of response latency. Firing rate and response latency of excited RGCs were correlated for LE (r = −0.40, p < 0.001, Pearson correlation) and P23H (r = −0.59, p < 0.001, Pearson correlation) RGCs. (i) Off-film laser light stimulation. Percentage of LE RGCs modulated by direct laser stimulation on the retina (“off film”) compared to photoacoustic stimulation (“on film”). Laser parameters: Ep = 10 μJ per pulse, frep = 3.5 kHz, db = 10 ms. Off film: 3.6% ± 0.9% (n = 56 cells, 2 retinae), on film: 77% ± 20% (n = 59 cells, 3 retinae). Statistics: * p< 0.05, *** p < 0.001, Mann-Whitney U test.
Figure 3.
Figure 3.. Photoacoustic responses under pharmacological blocking.
(a) Percentage of cells modulated by photoacoustic stimulation per stimulation site before and after L-AP4 application. No blocker: 49%; L-AP4: 16%; L-AP4 + ACET: 7%; washout: 40% (2 retinae, n = 9 stimulation sites). (b) Group III mGluR agonist L-AP4 decreased RGC spontaneous firing rate and firing rate during PA-elicited responses in LE retinae. The population firing rate of RGCs (n = 41 cells, 2 retinae) is compared between baseline (Basal) and stimulation (Stim.), before blocker application (No blocker), following blocker application (L-AP4) and after washout (Washout) with Ringer medium. Firing rates per condition, no blockers: frbasal = 18 ± 2Hz, frstim = 103 ± 9 Hz (p < 0.001); L-AP4: frbasal = 9 ± 1 Hz, frstim = 37 ± 6 Hz (p < 0.001); L-AP4+ACET: frbasal = 6 ± 1 Hz, frstim = 16 ± 3 Hz (p = 0.024), washout: frbasal = 7 ± 1 Hz, frstim = 86 ± 13 Hz (p < 0.001). Comparison of the population stimulation firing rate frstim after blocker application and frstim before application (p < 0.001), and frstim after washout (p < 0.001). (c) L-AP4 increases response latency in LE retinae. Response latency per condition, no blockers: 49 ± 5 ms; L-AP4: 65 ± 4 ms; washout: 42 ± 3 ms. Comparison of the response latency before blocker application and after (p < 0.001, Wilcoxon signed-rank), and after washout (Friedmanchi square, p = 0.4). Due to absence of responses during application of L-AP4+ACET blockers, no latencies are reported for this group. Dashed black line: 45-ms cutoff for slow- and fast-latency responses. (d) Percentage of cells modulated by photoacoustic stimulation per stimulation site before and after (rs)-CPP and CNQX application in P23H retinae. No blocker: 42 %; (rs)-CPP + CNQX: 5 %; washout: 8 % (2 retinae, n = 5 stimulation sites). (e) Glutamate blockers (rs)-CPP and CNQX abolished RGC responses to PA stimulation in P23H retinae. The population firing rate of RGCs (n = 25 cells, 2 retinae) is compared between baseline (basal) and stimulation (stim), before blocker application (no blocker), following blocker application ((rs)-CPP+CNQX) and after washout (washout) with Ringer medium. Firing rates per condition, no blockers: frbasal = 11 ± 2 Hz, frstim = 100 ± 23 Hz (p < 0.001); (rs)-CPP+CNQX: frbasal = 7 ± 2 Hz, frStim = 23 ± 10 Hz (p =0.141); washout: frbasal = 8 ± 2 Hz, frstim = 24 ± 9 Hz (p = 0.016). Comparison of the population stimulation firing rate frstim after blocker application and frstim before application (p < 0.001, Wilcoxon signed-rank), and frstim after washout (p < 0.001, Wilcoxon signed-rank). For each panel, groups are tested for significant differences using Friedman chi square, with post-hoc Wilcoxon signed-rank. P-values are holm-corrected (***: p<0.001, **: p<0.05).
Figure 4.
Figure 4.. RGC responses under different laser burst durations and laser repetition rates.
(a) Example LE (left) and P23H (right) cells showing increased maximum firing rate (fr) with increased burst duration (recorded at frep1 = 1.9 kHz). Lighter colors indicate longer burst durations (db= 5–30 ms). Vertical red lines: laser onset. (b) Maximum firing rate as a function of burst duration for LE and P23H RGCs during stimulation with repetition frequencies frep1 = 1.9 kHz (dashed line) and frep2 = 3.5 kHz (solid line). Data are plotted as mean + SE. In LE RGCs (left panel), the firing rate was positively correlated with burst duration for frep1 (r = 0.91, p = 0.01, Pearson R). In P23H RGCs (right panel), the firing rate was positively correlated during both frep1 (r = 0.996, p < 0.001) and frep2 (r = 0.811, p = 0.05). With frep1, for db = 5 ms and 20 ms, the maximum firing rate of LE RGCs was 2.8- and 1.3-fold higher, respectively, than for P23H RGCs (p < 0.001 for all conditions, Mann-Whitney U-test). With frep2, for db = 5 ms, the maximum firing rate of LE RGCs is 4.7-fold higher than for P23H RGCs (p < 0.001, Mann-Whitney U-test). (c) Response latency as a function of burst duration for LE and P23H RGCs showed no significant correlation (LE: p = 0.70 and p = 0.19 for frep1 and frep2, respectively; P23H: p = 0.79 and p=0.61, Pearson R). In both (b) and (c), dashed lines: frep1 = 1.9 kHz (P1 = 0.27 W.mm−2). Solid lines: frep2 = 3.5 kHz (P2 = 0.52 W.mm−2). Dataset for (b) and (c): for LE, n = 244 cells, recorded from 4 retinae. For P23H, n = 104 cells, recorded from 4 retinae.
Figure 5.
Figure 5.. Spatial distribution of RGC modulation upon photoacoustic stimulation.
(a) Different populations of RGCs were modulated by moving the laser fiber at different sites on the film. Example of a P23H retina stimulated at three sites; modulated cells at each stimulation site are grouped by color. The 300-μm-diameter laser spots are marked by dashed circles. (b) RGC firing rate of modulated cells normalized to maximum firing rate, mapped relative to the stimulation site for LE (left, 4 retinae, 11 stimulation sites) and P23H (right, 4 retinae, 6 stimulation sites). RGC maximum firing rates were averaged across all recorded cells at the same XY coordinates relative to the center of the laser spot (LE: n = 576 and P23H: n = 157 RGCs). Data were smoothed using convolution with a 100-μm gaussian kernel. Dashed circle: 300-μm-diameter laser spot. The shift between the maximum firing rate and the laser spot may be due to uncertainty in the laser spot coordinates, due to the 100-μm pitch of the MEA used for indirect measurement of the exact laser position. (c) Maximum firing rate for individual cells as a function of distance from the laser for LE (left) and P23H (right) RGCs. The response firing rate is negatively correlated with distance (LE: r = −0.310, p < 0.001. P23H: r = −0.268, p < 0.05, Pearson R). Each circle represents an individual cell. Cyan and brown: LE and P23H RGCs modulated by photoacoustic stimulation, respectively. Gray: non-modulated cells. (d) Percentage of RGCs modulated as a function of distance from the laser spot. Cyan: LE cells. Brown: P23H cells. Datasets for (c) and (d) are the same as for (b).
Figure 6.
Figure 6.. In vivo photoacoustic implant biocompatibility.
(a) Eye fundus (left) and OCT images (middle and right) of an LE rat retina with a subretinal PDMS/CS/PDMS implant (yellow dotted line) at 7, 15, and 90 days post-implantation (dpi). OCT images were taken along the white dotted line shown in the left panel. In the zoomed-in OCT images, GCL: retinal ganglion cell layer, INL: inner nuclear layer, PRL: photoreceptor layer. RPE: retinal pigmented epithelium. The PR layer has degenerated above the implant. Right inset: zoom on the OCT image at 90 dpi. (b) Same as (a) but for a P23H rat. (c) Mean LE retinal thickness above PDMS/CS/PDMS (light cyan) and PDMS-CNT (dark cyan) implants over time. Control: mean retinal thickness next to the implant at 15 dpi. Thickness at 15 dpi and later is significantly lower than control thickness (**p < 0.01, Wilcoxon Signed-Rank test). At 15 dpi, the thickness above PDMS/CS/PDMS implants is not statistically different from the thickness above PDMS-CNT implants (p = 0.16, Mann-Whitney U test). Between 15 dpi and 90 dpi, the decrease in thickness above PDMS/CS/PDMS implant (123.2 ± 2.9 μm to 107.3 ± 2.0 μm) is not significant (p = 0.25, Wilcoxon Signed-Rank test). (d) Same as (c) for P23H rats. The difference of retinal thickness above both implants is not statistically significant (p = 0.16 at 15 dpi and 0.32 at 30 dpi, Mann-Whitney U-test). Retinal thickness is stable up to 120 dpi for both PDMS-CNT (p = 0.18, one-way ANOVA) and PDMS/CS/PDMS implants (p = 0.51). (e) Immunolabeling of an implanted LE retina, labeling rods (Rho, red, i, iv), cones (CAR, green, i, iii), microglia (Iba1, magenta, i, ii, iv), and Müller cells (GFAP, green, i, iii). i - iii: implanted zone. iv: zone surrounding the implant. (f) Same as (e) for P23H, with microglia (Iba1, magenta, i, ii, iv) and Müller cells (GFAP, green, i, iii). Scale bar for (e) and (f) is 200 μm.
Figure 7.
Figure 7.. Superior colliculus activation following photoacoustic stimulation of in vivo LE retinae.
(a) Setup for in vivo eye stimulation and fUSI recordings. (b) Eye fundus images of a 1-mm PA implant (i, yellow dotted circle) and 400-μm-diameter laser spots (ii: pulsed 1030-nm laser on the implant, iii: continuous 595-nm laser on the retina) used for laser and photoacoustic stimulation. (c) Functional ultrasound imaging in the coronal plane (left hemisphere, AP, −6.5 mm from the bregma). The correlation map displays the relationship between relative cerebral blood volume (rCBV) and the stimuli. Active pixels reflect regions of activated neurons in the contralateral superior colliculus (cSC) for a single recording (15 stimulations). (d) Top: Laser sequence for photoacoustic stimulation (repetition rate frep = 6.1 kHz). Bottom: example normalized CBV trace for pulsed 1030-nm photoacoustic stimulation on a PDMS-CNT implant (measured in 29-by-29-pixel region of interest of the cSC, chosen as the area with peak correlation to full-field-white-light stimulation). Baseline activity was recorded for 40 s before and after the stimulation session, and was used to normalize the CBV signal. (e) Average rCBV for a single session with 15 stimulations (same data as for (d)). Mean rCBV ± 99% CI. The laser sequence starts at 0 s. Red shaded area: PA stimulation. (f) Activated area following stimulation, relative to the area activated by full-field white light stimulation (rel. activated area), for different stimuli: full-field white light stimulation (light gray, 6 rats, n = 6 recordings), 1030-nm laser stimulation on the retina (dark red, 3 rats, n = 4 recordings), 595-nm laser stimulation on the retina (orange, 3 rats, n = 6 recordings), photoacoustic stimulation with PDMS/CS/PDMS implant (blue, 3 rats, n = 4 recordings), and photoacoustic stimulation with PDMS-CNT implant (black, 2 rats, n = 5 recordings). The activated area is measured by counting the number of pixels on correlation maps such as (c). Circles on the graph mark the ratio for individual recordings. Statistics: p-values vs white light stimulation: * p < 0.05, ** p < 0.01, Wilcoxon Signed-Rank test. PDMS/CS/PDMS vs 595 nm: p = 0.91, PDMS-CNT vs 595 nm: p = 0.792, PDMS/CS/PDMS vs PDMS-CNT: p = 0.56, Mann-Whitney U test. (g) Mean rCBV responses of individual rats following stimulation with a laser (595-nm and 1030-nm on retina) and photoacoustic stimulation, for all rats. Same data as (f). Horizontal bars denote significant elevation with respect to the baseline (e.g., no overlap of CI with basal CI). No significant difference in rCVB following photoacoustic stimulation between both implant types was found (e.g., overlapping confidence intervals). Peak rCBV values: white light, 0.26 (at 2.65 s); 595 nm, 0.20 (at 2.69 s); PDMS-CNT, 0.18 (at 3.24 s); PDMS/CS/PDMS, 0.13 (at 3.18 s); 1030-nm laser on retina, 0.02 (at 2.19 s). Shaded areas: 95% bootstrapped CI. Red shaded area: PA stimulation.

References

    1. Li Jeany Q et al. Prevalence and incidence of age-related macular degeneration in Europe: a systematic review and meta-analysis. Br. J. Ophthalmol. 104, 1077 (2020). - PubMed
    1. Da Cruz L. et al. Five-Year Safety and Performance Results from the Argus II Retinal Prosthesis System Clinical Trial. Ophthalmology 123, 2248–2254 (2016). - PMC - PubMed
    1. Wu K. Y., Mina M., Sahyoun J.-Y., Kalevar A. & Tran S. D. Retinal Prostheses: Engineering and Clinical Perspectives for Vision Restoration. Sensors 23, 5782 (2023). - PMC - PubMed
    1. Muqit M. M. K. et al. Prosthetic Visual Acuity with the PRIMA Subretinal Microchip in Patients with Atrophic Age-Related Macular Degeneration at 4 Years Follow-up. Ophthalmol. Sci. 4, (2024).
    1. Lu G. et al. Ultrasound Retinal Stimulation: A Mini-Review of Recent Developments. IEEE Trans. Ultrason. Ferroelectr. Freq. Control 69, 3224–3231 (2022). - PMC - PubMed

Publication types

LinkOut - more resources