. 2025 Jan 13;15(1):139-161.
doi: 10.1158/2159-8290.CD-24-0887.

AMG 193, a Clinical Stage MTA-Cooperative PRMT5 Inhibitor, Drives Antitumor Activity Preclinically and in Patients with MTAP-Deleted Cancers

Affiliations

AMG 193, a Clinical Stage MTA-Cooperative PRMT5 Inhibitor, Drives Antitumor Activity Preclinically and in Patients with MTAP-Deleted Cancers

Brian Belmontes et al. Cancer Discov. .

Abstract

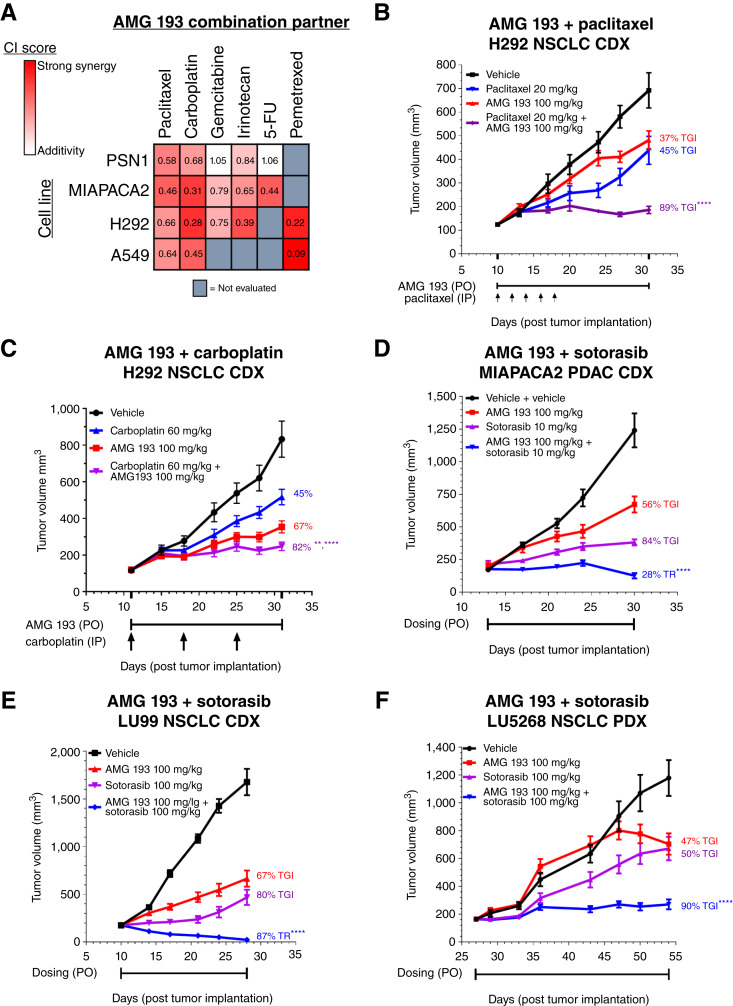
One of the most robust synthetic lethal interactions observed in multiple functional genomic screens has been the dependency on protein arginine methyltransferase 5 (PRMT5) in cancer cells with MTAP deletion. We report the discovery of the clinical stage MTA-cooperative PRMT5 inhibitor AMG 193, which preferentially binds PRMT5 in the presence of MTA and has potent biochemical and cellular activity in MTAP-deleted cells across multiple cancer lineages. In vitro, PRMT5 inhibition induces DNA damage, cell cycle arrest, and aberrant alternative mRNA splicing in MTAP-deleted cells. In human cell line and patient-derived xenograft models, AMG 193 induces robust antitumor activity and is well tolerated with no impact on normal hematopoietic cell lineages. AMG 193 synergizes with chemotherapies or the KRAS G12C inhibitor sotorasib in vitro and combination treatment in vivo substantially inhibits tumor growth. AMG 193 is demonstrating promising clinical activity, including confirmed partial responses in patients with MTAP-deleted solid tumors from an ongoing phase 1/2 study. Significance: AMG 193 preferentially inhibits the growth of MTAP-deleted tumor cells by inhibiting PRMT5 when in complex with MTA, thus sparing MTAP wild-type normal cells. AMG 193 shows promise as a targeted therapy in a clinically defined patient population.


Conflict of interest statement

B. Belmontes, K.K. Slemmons, C. Su, S. Liu, H. Tan, F. Xie, D.A. Aiello, F. Aeffner, M. Vestergaard, S. Cowland, J. Andersson, I. Sarvary, Q. Chen, P. Sharma, P. Lopez, N. Tamayo, L.H. Pettus, J.R. Allen, J. DeVoss, and A. Coxon report employment with and stock ownership in Amgen, Inc. H. Prenen reports personal fees from Roche, AstraZeneca, Pfizer, Merck, Biocartis, and Amgen outside the submitted work. S. Glad, C.-H. Chuang, K. Keyvanjah, and D.M. Townsley report employment with and stock ownership in Amgen, Inc. M.P. Bourbeau reports personal fees from Amgen, Inc., outside the submitted work and a patent for WO2022169948 pending, a patent for WO2022132914 pending, a patent for WO2022115377 pending, and a patent for WO2021163344 pending. P.E. Hughes reports employment with and stock ownership in Amgen, Inc. No disclosures were reported by the other authors.

Figures

Figure 1.
Figure 1.
AMG 193 preferentially inhibits viability and SDMA signaling in MTAP-deleted tumor cells. A, Schematic demonstrates hit to lead to AMG 193 discovery. Cellular potency [HCT116 MTAP-deleted | WT viability IC50 (μmol/L)] and MTA cooperativity of compound 1, AM-9747, and AMG 193 are shown beneath the structures. B, Cocrystal structure of AMG 193 in complex with MTA-bound PRMT5:MEP50 at 2.55 Å resolution (PDB: 9C10). The inset shows the ligand binding site. Cyan, AMG 193; salmon, MTA; red, water; green, PRMT5. Key contacts are shown with yellow dashed lines. The figures were generated with the PyMOL Molecular Graphics System, Version 1.7.0.1 Schrödinger, LLC. C and D, SPR sensorgrams of AMG 193 direct binding with PRMT5 in the presence of 20 μmol/L SAM and 20 μmol/L MTA. Histogram analysis depicts the percentage average binding surface occupancy of AMG 193 with or without MTA. E, Histogram analysis depicts the averaged percentage of PRMT5 surface occupancy by AMG 193 in the presence of SAM or MTA. F, HCT116 WT and MTAP-deleted cells were treated with AMG 193 or DMSO-only control for 6 days. Viability was measured by CTG and cooperativity was determined as follows: Cooperativity = WT IC50/MTAP-deleted IC50 (mean ± SD, n = 3). G, HCT116 WT and MTAP-deleted global SDMA levels were assessed by an in cell imaging assay after 3 days of treatment with AMG 193. Each cell line was normalized to its own DMSO-only control. H, Representative dose-response curves of DLBCL, PDAC, and NSCLC WT and MTAP-deleted cell lines treated with AMG 193 for 6 days, and cell viability was measured by CTG. CTG, CellTiter-Glo; MTA, methylthioadenosine; MTAP, methylthioadenosine phosphorylase; NSCLC, non–small cell lung cancer; PRMT5, protein arginine methyltransferase 5; RU, response units; SDMA, symmetric dimethylarginine; SPR, surface plasmon resonance; WT, wild-type.
Figure 2.
Figure 2.
AM-9747 treatment results in cell cycle arrest and increased DNA damage. A, Cell cycle analysis in HCT116 WT and MTAP-deleted cells treated with 200 nmol/L AM-9747 or 10 μmol/L EPZ for 6 days. B, Cell cycle analysis in WT or MTAP-deleted DLBCL cells or (C) solid tumor cell lines after 6 days of treatment with 100 nmol/L AM-9747. Comet assays to detect DNA damage in DOHH-2 DLBCL cells (D) or BxPC-3 pancreatic cells after treatment with 100 nmol/L AM-9747 (E). Comet tail length is quantified in the right hand of D and E. F, Representative high-content images of HCT116 MTAP-deleted cells (top) and HCT116 WT cells (bottom) treated with a dose titration of AM-9747 for 6 days. Cells were pulsed with EDU and stained with relevant antibodies before image acquisition. EPZ, EPZ015666; MTAP, methylthioadenosine phosphorylase; WT, wild-type.
Figure 3.
Figure 3.
AMG 193 sensitivity profiling across a barcoded cancer cell line library. A, AMG 193 sensitivity profile shown by AUC across a panel of barcoded cancer cell lines after 5 days of treatment with DMSO or AMG 193 (eight-point concentration range). Cell viability was determined by the relative abundance of each cell line barcode. B, AMG 193 AUCs vs. tumor lineage type. The red line indicates the average per group. C, AMG 193 AUC vs. MTAP status across all lineages, pancreatic, lung, or lymphoma. The dotted line indicates the average. D, AMG 193 AUC vs. RNAi knockdown (left) or CRISPR KO (right) for PRMT5 and WDR77 with the associated Pearson correlation value and P-value. E, AMG 193 AUC vs. copy number (left) or RNA expression (right) for MTAP, CDKN2A, and CDKN2B with the associated Pearson correlation value and P-value. F, AS events identified by SplAdder across all MTAP-deleted cell lines (left). AMG 193associated AS events (right). One-side Fisher exact test P < 2 × 10⁻¹⁶. G, Heatmap showing Pearson correlations of intron retention events and log2AUC of AMG 193 across MTAP-deleted PRISM cell line panel. *, P < 0.05; **, P < 0.01; ***, P < 0.001; ****, P < 0.0001. AS, alternative splicing; CDKN2, cyclin-dependent kinase inhibitor 2; CRISPR, clustered regularly interspaced short palindromic repeats; KD, knockdown; KO, knockout; MTAP, methylthioadenosine phosphorylase; PRMT5, protein arginine methyltransferase 5; qVal, q-value; RNAi, ribonucleic acid interference; WDR77, WD repeat-containing protein 77; WT, wild-type.
Figure 4.
Figure 4.
AMG 193 inhibits the growth of MTAP-deleted tumors in vivo. A, SDMA ELISA analysis of HCT116 MTAP WT and MTAP-null bilateral tumors. Mice were administered a total of 4 doses, and tumors were collected 4 hours after the last dose. Percentage of inhibition reported relative to the matched vehicle. AMG 193 was quantified using LC-SRM MS methods for both plasma and tumor homogenate samples. Data represent mean ± SEM, n = 5 for each group. Statistical analysis by one-way ANOVA with Dunnett comparison to control; **, P = 0.001; ****, P < 0.0001. Mice with (B) HCT116 MTAP WT tumors and (C) HCT116 MTAP-deleted tumors were treated with AMG 193. D, Terminal HCT116 MTAP-deleted tumor SDMA analysis. E, Terminal blood SDMA analysis from mice bearing HCT116 MTAP-deleted tumors (from C). F, Correlation of HCT116 MTAP-deleted TGI (from C) to blood SDMA inhibition (from E). Performed simple linear regression analysis to determine R2 value. G, Mice with H838 tumors were treated with AMG 193. H, Terminal H838 tumor SDMA analysis. I, Terminal blood plasma taken at 2, 4, 8, 16, and 24 hours after the last dose. Plasma taken from H838 CDX (G). The in vitro H838 IC50 is noted by the dotted line. PDXs (J) pancreatic tumors (K) lung tumors (L) melanoma tumors (M) esophageal tumors, were treated with AMG 193. CDX and PDX efficacy data and dosing regimen are as follows: mice were administered vehicle or AMG 193 PO QD for the duration of the study. Data represent group means ± SEM, n = 10. STATS: P-values were determined by linear mixed-effects model with a Dunnett comparison to control; ****, P < 0.0001. Terminal SDMA assessment in tumor (ELISA) and blood (flow cytometry) data represent mean ± SEM, n = 5 for each group. Statistical analysis by one-way ANOVA with Dunnett comparison to control; ****, P < 0.0001. CDX, cell line–derived xenografts; MTAP, methylthioadenosine phosphorylase; PDX, patient-derived xenograft; PO, orally; QD, daily; RLU, relative light unit; SDMA, symmetric dimethylarginine; SEM, standard error of the mean; TGI, tumor growth inhibition; TR, tumor regression; WT, wild-type.
Figure 5.
Figure 5.
AM-9747 results in cell cycle arrest and an increase in the DDR in DOHH-2 tumors with no effect on circulating blood cells. A–E, Female SCID mice were implanted with DOHH-2 tumors. Once tumors reached ∼115 mm3 mice were treated with either vehicle or AM-9747 at 100 mg/kg or noncooperative PRMT5i LLY-283 at 30 mg/kg. Mice were administered doses of PO QD for the duration of the study. A cohort of tumors was harvested on Day 11, and data represent group means ± SEM, n = 5. A, DOHH-2 tumor volumes. B, Mouse body weight. C, Disaggregated tumors were costained for DAPI and analyzed via flow cytometry. D, Bone marrow, blood, and disaggregated tumors were stained for SDMA or γH2AX. E, Bone marrow progenitor populations were stained and analyzed via flow cytometry. F, Cardiac bleeds were performed and analyzed on ADVIA. Statistical analysis by ordinary one-way ANOVA with Tukey multiple comparisons test. *, P < 0.05; **, P < 0.01; ***, P < 0.001; ****, P < 0.0001. γH2AX, phosphorylated histone H2AX; CLP, common lymphoid progenitor; DAPI, 4′,6-diamidino-2-phenylindole; DOHH-2, human B-cell lymphoma cell line; GMP, granulocyte-macrophage progenitors; MEP, megakaryocyte-erythrocyte progenitors; MFI, mean fluorescent intensity; NS, not significant; PLT, platelets; PO, orally; PRMT5i, protein arginine methyltransferase 5 inhibitor; QD, daily; RETIC, reticulocytes; SCID, severe combined immunodeficiency; SDMA, symmetric dimethylarginine; SEM, standard error of the mean; WBCP, white blood cell population.
Figure 6.
Figure 6.
AMG 193 combination treatment with SOC chemotherapy or KRAS G12C inhibitor sotorasib significantly inhibits tumor growth in MTAP-deleted xenografts. A, Heatmap of minimum CI scores generated for AMG 193 combinations with indicated chemotherapies in a panel of cancer cell lines after 6 days of combination treatment. CI < 1 = synergy; CI = 1 = additivity; CI > 1 = antagonism (B and C) Female nude mice were implanted with H292 (NSCLC CDX) tumors. Vehicle and AMG 193 were administered PO QD for the duration of the study. B, Paclitaxel was administered IP starting on day 10 and then administered doses every other day for a total of 5 doses. C, Carboplatin was administered IP starting on day 10 and then administered doses weekly for a total of 3 doses. D–F, Female nude mice were implanted with MIAPACA2 (PDAC CDX) tumors, LU99 (NSCLC CDX) tumors, or LU5268 (NSCLC PDX) tumors, respectively, and vehicle, AMG 193 and sotorasib were administered PO QD for the duration of the study. Data represent mean ± SD, n = 10 for each group. P-values were determined by a linear mixed-effects model with a Tukey all-groups comparison, combination vs. either single agent; **, P < 0.01; ***, P < 0.001; ****, P < 0.0001. CDX, cell line–derived xenografts; CI, combination index; D, day; IP, intraperitoneally; KRAS, Kirsten rat sarcoma virus; MTAP, methylthioadenosine phosphorylase; NOD, nonobese diabetic; NSCLC, non–small cell lung cancer; PO, orally; QD, daily; SCID, severe combined immunodeficiency; TGI, tumor growth inhibition; TR, tumor regression.
Figure 7.
Figure 7.
AMG 193 treatment in patients with MTAP-deleted cancers decreases tumor volume and plasma ctDNA levels. The measurements described in the figures are from central radiology review annotations. Tumor measurements and overall response assessments from central radiologists may be different from those described by the site investigator or radiologist. A, A patient with Sertoli–Leydig ovarian tumor with a liver lesion measuring 83.9 × 56.3 mm at baseline decreased to 31.3 × 18.0 mm at Week 32. B, Patient with squamous cell NSCLC with left lower lobe lung lesion measuring 16.4 × 12.3 mm at baseline decreased to 14.3 × 10.7 mm at Week 16. C, The inhibition of PRMT5-mediated SDMA modification in tumor biopsy of the patient with squamous NSCLC was observed after 1 month of treatment with AMG 193. Pretreatment and Cycle 2 Day 1 tumor biopsies were subjected to SDMA protein expression staining using IHC. Adjacent slides were also stained with H&E. The SDMA H-scores were determined by a pathologist. In the pretreatment (Pre-Tx) sample, all viable cells exhibited positive nuclear staining with an H-Score of 300. In the after-treatment (After-Tx) sample, no SDMA expression was detected in cancer cells, with an H-Score of 0. D, The monitoring of serial circulating tumor DNA levels utilizing the tumor methylation score for quantifying the tumor fraction in the patient with squamous NSCLC. The figure illustrates the time course of plasma levels of ctDNA (blue line) and imaging assessments expressed as sum of long diameter (SLD; red line) throughout the treatment. Levels of ctDNA are presented as the percentage of changes relative to the baseline. A ctDNA negativity response was observed after one cycle, and ctDNA negativity was sustained at Cycle 3 Day 1. ctDNA, circulating tumor deoxyribonucleic acid; H&E, hematoxylin and eosin; NSCLC, non–small cell lung cancer; PRMT5, protein arginine methyltransferase 5; SDMA, symmetric dimethylarginine.

References

    1. Bedard PL, Hyman DM, Davids MS, Siu LL. Small molecules, big impact: 20 years of targeted therapy in oncology. Lancet 2020;395:1078–88. - PubMed
    1. Lucchesi JC. Synthetic lethality and semi-lethality among functionally related mutants of drosophila melanfgaster. Genetics 1968;59:37–44. - PMC - PubMed
    1. Bryant HE, Schultz N, Thomas HD, Parker KM, Flower D, Lopez E, et al. . Specific killing of BRCA2-deficient tumours with inhibitors of poly(ADP-ribose) polymerase. Nature 2005;434:913–7. - PubMed
    1. Farmer H, McCabe N, Lord CJ, Tutt AN, Johnson DA, Richardson TB, et al. . Targeting the DNA repair defect in BRCA mutant cells as a therapeutic strategy. Nature 2005;434:917–21. - PubMed
    1. Lord CJ, Ashworth A. PARP inhibitors: synthetic lethality in the clinic. Science 2017;355:1152–8. - PMC - PubMed

MeSH terms

Substances