Clinical Trial
. 2025 Jan 2;392(1):11-22.
doi: 10.1056/NEJMoa2407417. Epub 2024 Sep 15.

Final, 10-Year Outcomes with Nivolumab plus Ipilimumab in Advanced Melanoma

Collaborators, Affiliations
Clinical Trial

Final, 10-Year Outcomes with Nivolumab plus Ipilimumab in Advanced Melanoma

Jedd D Wolchok et al. N Engl J Med. .

Abstract

Background: Previous results from this trial showed longer overall survival after treatment with nivolumab plus ipilimumab or with nivolumab monotherapy than with ipilimumab monotherapy in patients with advanced melanoma. Given that patients with advanced melanoma are living longer than 7.5 years, longer-term data were needed to address new clinically relevant questions.

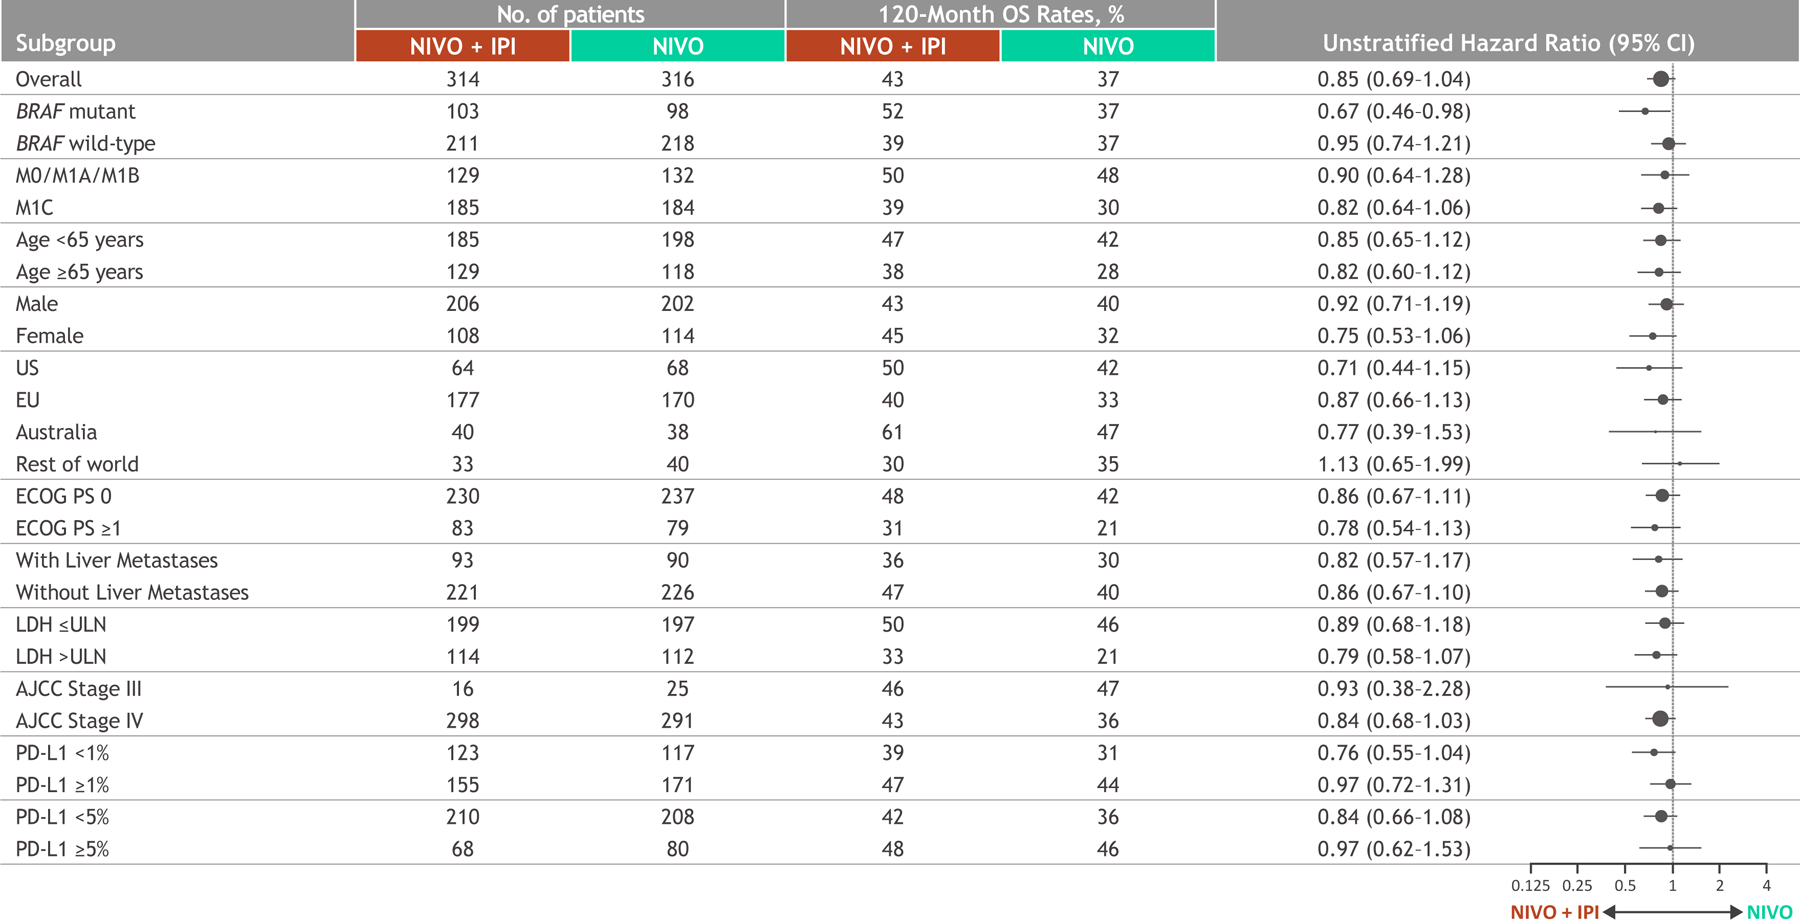
Methods: We randomly assigned patients with previously untreated advanced melanoma, in a 1:1:1 ratio, to one of the following regimens: nivolumab (1 mg per kilogram of body weight) plus ipilimumab (3 mg per kilogram) every 3 weeks for four doses, followed by nivolumab (3 mg per kilogram) every 2 weeks; nivolumab (3 mg per kilogram) every 2 weeks plus placebo; or ipilimumab (3 mg per kilogram) every 3 weeks for four doses plus placebo. Treatment was continued until the occurrence of disease progression, unacceptable toxic effects, or withdrawal of consent. Randomization was stratified according to BRAF mutation status, metastasis stage, and programmed death ligand 1 expression. Here, we report the final, 10-year results of this trial, including results for overall survival and melanoma-specific survival, as well as durability of response.

Results: With a minimum follow-up of 10 years, median overall survival was 71.9 months with nivolumab plus ipilimumab, 36.9 months with nivolumab, and 19.9 months with ipilimumab. The hazard ratio for death was 0.53 (95% confidence interval [CI], 0.44 to 0.65) for nivolumab plus ipilimumab as compared with ipilimumab and was 0.63 (95% CI, 0.52 to 0.76) for nivolumab as compared with ipilimumab. Median melanoma-specific survival was more than 120 months with nivolumab plus ipilimumab (not reached, with 37% of the patients alive at the end of the trial), 49.4 months with nivolumab, and 21.9 months with ipilimumab. Among patients who had been alive and progression-free at 3 years, 10-year melanoma-specific survival was 96% with nivolumab plus ipilimumab, 97% with nivolumab, and 88% with ipilimumab.

Conclusions: The final trial results showed a continued, ongoing survival benefit with nivolumab plus ipilimumab and with nivolumab monotherapy, as compared with ipilimumab monotherapy, in patients with advanced melanoma. (Funded by Bristol Myers Squibb and others; CheckMate 067 ClinicalTrials.gov number, NCT01844505.).


Figures

FIGURE 1
FIGURE 1. Overall Survival, Melanoma-Specific Survival and Progression-Free Survival in the Intention-to-Treat Population.
Panel A shows overall survival among the intention-to-treat population. Panel B shows melanoma-specific survival among the intention-to-treat population. Melanoma-specific survival was a post-hoc analysis. Panel C shows progression-free survival among the intention-to-treat population. After 36-months, there were 38 total reported events for the progression-free survival analysis - 19 new progressions, 2 deaths due to melanoma without documented progression, and 17 deaths due to non-melanoma causes without progression; of those, 21 occurred after 60 months (8 new progressions, 2 deaths due to melanoma without documented progression, and 11 deaths due to non-melanoma causes without documented progression). Confidence interval widths have not been adjusted for multiplicity and should not be used in place of hypothesis testing. NIVO denotes nivolumab, IPI ipilimumab, and HR hazard ratio. *Descriptive comparison A. Overall Survival Among Intention-to-Treat Population B. Melanoma-Specific Survival Among Intention-to-Treat Population C. Progression-Free Survival Among Intention-to-Treat Population
FIGURE 2
FIGURE 2. Overall Survival and Melanoma-Specific Survival by BRAF Mutation Status
Panels A and B show overall survival in the intention-to-treat population among patients with BRAF mutations and among patients without BRAF mutations, respectively. Panels C and D show melanoma-specific survival in the intention-to-treat population among patients with BRAF mutations and among patients without BRAF mutations, respectively. Melanoma-specific survival was a post-hoc analysis. Confidence interval widths have not been adjusted for multiplicity and should not be used in place of hypothesis testing. NIVO denotes nivolumab, IPI ipilimumab, HR hazard ratio, and NR not reached. *Descriptive comparison A. Overall Survival Among Intention-to-Treat Population with BRAF Mutations B. Overall Survival Among Intention-to-Treat Population without BRAF Mutations C. Melanoma-Specific Survival Among Intention-to-Treat Population with BRAF Mutations D. Melanoma-Specific Survival Among Intention-to-Treat Population without BRAF Mutations
FIGURE 3
FIGURE 3. Forest Plot of Overall Survival in Subgroups.
Panel A shows overall survival with nivolumab plus ipilimumab versus ipilimumab monotherapy. Panel B shows overall survival with nivolumab monotherapy versus ipilimumab monotherapy. Panel C shows overall survival with nivolumab plus ipilimumab versus nivolumab monotherapy (descriptive comparison). The x-axes are shown on a logarithmic scale. Confidence interval widths have not been adjusted for multiplicity and should not be used in place of hypothesis testing. All of these subgroups were prespecified, with the exception of baseline liver metastasis, which was a post-hoc analysis. OS denotes overall survival, NIVO nivolumab, IPI ipilimumab, M metastasis, US United States, EU European Union, ECOG Eastern Cooperative Oncology Group, LDH lactate dehydrogenase, AJCC American Joint Committee on Cancer (7th edition), PD-L1 programmed cell death ligand 1, and ULN upper limit of normal. A. Nivolumab plus Ipilimumab Versus Ipilimumab B. Nivolumab Versus Ipilimumab C. Nivolumab plus Ipilimumab Versus Nivolumab
FIGURE 4.
FIGURE 4.. Overall Survival and Melanoma-Specific Survival in Patients with Progression-Free Survival at 3-Years.
Panels A and B show overall and melanoma-specific survival in patients who were progression-free at 3-years, respectively. Melanoma-specific survival was a post-hoc analysis. Confidence interval widths have not been adjusted for multiplicity and should not be used in place of hypothesis testing. NIVO denotes nivolumab, IPI ipilimumab, and NR not reached. A. Overall Survival B. Melanoma-Specific Survival
FIGURE 5
FIGURE 5. Best Tumor Burden Reduction, and Overall Survival by Best Depth of Response.
Panels A depicts waterfall plots showing best tumor burden reduction by treatment group where each vertical bar represents one patient. Panel B shows overall survival by best tumor burden reduction within each treatment arm. The analysis included patients with target lesion(s) at baseline and at least one on-treatment tumor assessment up to progression or start of subsequent therapy. Best tumor burden reduction is maximum reduction in sum of diameters of evaluable target lesions (negative value means true reduction, positive value means increase only observed over time). First horizontal reference line indicates the 30% reduction consistent with a RECIST 1.1 response. Asterisk symbol represents responders. Square symbol represents % change truncated to 100%. Two patients with best overall response of “partial response” and best reduction in target lesions per investigator <30% were excluded from the analysis. Confidence interval widths have not been adjusted for multiplicity and should not be used in place of hypothesis testing. NIVO denotes nivolumab, IPI ipilimumab, HR hazard ratio, NR not reached, CR complete response, PR partial response, SD stable disease, and PD progressive disease. A. Best Tumor Burden Reduction B. Overall Survival by Best Depth of Response

Comment in

References

    1. Hodi FS, O’Day SJ, McDermott DF, et al. Improved survival with ipilimumab in patients with metastatic melanoma. N Engl J Med 2010;363:711–23. - PMC - PubMed
    1. Postow MA, Chesney J, Pavlick AC, et al. Nivolumab and ipilimumab versus ipilimumab in untreated melanoma. N Engl J Med 2015;372:2006–17. - PMC - PubMed
    1. Schadendorf D, Hodi FS, Robert C, et al. Pooled analysis of long-term survival data from phase II and phase III trials of ipilimumab in unresectable or metastatic melanoma. J Clin Oncol 2015;33:1889–94. - PMC - PubMed
    1. Robert C, Long GV, Brady B, et al. Nivolumab in previously untreated melanoma without BRAF mutation. N Engl J Med 2015;372:320–30. - PubMed
    1. Robert C, Schachter J, Long GV, et al. Pembrolizumab versus ipilimumab in advanced melanoma. N Engl J Med 2015;372:2521–32. - PubMed

MeSH terms

Associated data