. 2024 Sep 16;148(1):43.
doi: 10.1007/s00401-024-02794-y.

Dysregulated FOXO1 activity drives skeletal muscle intrinsic dysfunction in amyotrophic lateral sclerosis

Affiliations

Dysregulated FOXO1 activity drives skeletal muscle intrinsic dysfunction in amyotrophic lateral sclerosis

Mónica Zufiría et al. Acta Neuropathol. .

Abstract

Amyotrophic Lateral Sclerosis (ALS) is a multisystemic neurodegenerative disorder, with accumulating evidence indicating metabolic disruptions in the skeletal muscle preceding disease symptoms, rather than them manifesting as a secondary consequence of motor neuron (MN) degeneration. Hence, energy homeostasis is deeply implicated in the complex physiopathology of ALS and skeletal muscle has emerged as a key therapeutic target. Here, we describe intrinsic abnormalities in ALS skeletal muscle, both in patient-derived muscle cells and in muscle cell lines with genetic knockdown of genes related to familial ALS, such as TARDBP (TDP-43) and FUS. We found a functional impairment of myogenesis that parallels defects of glucose oxidation in ALS muscle cells. We identified FOXO1 transcription factor as a key mediator of these metabolic and functional features in ALS muscle, via gene expression profiling and biochemical surveys in TDP-43 and FUS-silenced muscle progenitors. Strikingly, inhibition of FOXO1 mitigated the impaired myogenesis in both the genetically modified and the primary ALS myoblasts. In addition, specific in vivo conditional knockdown of TDP-43 or FUS orthologs (TBPH or caz) in Drosophila muscle precursor cells resulted in decreased innervation and profound dysfunction of motor nerve terminals and neuromuscular synapses, accompanied by motor abnormalities and reduced lifespan. Remarkably, these phenotypes were partially corrected by foxo inhibition, bolstering the potential pharmacological management of muscle intrinsic abnormalities associated with ALS. The findings demonstrate an intrinsic muscle dysfunction in ALS, which can be modulated by targeting FOXO factors, paving the way for novel therapeutic approaches that focus on the skeletal muscle as complementary target tissue.

Keywords: Amyotrophic lateral sclerosis; FOXO1; FUS; Glycolysis; Myogenesis; TDP-43.


Conflict of interest statement

SD is a named inventor on patents related to neurological disorders. MZuf, ALM, GG, FGB, and SAM are co-inventors of patent PCT/EP2021/064274 and therefore entitled to a share of royalties. MZuf, LB, ALM, GGL, FGB, and SAM also have ownership in Miaker Developments S.L., which is the licensee of that patent related to the research being reported. The terms of this arrangement have been reviewed and approved by the University of the Basque Country and Biogipuzkoa Health Research Institute/BIOEF (representing the Basque public administration), as co-owners of the patent.

Figures

Fig. 1
Fig. 1
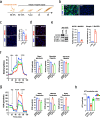
Pathological and functional abnormalities of primary myoblasts from ALS patients. a Representative images of primary myoblasts from ALS patients, both familial (fALS) and sporadic ALS (sALS) and healthy controls (CTRL) stained for Myosin Heavy Chain (MyHC, green) and DAPI (nuclei, blue). b Quantitative scatter plots with bar graphs showing fusion and differentiation indices of each individual's cells from at least n = 3 independent differentiation assays. The inner plots depict the comparison of the average values of each ALS patient group (fALS and sALS) with the average values of the CTRL group. c The correlation plot shows a negative association between age and the differentiation index in CTRL myoblasts (r = − 0.61, p = 0.059), indicating that as age increases, the differentiation index tends to decrease. In contrast, there is no significant association in ALS myoblasts (r = − 0.33, p = 0.214). When the outlier value (fALS_2), identified by Grubb’s test, is removed, the correlation in ALS* myoblasts becomes r = 0 (p = 0.520), suggesting no relationship between age and differentiation index. Bar graphs represent mean ± SEM. *p < 0.05 compared to the CTRL group via Mann–Whitney U test. Scale bar: 100 μm. d Representative Western blot images of TDP-43 and FUS proteins in CTRL and ALS proliferative myoblasts, and scatter dot-plots with bar graphs depicting the quantification of protein levels. n = 8 for the CTRL group and n = 6 for the ALS group. *p < 0.05 compared to the CTRL group via Mann–Whitney U test for FUS and Student’s t test for TDP-43 following normalisation criteria
Fig. 2
Fig. 2
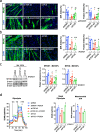
Functional consequences of TDP-43 or FUS silencing in the immortalised human control myoblasts. a Schematic diagram of the myogenic process showing the different phases under study, as well as the interventions and measures performed. b Representative Western blot images of TDP-43, FUS, MYOD1, and MYOG in shTDP-43 or shFUS-silenced myoblasts at 100% confluence (Mb 100%) and at 3 days after fusion (D3), and scatter dot-plots with bar graphs showing the quantification of protein levels. n = 3–6 transductions per group. c Representative images of human immortalised myoblasts stained for MyHC (Myosin heavy chain, green) and DAPI (nuclei, blue), and quantitative scatter plots with bar graphs showing fusion and differentiation indices. Immunofluorescence was performed 8 days (D8) after the first fusion events of shRNA cells. Scale bar: 100 μm. n = 6–11 images per group. d Proliferation curve measured as the fold-change in the number of DAPI-positive nuclei at days 1, 3, and 5 after cell seeding. n = 4–5 images per group. e Representative Western blot images of Atrogin-1 and MURF1 in TDP-43- or shFUS-silenced myoblasts at Mb 100%, and scatter plots with bar graphs showing the quantification of protein levels. n = 3 infections per group. Bar graphs represent mean ± SEM. *p < 0.05; **p < 0.01 compared to the shRNA group via one-way ANOVA. a.u., arbitrary units
Fig. 3
Fig. 3
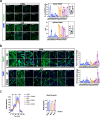
Metabolic alterations of TDP-43 or FUS silencing in the immortalised human control myoblasts. a Schematic diagram of the myogenic process illustrating the different phases under study, as well as the intervention point for glycolysis repression and the measures performed throughout the experiment. b Representative images of myogenic differentiation following 2-deoxyglucose (2-DG) treatment at day 3 after fusion (D3). Myoblasts were stained for Myosin Heavy Chain (MyHC, green) and DAPI (nuclei, blue). Scale bar: 100 μm. c MYOG protein expression after 2-DG treatment at 100% confluence (Mb 100%). Representative images of myoblasts stained for MYOG (red) and DAPI (blue). Scatter plots with bar graphs quantify the percentage of MYOG-positive nuclei. ImageJ software (v2.9) was used to quantify the images, with DAPI staining defining the nuclear boundaries. A nucleus was considered positive for MYOG if its staining intensity was greater than the mean + 1*SD of the control (CTRL) values. n = 6–7 images per group. Scale bar: 100 μm. d MYOD protein expression after 2-DG treatment at Mb 100%. Representative images of myoblasts stained for MYOD (red) and DAPI (blue). n = 6–7 images per group. Scale bar: 100 μm. e Representative Western blot images of MYOD and Atrogin-1 protein levels, and scatter dot-plots with bar graphs showing the quantification of protein levels. Myoblasts were treated with 2-DG at Mb 100%. n = 3 treatments per group. Data are expressed as mean ± SEM. *p < 0.05; **p < 0.01 compared to the Mb 100% group via Mann–Whitney U test. a.u., arbitrary units; CTRL, untreated control. f–h Graphs for Extracellular Acidification Rate (ECAR) (f), Oxygen Consumption Rate OCR (g), and ATP production rate (h) of silenced myoblasts (shRNA, shTDP-43 or shFUS). The corresponding quantification of basal glycolysis, glycolytic capacity, glycolytic reserve, basal respiration, maximal respiration, and spare respiration are presented on the right side of panels (f) and (g), respectively. Analyses were performed 1 day after seeding myoblasts at Mb 100%. n = 4, 3, and 1 independent experiments, respectively. gluc, Glucose; olig, Oligomycin; FCCP, Carbonyl cyanide p-(trifluoromethoxy) phenylhydrazone; rot/AA, Rotenone/Antimycin A. Bar graphs represent mean ± SEM. *p < 0.05; **p < 0.01 compared to the shRNA group via one-way ANOVA
Fig. 4
Fig. 4
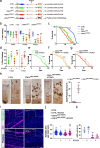
FOXO transcription factors and related signalling pathways are dysregulated upon TDP-43 or FUS silencing. a Venn diagram illustrates the number of overlapped differentially expressed genes (DEGs) between the shTDP-43 and the shFUS-silenced myoblasts at 100% confluence. b Scatterplot for log2-transformed fold changes of the overlapping DEGs, showing a significant correlation between shTDP-43 and shFUS-silenced myoblasts. R2 and linear function are indicated in the graph. Genes upregulated and downregulated in both datasets are indicated in red and blue, respectively. The grey shade area represents the 95% confidence interval. c Bubble chart of ranked enrichment analysis of shTDP-43 plotted against shFUS gene expression signatures using the Hallmark database by the GSEA multilevel enrichment test; GSEA score rank is based on normalised enrichment score (NES) and − log10FDR p value for each gene set. Bubble size represents the average − log10FDR p value. Gene sets upregulated and downregulated in both shTDP-43 and shFUS myoblasts are indicated in red and blue, respectively. Enrichment analysis of gene expression signatures using KEGG, GO Biological Process, and GO Molecular Function can be viewed in Supplementary Fig. 7. d Common transcription factors (TF) across the shTDP-43 and shFUS myoblasts with predicted significant activity change by ISMARA motif analysis (based on Z score and average gene target expression change). MYOG/TCF3, MYOD1, and MEF2A/C/D are highlighted among the TF motifs with downregulated target gene expression change (left panel). FOXO1/6, CREB1, TP53, MZF1, and PRDM1 are highlighted among the TF motifs with upregulated target gene expression change (right panel). e Representative images of human control immortalised myoblasts at 100% confluence stained for FOXO1 (green) and DAPI (nuclei, blue), and scatter dot-plot with a bar graph showing the percentage of cells positive for nuclear FOXO1 staining. Quantification was made with ImageJ v2.9 software using DAPI staining to delimit nuclei. Nuclei with integrated density values above the cut-off point (set as the value of mean + 1*SD of shRNA cells) were considered positive for FOXO1. Scale bars: 50 μm. n = 6–9 images per cell line. Scale bar: 25 μm. n = 3–4 images per group, 2 independent experiments. *p < 0.05, **p < 0.01 compared to the shRNA group via one-way ANOVA
Fig. 5
Fig. 5
FOXO1 inhibition corrects myogenic defects and metabolic derangements induced by deficiency of TDP-43 or FUS. a Representative images of TDP-43 or FUS-knockdown myoblasts treated or not with shFOXO1 lentiviral particles and stained for MyHC (Myosin heavy chain, green) and DAPI (nuclei, blue). Quantitative scatter plots with bar graphs showing differentiation and fusion indices (right). Scale bar: 50 μm. n = 5–6 images per group. b Representative images of TDP-43 or FUS-knockdown myoblasts treated or not with the selective FOXO1 inhibitor AS1842856 (iFOXO1) at 30 nM and stained for MyHC (green) and DAPI (blue). Quantitative scatter plots with bar graphs showing differentiation and fusion indices (right). Immunofluorescence was performed 8 days (D8) after the first fusion events of shRNA control cells. Scale bar: 50 μm. n = 5–6 images per group. c Representative Western blot images of MYOD1 and MYOG protein levels in shTDP-43 or shFUS-silenced myoblasts at 100% confluence (Mb 100%) treated with iFOXO, and scatter dot-plots with bar graphs showing the quantification of protein levels. n = 3–6 transductions per group. a.u., arbitrary units. d Representative graphs showing Extracellular Acidification Rate (ECAR) of TDP-43 or FUS-knockdown myoblasts treated or not with the selective iFOXO1 at 30 nM, and the basal glycolysis and basal respiration calculated by the data obtained in these analyses. Analyses were performed one day after seeding myoblasts at Mb 100%. n = 3 independent experiments. Bar graphs represent mean ± SEM. *p < 0.05; **p < 0.01 compared to the shRNA control group via one-way ANOVA; #p < 0.05; ##p < 0.01 compared to the non-treated group via one-way ANOVA. gluc, Glucose; olig, Oligomycin; 2-DG, 2-deoxyglucose; OCR, Oxygen Consumption Rate, FCCP, carbonyl cyanide p-(trifluoromethoxy) phenylhydrazone; rot/AA, Rotenone/Antimycin A
Fig. 6
Fig. 6
FOXO1 is dysregulated in primary myoblasts from ALS patients and its inhibition alleviates myogenic defects. a FOXO1 protein expression in myoblasts from ALS patients and controls. Left panel: Representative images of primary myoblasts at 100% confluence (Mb100%) from ALS patients, both familial (fALS) and sporadic ALS (sALS), and healthy controls (CTRL) stained for FOXO1 (green) and DAPI (nuclei, blue). Right panel shows a dual representation of FOXO1 staining: scatter plot showing the distribution of cells positive for nuclear FOXO1 (top), and bar graph depicting the mean optical density (OD) of cytosolic FOXO1 staining (bottom). Quantifications were done using ImageJ v2.9 software. DAPI staining was used to define nuclear boundaries. Nuclei with a staining intensity greater than the mean + 1*SD of CTRL values were considered positive for FOXO1. The inner plots depict the comparison of the average values of each ALS patient group (fALS and sALS) with the CTRL group. Bar graphs represent mean ± SEM. n = 3–5 images per group. *p < 0.05 compared to CTRL via Mann–Whitney U test. Scale bars: 100 μm. b Effect of FOXO1 inhibition on myogenic differentiation. Left panel: Representative images of primary myoblasts from ALS patients and CTRLs, treated or not (NT) with the selective FOXO1 inhibitor AS1842856 (iFOXO1) at 30 nM, stained for Myosin Heavy Chain (MyHC, green) and DAPI (nuclei, blue). Right panel: Quantitative scatter plot with bar graphs showing fusion and differentiation indices. Immunofluorescence was performed 8 days (D8) after the first fusion events observed in untreated CTRL cells. Scale bars: 100 μm. n = 5–6 images per group. Bar graphs represent mean ± SEM. *p < 0.05 compared to the NT group via Mann–Whitney U test. c Effect of FOXO1 inhibition on glycolysis in primary myoblasts. Representative graphs show the Extracellular Acidification Rate (ECAR) of primary myoblasts from a selection of ALS patients and an age-matched healthy CTRLs, treated or not with the selective iFOXO1 at 30 nM. The basal glycolysis and glycolytic capacity were calculated based on these analyses. Analyses were performed 1 day after seeding myoblasts at 100% confluence. n = 3 independent experiments. Bar graphs represent mean ± SEM. *p < 0.05, **p < 0.01 compared to the NT CTRL group via one-way ANOVA; ##p < 0.01 compared to the NT group via one-way ANOVA. gluc, Glucose; olig, Oligomycin; 2-DG, 2-deoxyglucose
Fig. 7
Fig. 7
FOXO1 inhibitor AS1842856 treatment reverses phenotypical-functional parameters in Drosophila melanogaster models with muscle-conditioned TDP-43/FUS downregulation. a Schematic illustration of the different fly models used in this study and the analyses performed. Flies were orally treated (feeding) with the FOXO1 inhibitor AS1842856 (iFOXO1) from the larval stage onwards. b Scatter dot-plots with median and interquartile range showing climbing activity of the different fly models on adult days 5, 10, and 15. n = 5 flies per tube, 10 tubes per group. Each value is calculated as the average of three trials. *p < 0.05; **p < 0.01 compared to control (CTRL) flies via one-way ANOVA. c Kaplan–Meier curves of caz- or TBPH-silenced flies. n = 100 flies per group; **p < 0.01 compared to any of the knockdown flies via log-rank test. d Scatter dot-plots with median and interquartile range showing climbing activity of the different fly models treated with iFOXO1 at 30 µM. n = 5 flies per tube, 9 tubes per group. Each value is calculated as the average of three trials. *p < 0.05; **p < 0.01 compared to non-treated flies via two-way ANOVA. e–g Kaplan–Meier curves of caz- (e) or TBPH-silenced flies (f-g) treated (feeding) with iFOXO1. n = 90 flies per group. *p < 0.05; **p < 0.01 compared to non-treated flies via log-rank test. h Representative images of pharate lethality in the fly model iTBPHpkk(108354) with or without treatment (feeding) with iFOXO1. Note that the pupae of CTRL flies are empty and adult flies are at the top of the tube. However, adult pharates of the iTBPHpkk(108354) model remain trapped inside the pupa. The scatter dot-plots with median and interquartile range in the right show the effect of iFOXO1 on adult pharate survival. n = 75 pupae per tube, 6 tubes per group. **p < 0.01 compared to non-treated flies via Student’s t test. i Representative images of Drosophila indirect flight muscles stained with Phalloidin (blue), neuronal marker HRP (pink), and Bruchpilot (green). Scale bar: 50 µm. Digitally zoomed images show Bruchpilot + synaptic boutons along motoneuron terminals. j, k Scatter dot-plots with median and interquartile range show the quantification of the synaptic area (j) and neuron (HRP +) density (k). n = 12 flies per group. **p < 0.01 compared to CTRL flies; ##p < 0.01 compared to iTBPHpkk(108354) flies via two-way ANOVA

Similar articles

Cited by

References

    1. Balwierz PJ, Pachkov M, Arnold P, Gruber AJ, Zavolan M, Van Nimwegen E (2014) ISMARA: automated modeling of genomic signals as a democracy of regulatory motifs. Genome Res 24:869–884. 10.1101/gr.169508.113 10.1101/gr.169508.113 - DOI - PMC - PubMed
    1. Banerjee A, Vest KE, Pavlath GK, Corbett AH (2017) Nuclear poly(A) binding protein 1 (PABPN1) and Matrin3 interact in muscle cells and regulate RNA processing. Nucleic Acids Res 45:10706–10725. 10.1093/NAR/GKX786 10.1093/NAR/GKX786 - DOI - PMC - PubMed
    1. Blasco H, Lanznaster D, Veyrat-Durebex C, Hergesheimer R, Vourch P, Maillot F et al (2020) Understanding and managing metabolic dysfunction in Amyotrophic Lateral Sclerosis. Expert Rev Neurother 20:907–919. 10.1080/14737175.2020.1788389 10.1080/14737175.2020.1788389 - DOI - PubMed
    1. Bois PRJ, Grosveld GC (2003) FKHR (FOXO1a) is required for myotube fusion of primary mouse myoblasts. EMBO J 22:1147–1157. 10.1093/EMBOJ/CDG116 10.1093/EMBOJ/CDG116 - DOI - PMC - PubMed
    1. Bour BA, O’Brien MA, Lockwood WL, Goldstein ES, Bodmer R, Taghert PH et al (1995) Drosophila MEF2, a transcription factor that is essential for myogenesis. Genes Dev 9:730–741. 10.1101/gad.9.6.730 10.1101/gad.9.6.730 - DOI - PubMed

Publication types

MeSH terms

Grants and funding