. 2025 Jan;54(1):86-104.
doi: 10.1007/s13280-024-02069-6. Epub 2024 Sep 16.

Heavy rainfalls in Poland and their hyetographs

Affiliations

Heavy rainfalls in Poland and their hyetographs

Karol Mikołajewski et al. Ambio. 2025 Jan.

Abstract

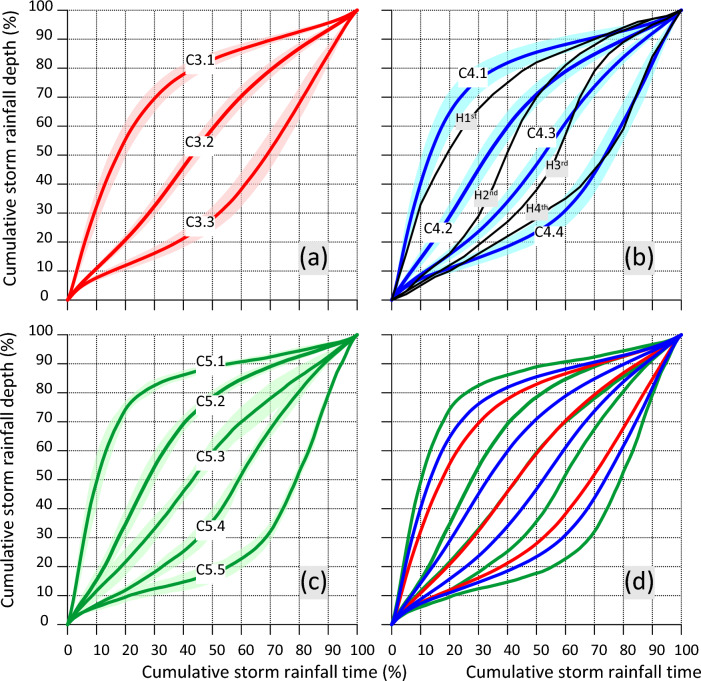
In the light of observed variability in precipitation patterns, there is a growing need for comprehensive data mining of regularly updated rainfall recording databases. Therefore, an analysis of heavy rainfall and hyetographs was conducted using a 30-year high-resolution dataset from 100 rain gauges across Poland, covering 31 646 rainfall events. Distributions of rainfall depths, durations, and intensities were explored, and maxima were compared to global records. Spatial analysis revealed significant variations in the frequency, depths, and durations of extreme rainfall across different regions. Cluster analysis determined model hyetographs for each station. The likelihood of regions belonging to clusters with three to five model hyetographs was assessed using Indicator Kriging. Findings underscore the importance of using local, characteristics rainfalls in hydrodynamic modelling of drainage systems and future rainfall scenarios. These results provide a foundational step towards understanding and monitoring the impacts of climate change on rainfall characteristics, especially extremes, in future decades.

Keywords: Classification quality assessment indices; Cluster analysis; Heavy rainfalls; Model hyetographs; Poland; Precipitation modelling.


Conflict of interest statement

Declarations. Conflict of interest: The authors declare no conflict of interest. The funding institution had no role in the design of the study, in the samples collection, analyses, interpretation of data, in the writing of the manuscript, and in the decision to publish the results.

Figures

Fig. 1
Fig. 1
Flowchart of the entire process of creating standard hyetographs and additionally conducted data analysis. The numbers in square brackets next to the individual components of the diagram serve as references in the descriptions of the stages of the methodology in the text
Fig. 2
Fig. 2
Set of 31 646 designated heavy rainfalls on the background of scale dependencies of maximum rainfalls recorded globally (Paulhus 1965), in Great Britain (Wilson 1990), and in Poland in selected stations during floods in the years 1997–2002 (Banasik 2005, 2009). Moreover, the diagram shows maximum phase rainfalls designated in the scope of the PANDa project on a network of a hundred stations in Poland for durations from 5 to 4320 min with their scale dependency
Fig. 3
Fig. 3
Scatter plot of ratios of depths of 31,646 designated heavy rainfalls to the corresponding normal precipitation in the duration function. Analogical ratios for maximum depths of interval (phase) rainfalls designated in the scope of the PANDa project in a network of a hundred stations in Poland for durations from 5 to 4320 min are also marked on the plot. The upper limiting scale dependencies were determined for both sets
Fig. 4
Fig. 4
Diagram a shows averaged dimensionless cumulative rainfall hyetographs for three clusters identified through k-means clustering using a 37-gauge subset in Poland (optimum cluster number: 3). Diagram b displays averaged dimensionless cumulative rainfall hyetographs for four clusters identified using a 58-gauge subset in Poland (optimum cluster number: 4), including a comparison with Huff's Median Time Distributions of Heavy Storm Rainfall at a Point (1990). Diagram c presents averaged dimensionless cumulative rainfall hyetographs for five clusters identified using a 5-gauge subset in Poland (optimum cluster number: 5). The mean values for each cluster are represented by lines on a semi-transparent background of standard deviation ribbons. Diagram d contains a summary of averaged cumulative precipitation hyetographs for all three subsets of gauge sites
Fig. 5
Fig. 5
Determined cluster numbers of model hyetographs on a grid of 100 analysed rain gauges in Poland on the background of climatic regions of Poland (Romer 1949). Explanations: A—Baltic climates, B—lakeland climates, C—climates of the “Land of Great Valleys”, D—climates of central uplands, E—climates of submontane lowlands and basins, F—mountain and submontane climates, G—mountain basin climate. Dotted lines are boundaries of lower order regional units
Fig. 6
Fig. 6
Interpolated spatial distributions of average long-term characteristics of heavy precipitation in the summer half-year. Explanations: A frequency of occurrence of heavy rainfalls (1/year), B mean duration of heavy rainfalls (h/year), C mean depth (total) of heavy rainfalls (mm/year). For better contrast, the colour scale covers a range from 1 to 99% of the variable distribution. The maps also include markings of the locations of sites for which 3, 4, or 5 model hyetographs of heavy rainfall have been established

References

    1. Alexander, L.V., X. Zhang, T.C. Peterson, J. Caesar, B. Gleason, A.M.C. Klein Tank, M. Haylock, D. Collins, et al. 2006. Global observed changes in daily climate extremes of temperature and precipitation. Journal of Geophysical Research 111: D05109. 10.1029/2005JD006290.
    1. Asadieh, B., and N.Y. Krakauer. 2015. Global trends in extreme precipitation: Climate models versus observations. Hydrology and Earth System Sciences 19: 877–891. 10.5194/hess-19-877-2015.
    1. Banasik, K., ed. 2005. Wydatek i charakterystyka rumowiska unoszonego w wezbraniach opadowychz obszarów rolniczych [Suspended sediment yield in flash floods from agricultural areas]. Research report. Warsaw, Poland: Warsaw Agricultural University (in Polish).
    1. Banasik, K., ed. 2009. Modelowanie katastrofalnych wezbrań opadowych w małych zlewniach rzecznych [Modelling of the catastrophic pluvial floods in small river basins]. Research report. Warsaw, Poland: Warsaw University of Life Sciences – SGGW (in Polish).
    1. Banasik, K., and J. Ostrowski. 2010. Estimation of extreme flood flows in a small Carpathian river. In Cultural landscapes of river valleys, ed. A. Radecki-Pawlik and J. Hernik, 221–227. Krakowie: Wydawnictwo Uniwersytetu Rolniczego.

LinkOut - more resources