. 2024 Sep 26;128(38):9183-9196.
doi: 10.1021/acs.jpcb.4c05020. Epub 2024 Sep 16.

Statistical Mechanical Theories of Membrane Permeability

Affiliations

Statistical Mechanical Theories of Membrane Permeability

Jonathan Harris et al. J Phys Chem B. .

Abstract

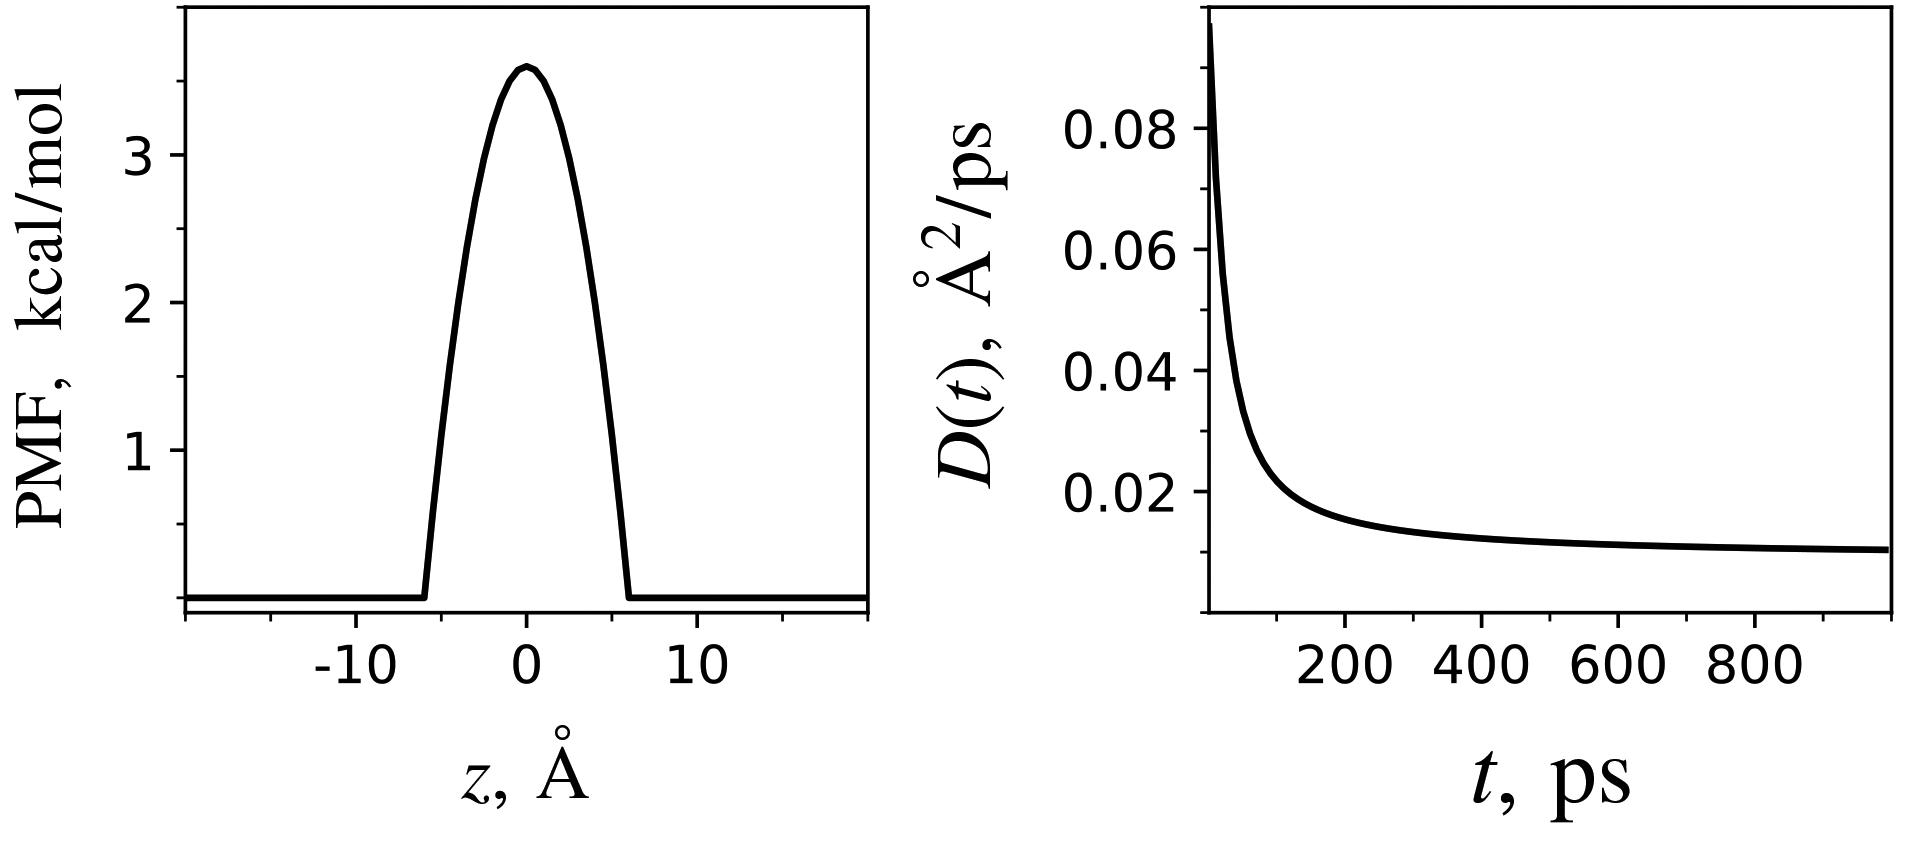
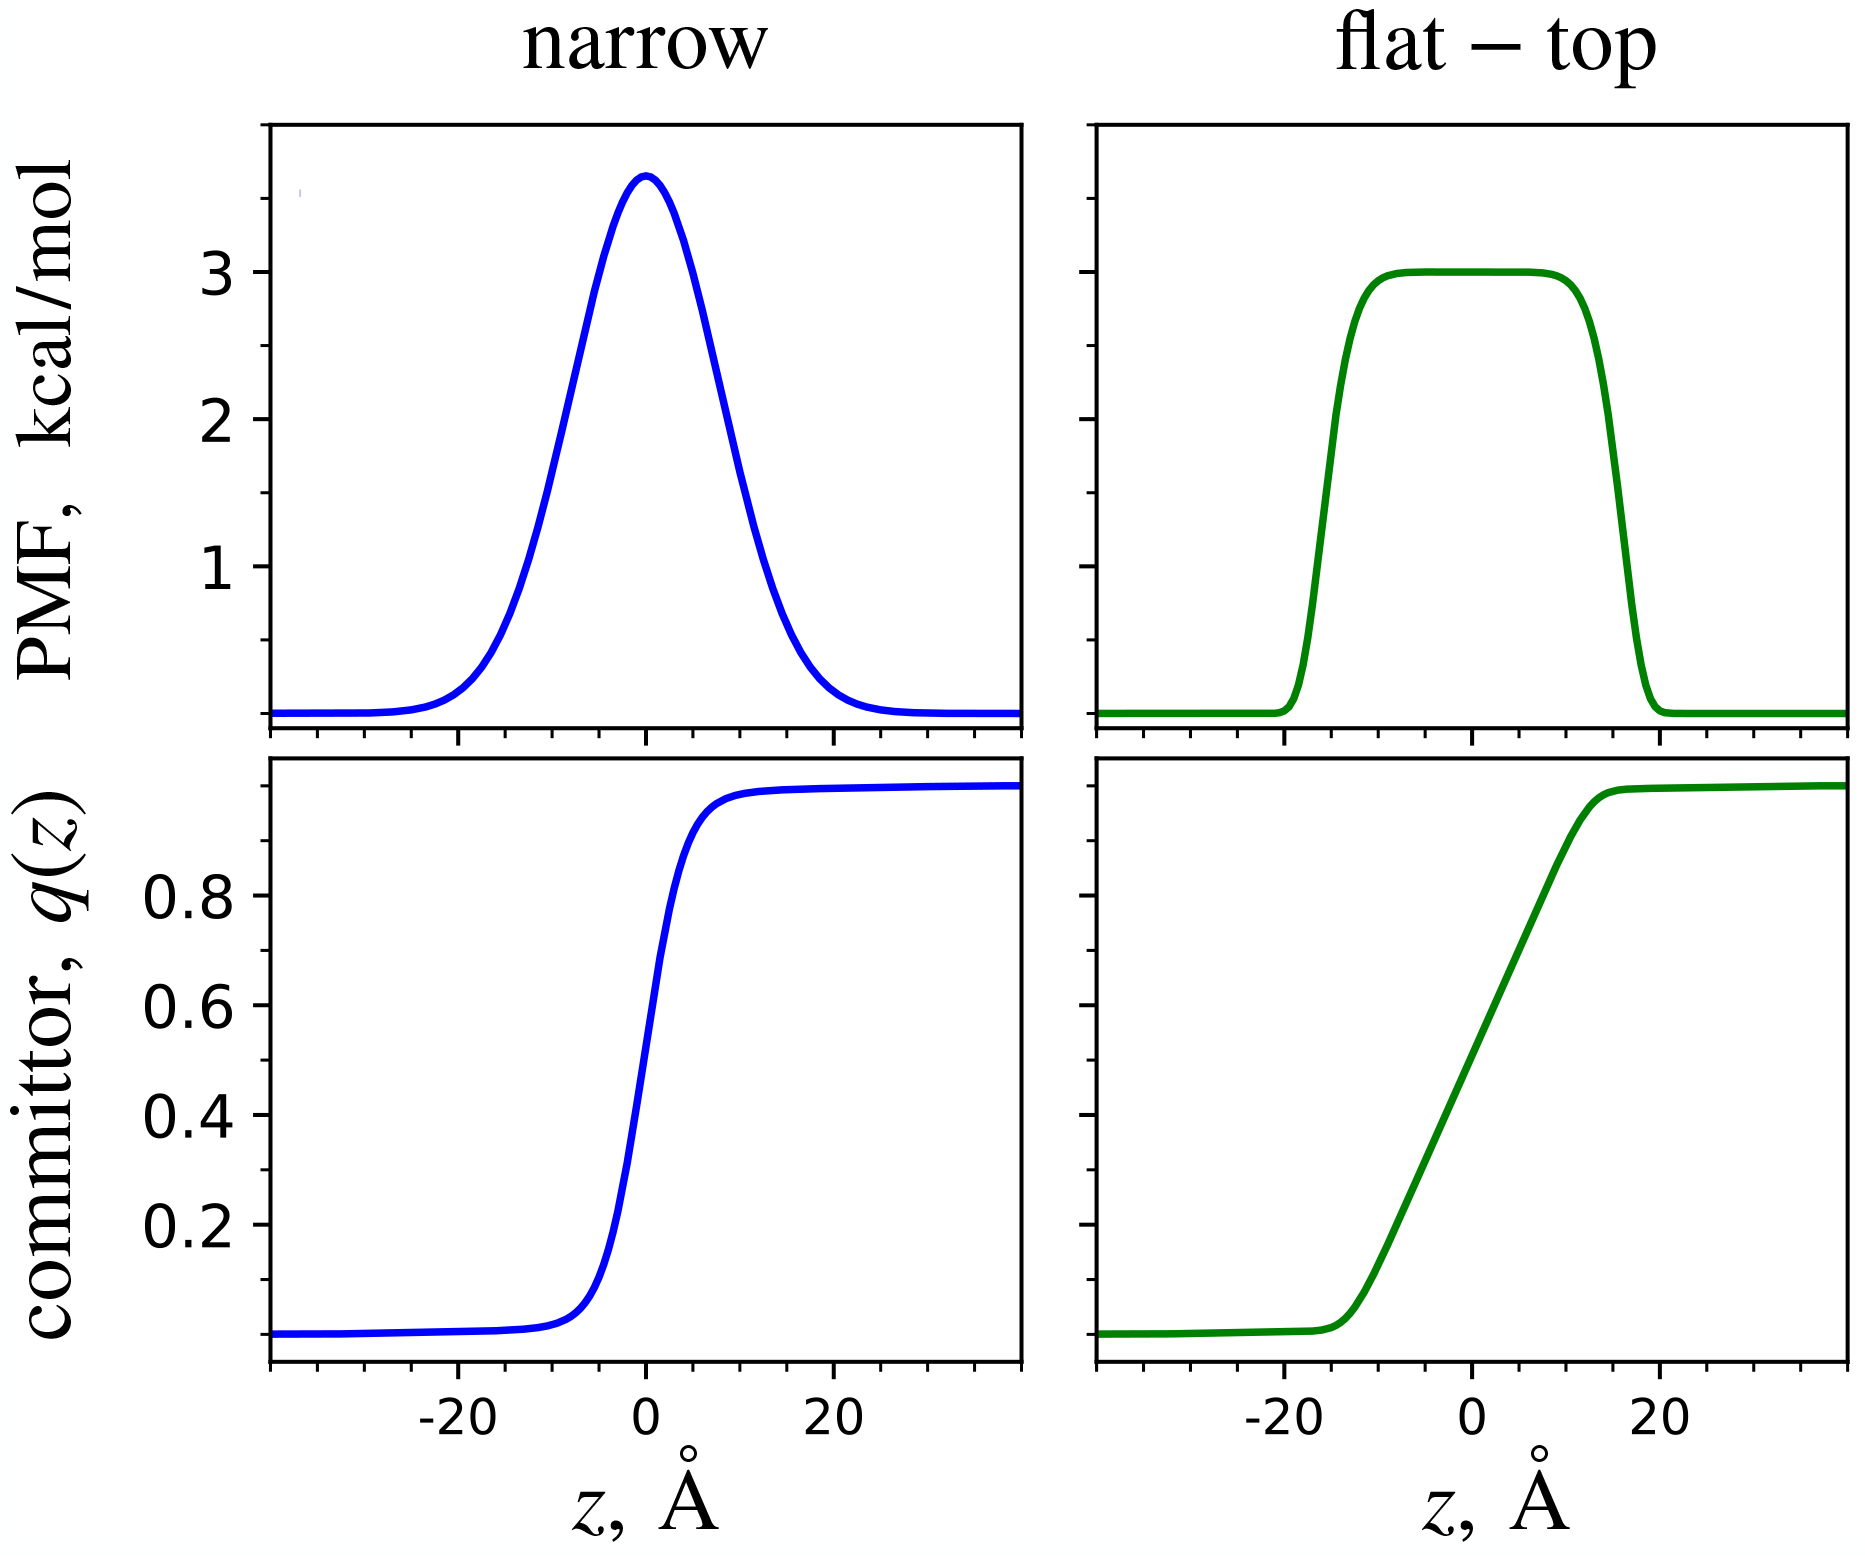
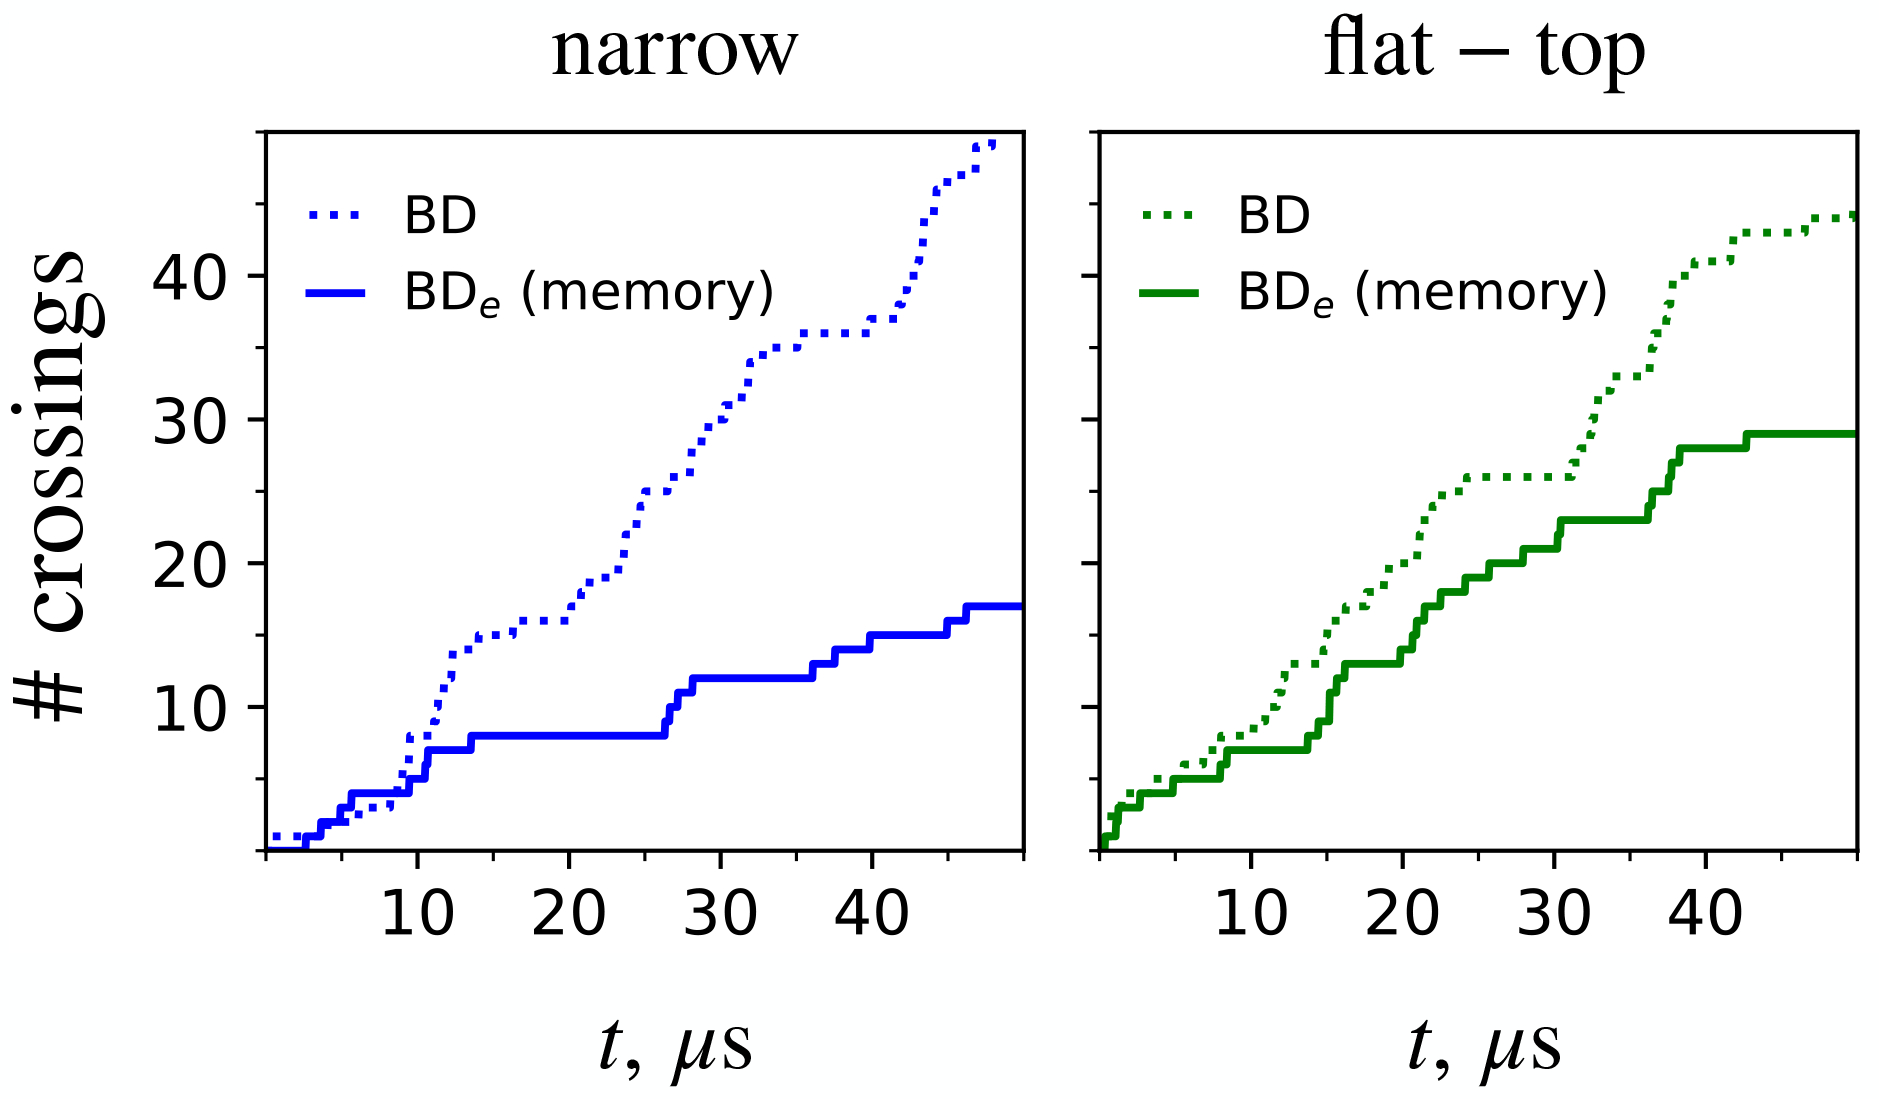
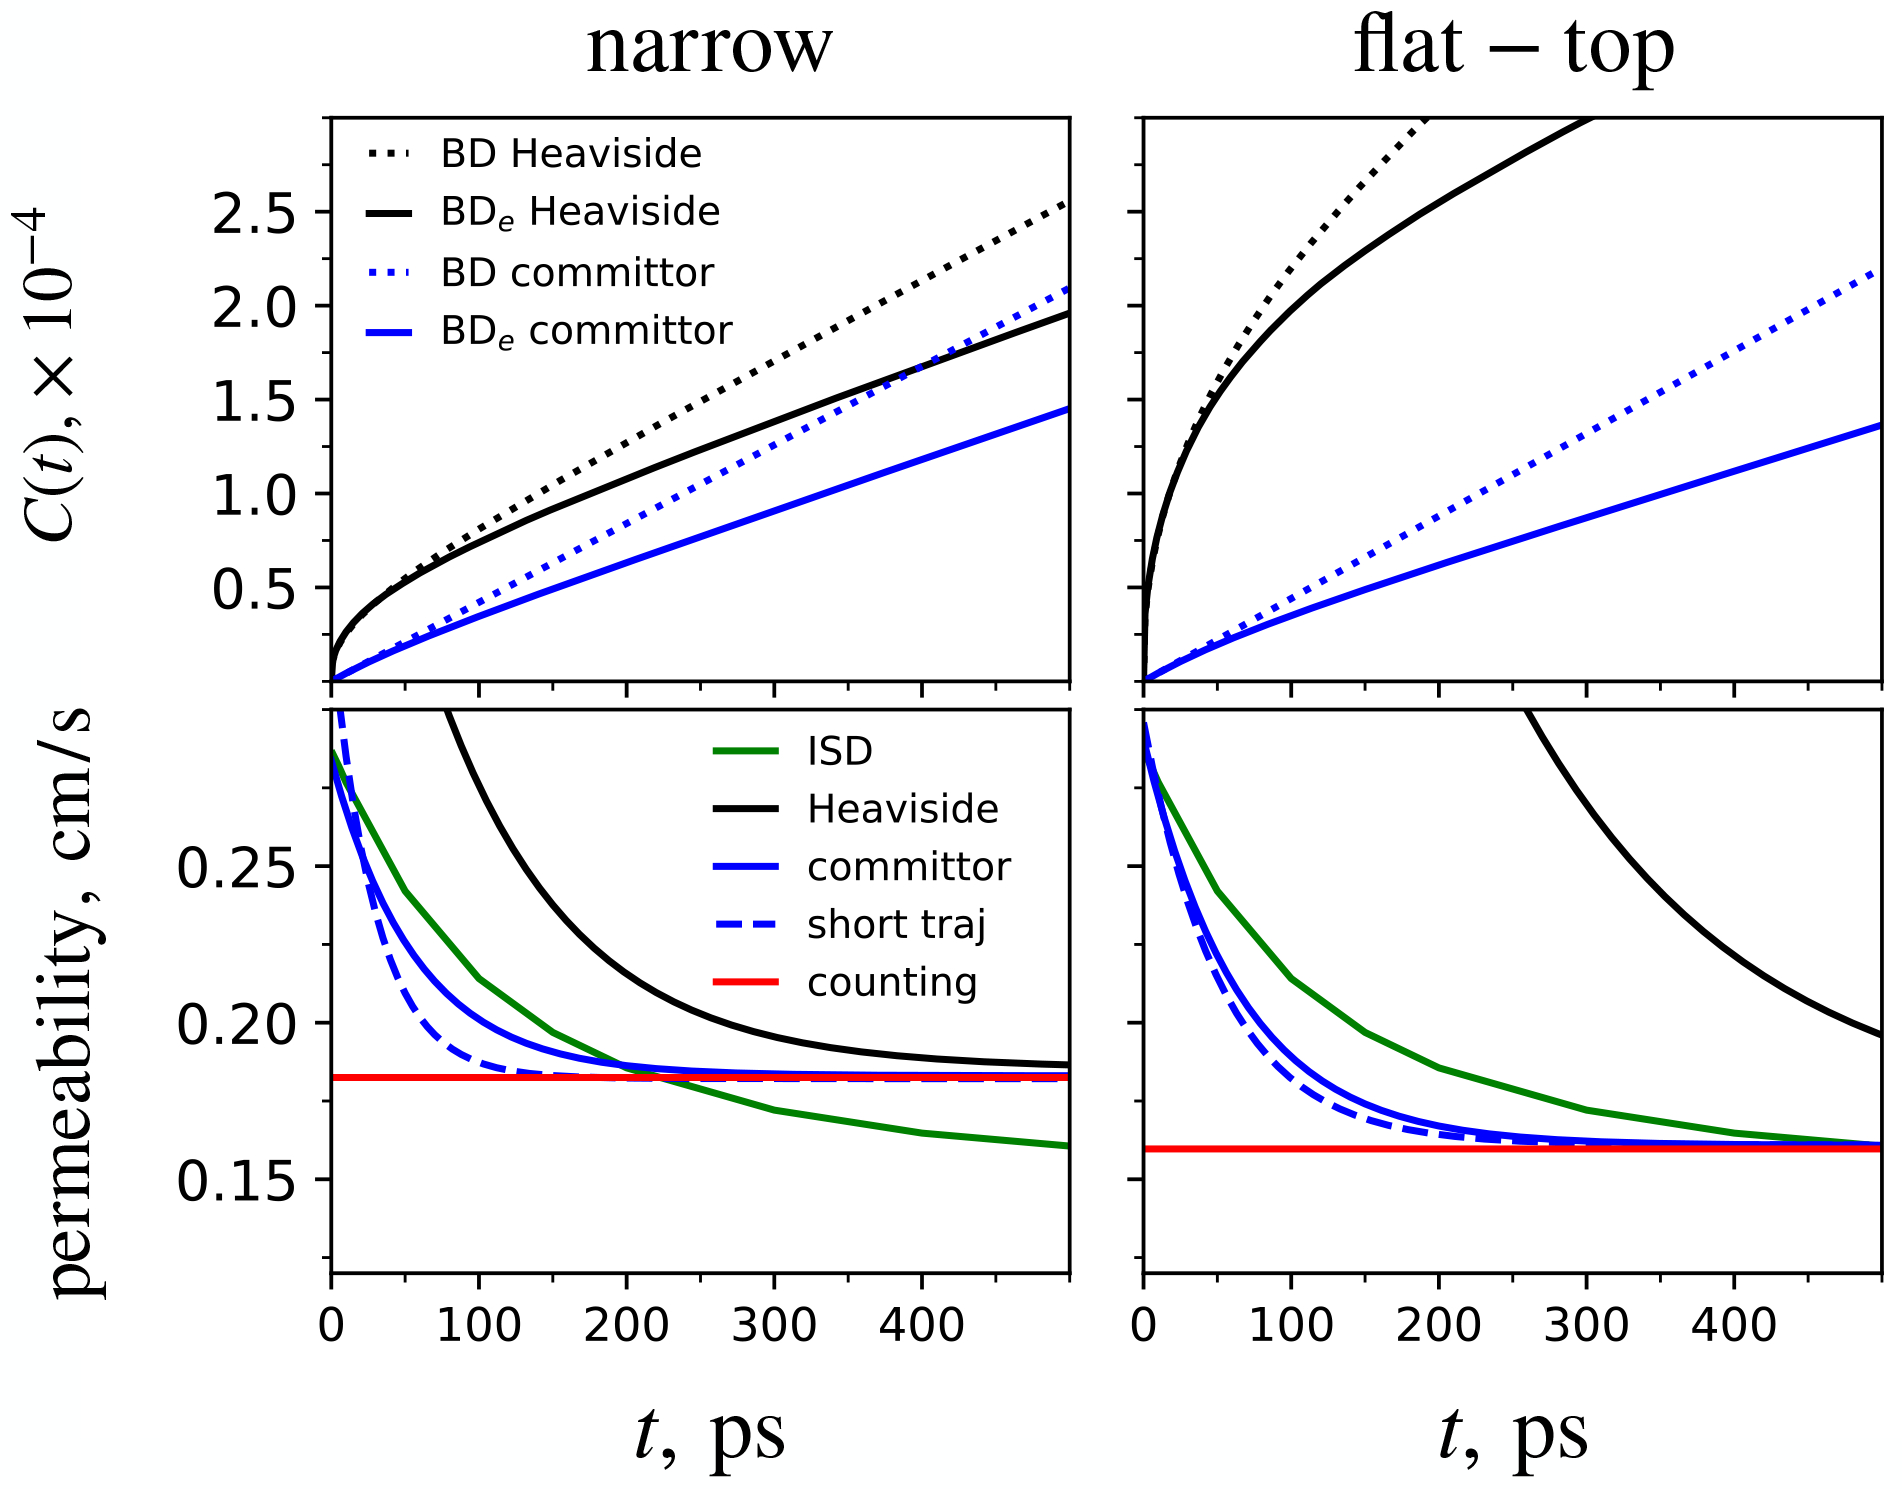
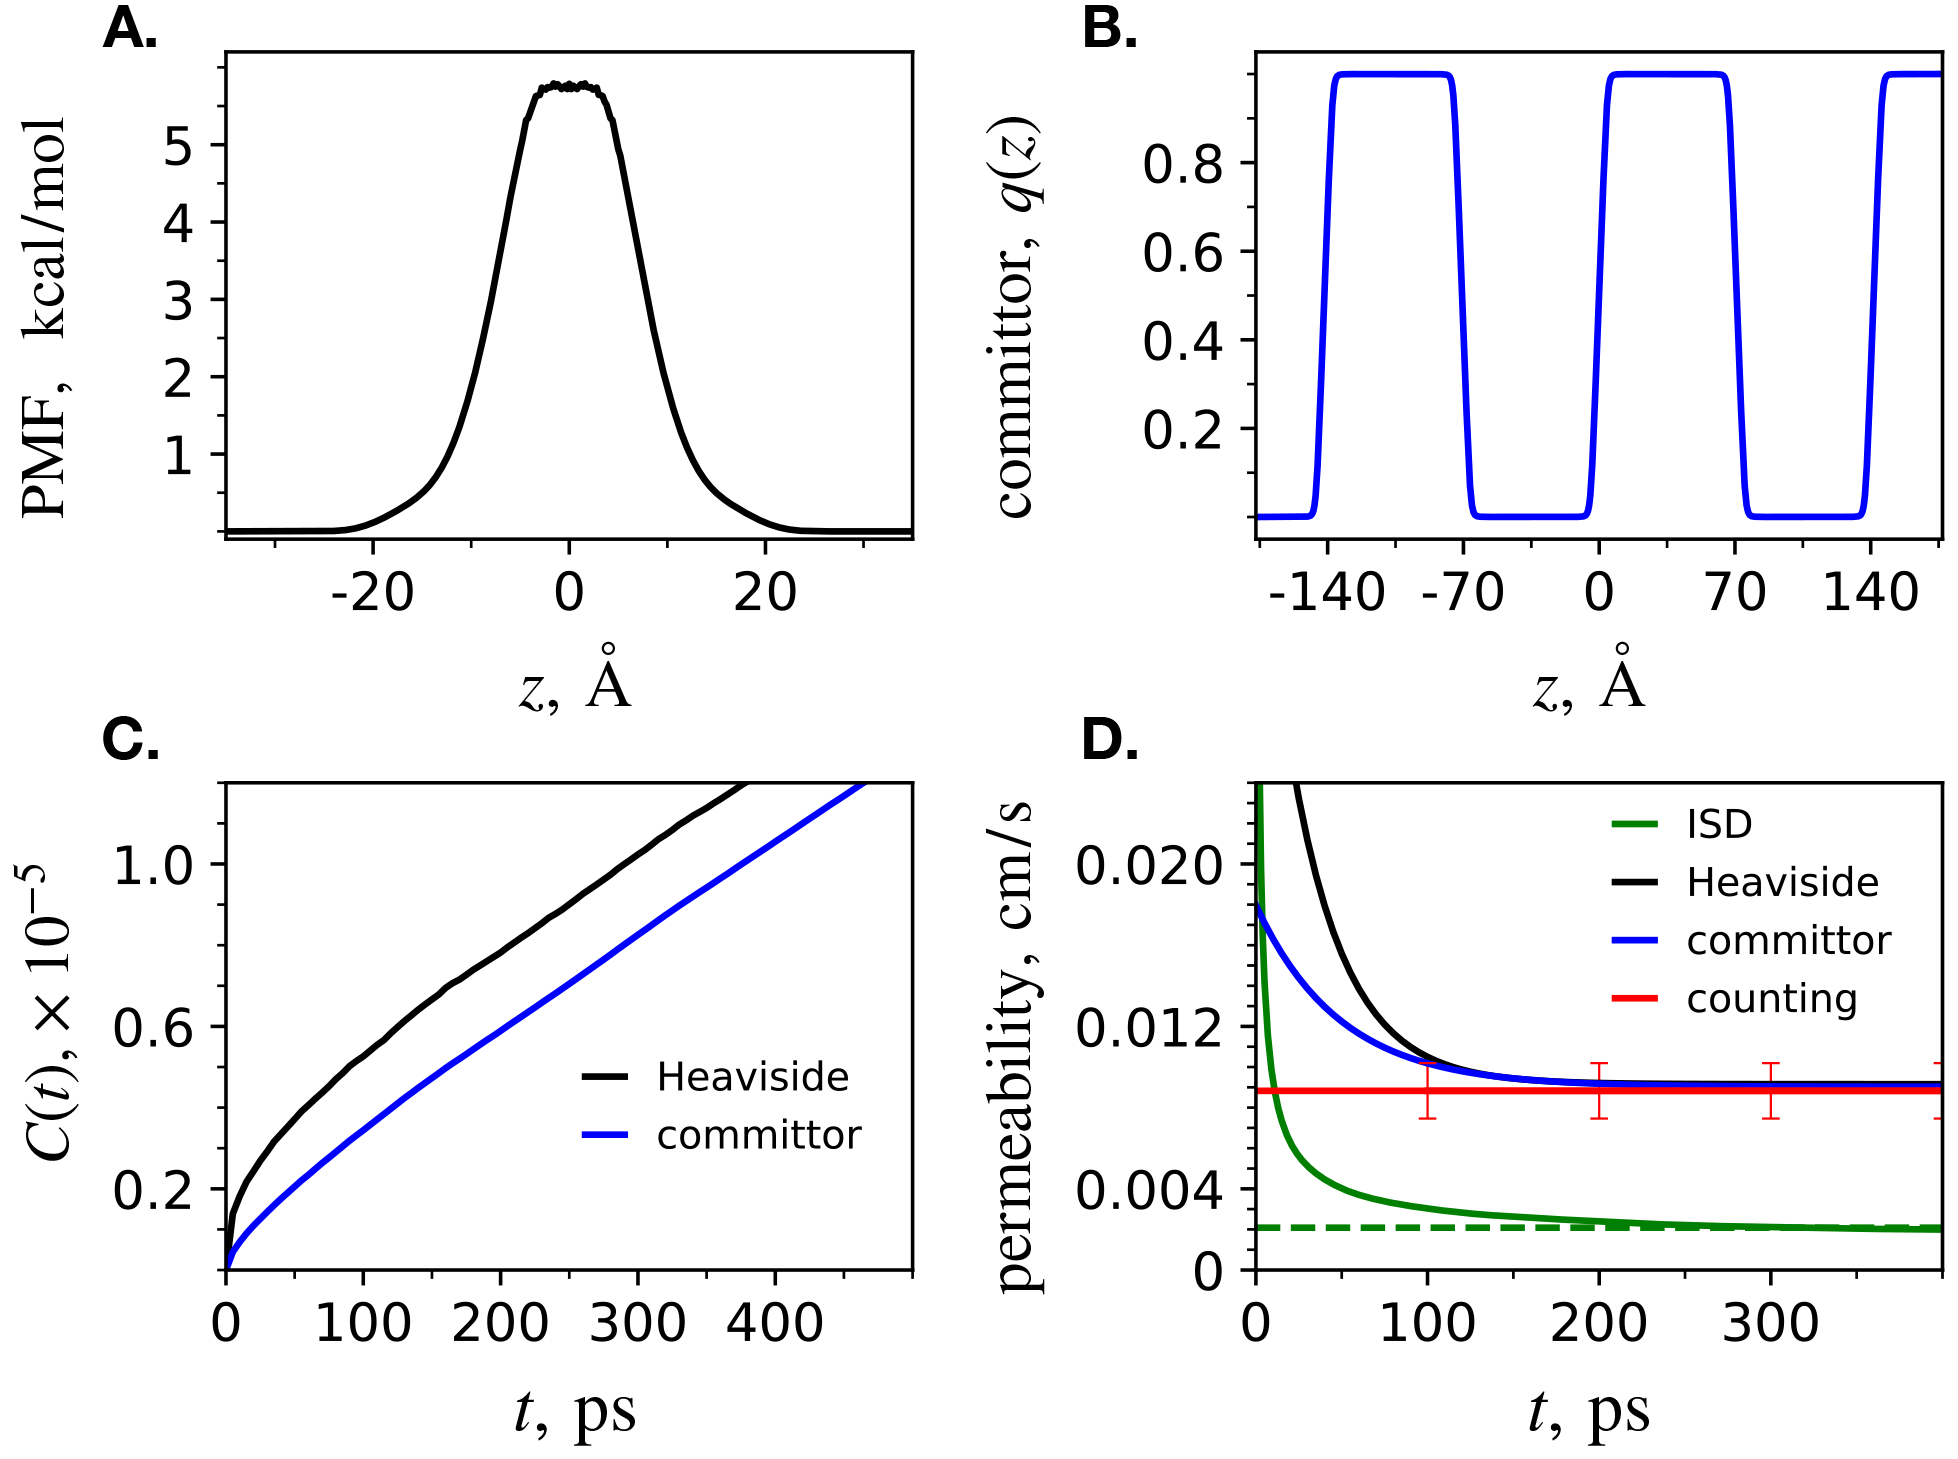
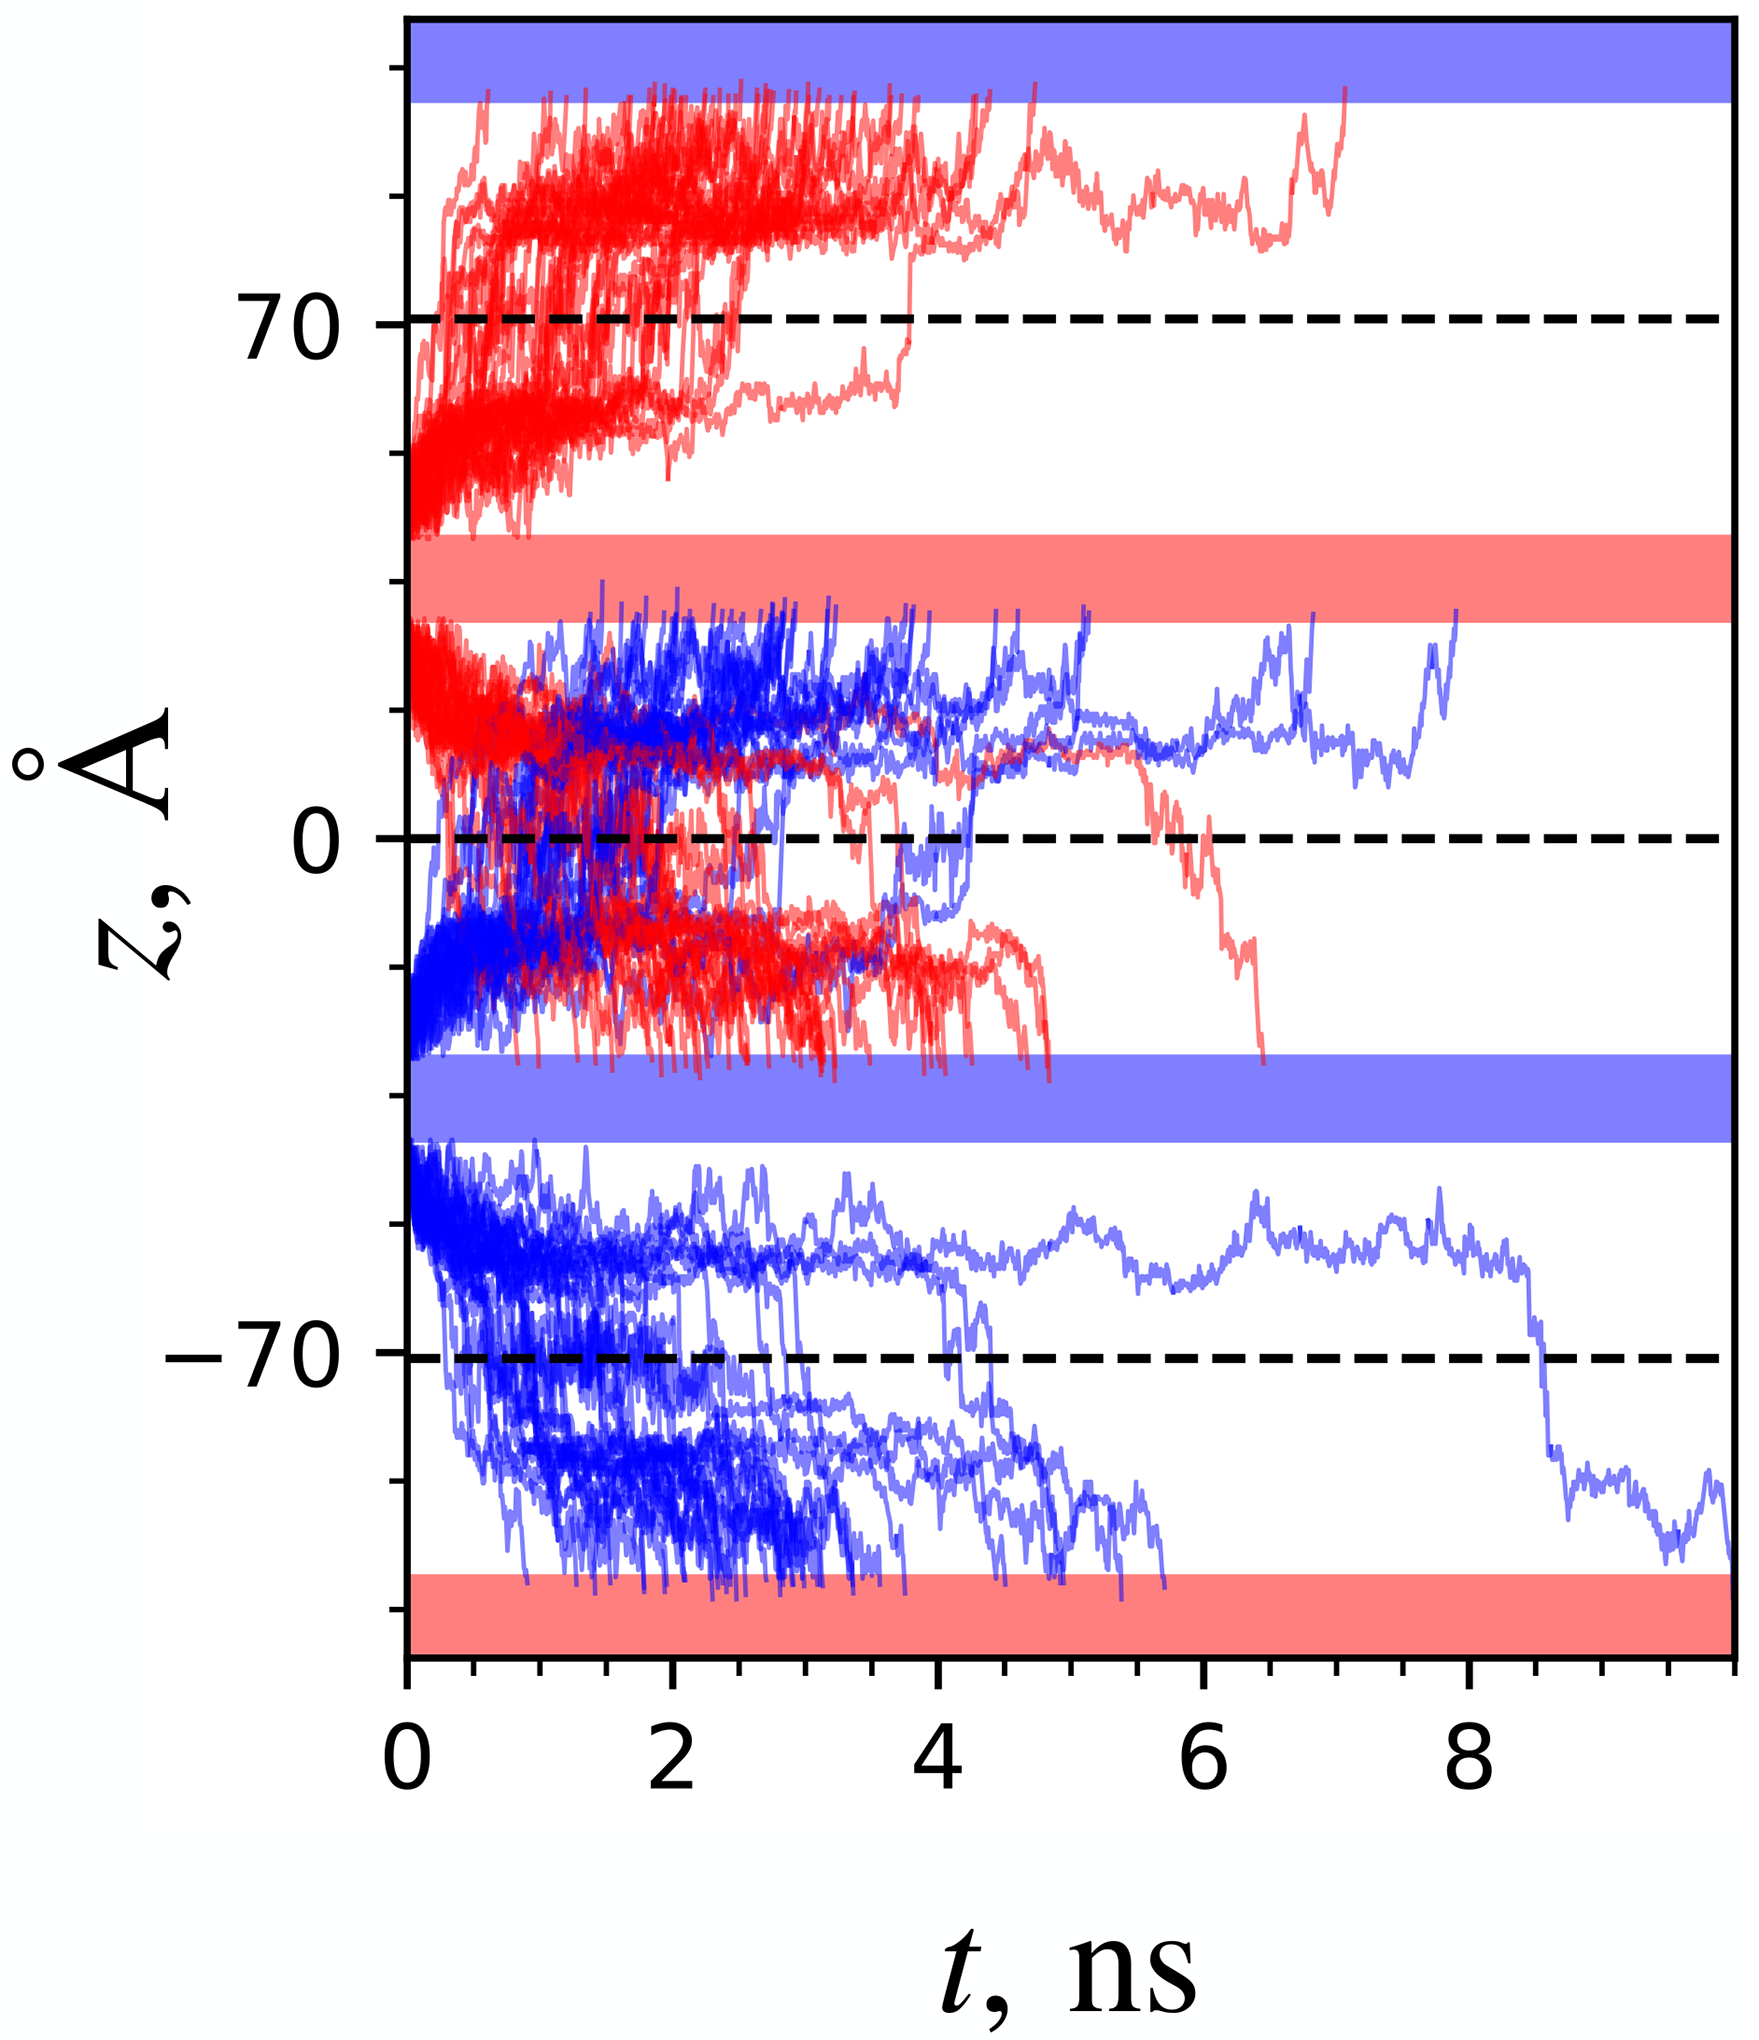
A popular theoretical framework to compute the permeability coefficient of a molecule is provided by the classic Smoluchowski-Kramers treatment of the steady-state diffusive flux across a free-energy barrier. Within this framework, commonly termed "inhomogeneous solubility-diffusion" (ISD), the permeability, P, is expressed in closed form in terms of the potential of mean force and position-dependent diffusivity of the molecule of interest along the membrane normal. In principle, both quantities can be calculated from all-atom MD simulations. Although several methods exist for calculating the position-dependent diffusivity, each of these is at best an estimate. In addition, the ISD model does not account for memory effects along the chosen reaction coordinate. For these reasons, it is important to seek alternative theoretical formulations to determine the permeability coefficient that are able to account for the factors ignored by the ISD approximation. Using Green-Kubo linear response theory, we establish the familiar constitutive relation between the flux density across the membrane and the difference in the concentration of a permeant molecule, j = PΔC. On this basis, we derive a time-correlation function expression for the nonequilibrium flux across a membrane that is reminiscent of the transmission coefficient in the reactive flux formalism treatment of transition rates. An analysis based on the transition path theory framework is exploited to derive alternative expressions for the permeability coefficient. The different strategies are illustrated with stochastic simulations based on the generalized Langevin equation in addition to unbiased molecular dynamics simulations of water permeation of a lipid bilayer.


Figures

Figure 1:
Figure 1:
Physical situation of a membrane separating a bulk region a (blue) and a bulk region b (yellow) containing a permeant molecule. The indicator function HaHb is equal to 1 if the permeant molecule i is on side a(b), and equal to zero otherwise. By construction, all space is covered by the two indicator functions, with Ha+Hb=1. The concentration of permeant molecule at the positions za and zb in the bulk region away from the membrane serves as a reference to establish the constitutive relation j=PΔC of membrane permeation.
Figure 2:
Figure 2:
Part of a BDe (Brownian dynamics with exponential memory) trajectory of a narrow barrier, showing color-coded crossings between a (red) and b (blue). The two regions are defined by the edge of the boundary regions z<za for the side a and z>zb for side b, with za=-35Å, and and zb=+35Å.
Figure 3:
Figure 3:
MSD diffusivity computed by BDe simulations (solid green line) on a flat free energy landscape (W(z)=0) with various values of Ke and De. In each case, Dz is 0.1Å2/ps. The corresponding analytical diffusivity computed with eq 26 is shown for comparison (dotted black line). The limits Dz (dashed red line) and Deff (dashed blue line) are shown. A. De=0.1Å2/ps,Ke=0.05kcal/molÅ2, B. De=0.2Å2/ps,Ke=0.05kcal/molÅ2, C. De=0.1Å2/ps,Ke=0.10kcal/molÅ2.
Figure 4:
Figure 4:
Effective MSD diffusivity as a function of the lag time computed analytically from eq 26 with an exponential memory for different barriers and, therefore, dynamical regimes. In each case, the instantaneous diffusivity Dz is set to 0.1Å2/ps (red dashed line), the minimum effective diffusivity is 0.05Å2/ps (blue dashed line), and the memory constant Ke is 0.05 kcal/mol Å2. A barrier with a negative value of W corresponds to an inverted parabola (black line) and a positive value corresponds to a harmonic well (purple line), while zero is a flat landscape (green line).
Figure 5:
Figure 5:
PMF, W(z), (left) and analytical MSD diffusivity (right) for demonstrating the Grote-Hynes correction to the ISD permeability of an inverted harmonic barrier with exponential memory. The PMF has a curvature W=0.2kcal/molÅ2, and it reaches 0 where z=±6. The MSD corresponds to parameters: Dz=0.1,De=0.01Å2/ps,Ke=0.4kcal/molÅ2.
Figure 6:
Figure 6:
PMF, W(z), and approximate committor, q(z), for the narrow (left side) and flat-top (right side) barriers used in the BDe and BD simulations.
Figure 7:
Figure 7:
Total number of crossing events from BDe (solid lines) and BD (dashed lines) simulations of each barrier (narrow = blue, flat-top = green). The mean and standard deviation of total crossings per replicate from ensembles of 50 replicates of 50μs each are 42.12 ± 6.4 for the BD narrow, 27.20 ± 4.9 for the BDe narrow, 43.94 ± 6.5 for the BD flat-top, and 24.48 ± 5.6 for the BDe flat-top.
Figure 8:
Figure 8:
Top row: Heaviside function (Cab(t), black) and committor time-correlation function (Cqq(t), blue) for BD (dotted) and BDe (solid) simulations of the narrow (left) and flat-top (right) barriers. Bottom row: Permeability over a range of lag times for the BDe simulations only. Permeability corresponding to the ISD model (green) computed with eq 1, “Heaviside” (black) with eq 9, “committor” (blue) with eq 19, “short traj” (dashed blue) with eq 36, and “counting” (red) with eq 13. The counting permeability does not depend on the lag time. The ISD permeability is the same for each barrier by construction. The permeability determined from the Heaviside time-correlation function reaches approximately the same plateau after 2000 – 3000 ps (shown in section S3 of the SI).
Figure 9:
Figure 9:
A. PMF of water across a DLPC bilayer, computed from the marginal probability distribution from unbiased MD with the Drude2023 force field. B. Approximate committor of water, which is “unwrapped”, or extended, to cover several periodic images of the membrane system. The committor is calculated from the PMF assuming that the diffusivity is independent of z. C. Committor Cqq(t) and Heaviside Cab(t) time-correlation functions, averaged from each unwrapped water trajectory, mapped onto the unwrapped committor and Heaviside function, respectively. D. Permeability of DLPC to water based on the ISD model (green) with eq 1, “Heaviside” (black) with eq 9, “committor” (blue) with eq 19, and “counting” (red) with eq 13. The ISD permeability depends on the position-dependent diffusivity D(z), which was determined with biased US simulations. The lag time dependence of the ISD is related to the upper limit of the integral of the position autocorrelation function (see section S4 of the SI). The dashed green line corresponds to an ISD estimate using the D(z) profile of Figure S4. The counting permeability is based on a mean and standard deviation of 52.0 ± 8.0 crossings per replicate, where three replicates were simulated for 400 ns each.
Figure 10:
Figure 10:
Successful water crossings beginning at the time the molecule left region a (red) or b (blue) and ending at the time at which it first touches the opposite region. The trajectories are colored based on the initial region. The dashed black line is the center of each image of the membrane (see Figure 9B.). The mean reactive transit time is interpreted as the mean duration of the crossings, which is 2.93 ns.

Similar articles

Cited by

References

    1. Rashid M; Malik MY; Singh SK; Chaturvedi S; Gayen JR; Wahajuddin M Bioavailability enhancement of poorly soluble drugs: the holy grail in pharma industry. Curr. Pharm. Design 2019, 25, 987–1020. - PubMed
    1. Tse CH; Comer J; Wang Y; Chipot C Link between membrane composition and permeability to drugs. J. Chem. Theory Comput 2018, 14, 2895–2909. - PubMed
    1. Menichetti R; Kanekal KH; Bereau T Drug-membrane permeability across chemical space. ACS Cent. Sci 2019, 5, 290–298. - PMC - PubMed
    1. Loverde SM Molecular simulation of the transport of drugs across model membranes. J. Phys. Chem. Lett 2014, 5, 1659–1665. - PubMed
    1. Smoluchowski M Drei vorträge über diffusion, brownsche molekularbewegung und koagulation von kolloidteilchen. Phys. Z 1916, 17, 557–571.

LinkOut - more resources