. 2024 Sep 16;20(9):e1011306.
doi: 10.1371/journal.pgen.1011306. eCollection 2024 Sep.

Evolution recovers the fitness of Acinetobacter baylyi strains with large deletions through mutations in deletion-specific targets and global post-transcriptional regulators

Affiliations

Evolution recovers the fitness of Acinetobacter baylyi strains with large deletions through mutations in deletion-specific targets and global post-transcriptional regulators

Isaac Gifford et al. PLoS Genet. .

Abstract

Organelles and endosymbionts have naturally evolved dramatically reduced genome sizes compared to their free-living ancestors. Synthetic biologists have purposefully engineered streamlined microbial genomes to create more efficient cellular chassis and define the minimal components of cellular life. During natural or engineered genome streamlining, deletion of many non-essential genes in combination often reduces bacterial fitness for idiosyncratic or unknown reasons. We investigated how and to what extent laboratory evolution could overcome these defects in six variants of the transposon-free Acinetobacter baylyi strain ADP1-ISx that each had a deletion of a different 22- to 42-kilobase region and two strains with larger deletions of 70 and 293 kilobases. We evolved replicate populations of ADP1-ISx and each deletion strain for ~300 generations in a chemically defined minimal medium or a complex medium and sequenced the genomes of endpoint clonal isolates. Fitness increased in all cases that were examined except for two ancestors that each failed to improve in one of the two environments. Mutations affecting nine protein-coding genes and two small RNAs were significantly associated with one of the two environments or with certain deletion ancestors. The global post-transcriptional regulators rnd (ribonuclease D), csrA (RNA-binding carbon storage regulator), and hfq (RNA-binding protein and chaperone) were frequently mutated across all strains, though the incidence and effects of these mutations on gene function and bacterial fitness varied with the ancestral deletion and evolution environment. Mutations in this regulatory network likely compensate for how an earlier deletion of a transposon in the ADP1-ISx ancestor of all the deletion strains restored csrA function. More generally, our results demonstrate that fitness lost during genome streamlining can usually be regained rapidly through laboratory evolution and that recovery tends to occur through a combination of deletion-specific compensation and global regulatory adjustments.


Conflict of interest statement

The authors have declared that no competing interests exist.

Figures
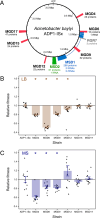
Fig 1
Fig 1. Some reduced-genome variants of A. baylyi ADP1-ISx have fitness defects.
(A) A. baylyi ADP1-ISx chromosome showing the locations and sizes of regions removed in six multiple-gene deletion (MGD) strains, one retained-genomic region (RGR) strain, and two multiple-segment deletion (MSD) strains used as ancestors for the evolution experiment. The numbers of protein-coding, tRNA, and rRNA genes deleted in each strain are indicated. (B, C) Fitness of ADP1-ISx and the six MGD strains relative to a GFP-expressing variant of ADP1-ISx. Filled bars are means. Error bars are 95% confidence intervals. Starred values are significantly different from ADP-ISx (Benjamini-Hochberg adjusted Welch’s t-tests).
Fig 2
Fig 2. Evolution of fitness in the evolution experiment.
The inset in the upper right shows the design of the evolution experiment and how final endpoint clonal isolates from each replicate population were selected for characterization. The other panels show the fitness determined for each of six evolved endpoint isolates (numbered 1–6) and their respective ancestor (Anc) relative to a GFP-expressing variant of ADP1-ISx. Points are the results of individual replicates of co-culture fitness assays. Horizontal solid lines are the average fitness of the respective ancestral strain. Horizontal dashed lines at a value of one are the relative fitness of the ADP1-ISx progenitor because this reference comparison was used to normalize all relative fitness measurements. Filled bars are means. Error bars are 95% confidence intervals. Starred values are significantly different from ADP1-ISx (Benjamini-Hochberg adjusted Welch’s t-tests).
Fig 3
Fig 3. Fitness of evolved clones versus their ancestors.
The relative fitness of each evolved endpoint clone that was characterized is plotted against the relative fitness of its ancestor. Fitness values measured for independently evolved clones from different replicate populations of the evolution experiment (small gray points) are summarized as means (larger colored points) with error bars for the standard deviations of the clone values. Points above the reference line with a slope of one represent improvements during evolution.
Fig 4
Fig 4. Mutated genes associated with certain ancestors and environments.
Each symbol on the grids represents a mutation affecting the labeled gene, intergenic region (if two gene names are separated by a slash), any one of a set of labeled genes (if gene names are separated by commas), or a multigene region (if gene names are separated by a dash). Triangles are used for larger mutations that include the corresponding genes as well as their surrounding regions. Unfilled symbols are used for pre-existing mutations that fixed in the ancestor strain or were present in cultures used to start the evolution experiment. They were not included in the association analysis. Only genes or gene groups affected by mutations in three or more evolved isolates are shown. The bottommost lines of the grid show genes that were mutated only in the context of that one specific ancestor strain. A full list of evolved mutations is included in S4 Table. Genes or gene sets in which the rate of mutations differed depending on the culture environment are indicated by highlighting horizontal guidelines using thick (enriched) and thin (depleted) lines colored by the medium condition. Mutations with rates that differed depending on the ancestor strain within each environment are highlighted in color, with a different color used for each gene or gene set. In both cases the statistical significance of these associations was tested by using binomial regression models (Benjamini-Hochberg adjusted p < 0.05, likelihood ratio tests, see Methods).
Fig 5
Fig 5. Spectra of RNase D mutations vary with ancestor and environment.
Wider bars are used for types of mutations that are likely to result in complete loss of gene function.
Fig 6
Fig 6. Effects of deleting RNase D in different ancestors on fitness in each environment.
Each panel shows the fitness of an RNAse D deletion strain (Δrnd) and its ancestor (Ancestor) relative to GFP-expressing ADP1-ISx. Points are the results of individual replicates of co-culture fitness assays. Horizontal solid lines are the average fitness of the respective ancestral strain measured in these competitions. Horizontal dashed lines at a value of one are the relative fitness of the ADP1-ISx progenitor determined in a prior set of experiments, which was used as a reference value for normalizing all measurements in these assays. Error bars are 95% confidence intervals. Starred comparisons indicate a significant difference between the fitness values measured for an ancestor and its Δrnd mutant (Benjamini-Hochberg adjusted p < 0.05, t-tests).

References

    1. McCutcheon JP, Moran NA. Extreme genome reduction in symbiotic bacteria. Nat Rev Microbiol. 2012;10: 13–26. doi: 10.1038/nrmicro2670 - DOI - PubMed
    1. Weinert LA, Welch JJ. Why might bacterial pathogens have small genomes? Trends Ecol Evol. 2017;32: 936–947. doi: 10.1016/j.tree.2017.09.006 - DOI - PubMed
    1. Moran NA, McLaughlin HJ, Sorek R. The dynamics and time scale of ongoing genomic erosion in symbiotic bacteria. Science. 2009;323: 379–382. doi: 10.1126/science.1167140 - DOI - PubMed
    1. Fehér T, Papp B, Pál C, Pósfai G. Systematic genome reductions: theoretical and experimental approaches. Chem Rev. 2007;107: 3498–3513. doi: 10.1021/cr0683111 - DOI - PubMed
    1. Juhas M, Reuß DR, Zhu B, Commichau FM. Bacillus subtilis and Escherichia coli essential genes and minimal cell factories after one decade of genome engineering. Microbiology. 2014;160: 2341–2351. doi: 10.1099/mic.0.079376–0 - DOI - PubMed

Substances

Supplementary concepts

LinkOut - more resources