. 2024 Sep 16;20(9):e1012569.
doi: 10.1371/journal.ppat.1012569. eCollection 2024 Sep.

Multifaceted activation of STING axis upon Nipah and measles virus-induced syncytia formation

Affiliations

Multifaceted activation of STING axis upon Nipah and measles virus-induced syncytia formation

Lucia Amurri et al. PLoS Pathog. .

Abstract

Activation of the DNA-sensing STING axis by RNA viruses plays a role in antiviral response through mechanisms that remain poorly understood. Here, we show that the STING pathway regulates Nipah virus (NiV) replication in vivo in mice. Moreover, we demonstrate that following both NiV and measles virus (MeV) infection, IFNγ-inducible protein 16 (IFI16), an alternative DNA sensor in addition to cGAS, induces the activation of STING, leading to the phosphorylation of NF-κB p65 and the production of IFNβ and interleukin 6. Finally, we found that paramyxovirus-induced syncytia formation is responsible for loss of mitochondrial membrane potential and leakage of mitochondrial DNA in the cytoplasm, the latter of which is further detected by both cGAS and IFI16. These results contribute to improve our understanding about NiV and MeV immunopathogenesis and provide potential paths for alternative therapeutic strategies.


Conflict of interest statement

The authors have declared that no competing interests exist.

Figures

Fig 1
Fig 1. STING plays a role in the control of NiV infection in mice.
(A) Wild-type (WT), IFNα/β receptor (IFNAR) KO and STING KO C57BL/6 mice were infected intraperitoneally with 106 plaque-forming unit (PFU) of NiV-Malaysia (NiV) and observed during 28 days post-infection. Survival of NiV-infected mice was followed up for 28 days (n = 5 WT mice, n = 6 IFNAR KO mice and n = 5 STING KO mice). For kinetics analysis, results were grouped into early (from day 0+4h to day 2 post infection), mid (from day 2 to day 7) and late (from day 7 to day 28) phase of infection (3 to 6 animals per group). (B) α-NiV neutralizing antibodies titer measured in serum of 6 WT mice euthanized at day 28, 3 IFNAR KO mice euthanized at day 7 or day 27 and 6 STING KO mice euthanized at day 28. (C) NiV nucleoprotein (NiV-N), CXCL10 and IFNβ mRNA levels in murine lungs, spleens and brains harvested at early, mid or late phase were assessed by RT-qPCR. Data are represented as mean ± standard error of the mean (SEM). The difference between IFNAR KO and WT (in grey) or STING KO and WT (in red) was analyzed using two-way analysis of variance, followed by Tukey multiple comparison test: ns (not significant); *p<0.05; ***p<0.001; ****p<0.0001 compared to WT condition. (D) Brains of WT, IFNAR KO and STING KO C57BL/6 mice were harvested at day 7 post NiV infection and analyzed by fluorescence microscopy after staining with DAPI and anti-NiV-N antibody. The percentage of NiV-N positive pixels/total area was quantified with QuPath-0.4.3.
Fig 2
Fig 2. STING pathway controls IFNβ and NF-κB p65 responses following NiV infection.
Human pulmonary microvascular endothelial cells (HPMEC) were infected with NiV-eGFP at a MOI of 1 for 48h and treated or non-treated with a STING inhibitor (H151) or a cGAS inhibitor (RU.521) at 10 μM or 10 μg/ml, respectively, 1h before infection. (A, C) Cells were analyzed by fluorescence microscopy following fixation and immunofluorescence staining of phospho-STING (p-STING) and NF-κB p65. (B) Cells were harvested and analyzed by RT-qPCR for IFNβ expression. Data from 3 independent experiments are represented as mean ± SEM. All samples were analyzed using Kruskal-Wallis and Conover post-hoc test, *p<0.05; **p<0.01; ****p<0.0001 compared to NiV-infected WT condition. (D) The mean intensity of nuclear p65 fraction/cell was calculated using QuPath-0.4.3 on at least 130 events per condition. For infected conditions, only infected cells were analyzed. Data are represented as mean ± SD. All samples were analyzed using Kruskal Wallis and Dunn’s multiple comparison test, ****p<0.0001 compared to NiV-infected WT condition.
Fig 3
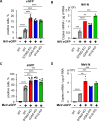
Fig 3. STING-associated sensors cGAS and IFI16 are involved in the control of NiV and MeV infection.
WT, STING KO, cGAS KO or IFI16 KO THP-1 cells were infected with NiV-eGFP at a MOI of 0.3 or MeV-eGFP at a MOI of 0.1 for 48h. (A, C) eGFP expression was evaluated by flow cytometry in NiV-eGFP (A) or MeV-eGFP (C) infected cells (n = 6). Data are represented as mean ± SEM. All samples were analyzed using one-way analysis of variance, followed by Tukey’s multiple comparison test, ***p<0.001; ****p<0.0001 compared to NiV- or MeV-infected WT condition. (B, D) Cells were harvested and analyzed by RT-qPCR for NiV-N (C) or MeV-N (F) expression (n = 3). Data are represented as mean ± SEM. All samples were analyzed using one-way analysis of variance, followed by Tukey’s multiple comparison test, **p<0.01; ***p<0.001; ****p<0.0001 compared to NiV- or MeV-infected WT condition.
Fig 4
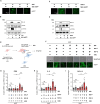
Fig 4. cGAS promotes phosphorylation of STING and IFI16 favors NF-κB p65 activation following NiV and MeV infection.
WT, STING KO, cGAS KO or IFI16 KO THP-1 cells were infected with NiV-eGFP (A-C) or MeV-eGFP (D-F) at a MOI of 1 for 48h. (A, D) Representative image of eGFP expression from 3 independent experiments, evaluated by fluorescence microscopy in NiV- (A) and MeV- (D) infected cells. (B, E) NiV- (B) and MeV- (E) infected cells were analyzed for NF-κB p65, phospho-p65 (p-p65), STING, phospho-STING (p-STING) and GAPDH expression by western blot analysis. (C, F) NiV- (C) or MeV- (F) infected cells were harvested and analyzed by RT-qPCR for IFNβ and IL-6 expression (n = 4). Data are represented as mean ± SEM. All samples were analyzed using one-way analysis of variance, followed by Tukey’s multiple comparison test, *p<0.05; **p<0.01; ***p<0.001; ****p<0.0001.
Fig 5
Fig 5. Viral-induced syncytia lead to STING activation and expression of IFN-I and inflammatory cytokines.
(A-F) HPMEC cells were infected with NiV-eGFP at a MOI of 3 (A-B) or MeV-eGFP at a MOI of 1 (C-D) for 48h and treated or non-treated with VIKI or HRC4 fusion inhibitor peptides, respectively, at 2 μM 6h post infection. (A, C) eGFP expression was evaluated by fluorescence microscopy on NiV- (A) or MeV- (C) infected cells. (B, D) Cells were analyzed for NiV-M or MeV-N, STING, p-STING and GAPDH expression by western blot analysis (B, D). (E-I) 293T cells were treated or non-treated with VIKI at 1 μM, transfected with NiV-F and/or NiV-G and eGFP in presence or absence of empty vector and incubated overnight. The scheme was created with Biorender (agreement number: UA26WU6I2T) (E). 293T cells were then washed with PBS and co-cultured with 293 cells for 24h before undergoing RT-qPCR analysis. (F) eGFP expression and syncytia formation were evaluated by fluorescence microscopy. (G-I) Cells were harvested and analyzed by RT-qPCR for IFNβ, IL-6 and CXCL10 expression. Data from 293T (n = 4) and co-culture of 293T and 293 (n = 6) are represented as mean ± SEM and expressed as fold change compared to co-culture + empty vector condition. All samples were analyzed using one-way analysis of variance, followed by Tukey’s multiple comparison test, *p<0.05; **p<0.01; ***p<0.001; ****p<0.0001.
Fig 6
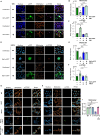
Fig 6. STING axis activation is associated with mitochondrial stress and DNA damage following paramyxovirus-induced syncytia formation.
(A-F) HPMEC cells were infected with NiV-eGFP at a MOI of 3 (A-C) or MeV-eGFP at a MOI of 1 (D-F) for 48h and treated or non-treated with VIKI or HRC4 fusion inhibitor peptides, respectively, at 1 μM (n = 4). (A, D) NiV- (A) or MeV- (D) infected cells were stained with Mitotracker Orange 100 nM, fixed, stained with anti-p-STING antibody and analyzed by fluorescence microscopy. (B, C, E, F) The mean fluorescence intensity per cell of Mitotracker (B, E) or p-STING (C, F) staining was calculated using QuPath-0.4.3 on at least 50 events per condition from each of 4 independent replicates. For infected mock condition, only cells inside syncytia were analyzed. Data are represented as mean ± SEM. All samples were analyzed using one-way analysis of variance, followed by Dunnett’s multiple comparison test, *p<0.05; ****p<0.0001 compared to NiV- or MeV-infected WT condition. (G-I) HeLa cells WT or stably expressing NiV-F or NiV-G were cultivated individually or co-cultured, treated or non-treated with VIKI fusion inhibitor peptide at 1 μM and incubated for 48h (n = 3). Cells were stained with Mitotracker Orange at 100 nM, fixed, stained with anti-p-STING (G) or anti-phosphorylated histone 2AX (p-H2AX) (H) antibodies and analyzed by confocal microscopy. The mean fluorescence intensity per cell of Mitotracker staining (I) was calculated using QuPath-0.4.3 on at least 30 events per condition from each of 4 independent replicates. Data are represented as mean ± SEM. All samples were analyzed using one-way analysis of variance, followed by Dunnett’s multiple comparison test, *p<0.05; ****p<0.0001 compared to NiV- or MeV-infected WT condition.
Fig 7
Fig 7. Mitochondrial DNA is responsible for STING activation through its sensing by both cGAS and IFI16 during NiV and MeV infection.
HeLa cells were infected with NiV-eGFP (A-C) or MeV-eGFP (D-F) at a MOI of 0.3 and treated or not with VIKI or HRC4 fusion inhibitor peptides, respectively, at 1 μM 6h post infection (n = 4). 48h post infection, cytoplasm was extracted and cGAS and IFI16 proteins were immunoprecipitated from cytoplasmic extract. DNA was purified from the immunoprecipitated products and analyzed by qPCR using primers specific for mtDNA. (A,B) Immunoprecipitated cGAS and IFI16 and whole cell lysates from NiV- (A) and MeV- (B) infected cells were analyzed for cGAS, IFI16 and GAPDH expression by western blot. (C-F) Purified DNA from immunoprecipitated cGAS (C, D) or IFI16 (E, F) was analyzed by qPCR for two mitochondrial (mt1 and mt2) DNA regions. Data are represented as mean ± SEM. All samples were analyzed using one-way analysis of variance, followed by Dunnett’s multiple comparison test, *p<0.05; ***p<0.001; ***p<0.0001 compared to NiV-infected WT condition.
Fig 8
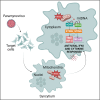
Fig 8. Schematic model representing the mechanisms responsible for STING activation following Nipah and Measles virus infection.
Paramyxovirus infection provokes the structural rearrangement of target cells into multi-nucleated giant cells (syncytia), leading to mitochondrial stress induction. As a consequence of mitochondrial stress, mitochondrial DNA (mtDNA) is released in cytoplasm and detected by both cGAS and IFI16 intracellular DNA sensors. While cGAS preferentially activates STING/TBK1/IRF-3 axis leading to IFN-I response induction, IFI16 primarily activates STING/NF-κB and inflammatory cytokines response, which may altogether play a role in the antiviral protection. The scheme was created with Biorender (agreement number: HC26WU6FDX).

References

    1. Ishikawa H, Barber GN. STING is an endoplasmic reticulum adaptor that facilitates innate immune signalling. Nature. 2008. Oct;455(7213):674–8. doi: 10.1038/nature07317 - DOI - PMC - PubMed
    1. Hopfner KP, Hornung V. Molecular mechanisms and cellular functions of cGAS–STING signalling. Nat Rev Mol Cell Biol. 2020. Sep;21(9):501–21. doi: 10.1038/s41580-020-0244-x - DOI - PubMed
    1. Chen C, Xu P. Cellular functions of cGAS-STING signaling. Trends Cell Biol. 2022. Nov 24;S0962–8924(22)00252–5. - PubMed
    1. Gentili M, Lahaye X, Nadalin F, Nader GPF, Puig Lombardi E, Herve S, et al. The N-Terminal Domain of cGAS Determines Preferential Association with Centromeric DNA and Innate Immune Activation in the Nucleus. Cell Rep. 2019. Feb 26;26(9):2377–2393.e13. doi: 10.1016/j.celrep.2019.01.105 - DOI - PMC - PubMed
    1. Civril F, Deimling T, de Oliveira Mann CC, Ablasser A, Moldt M, Witte G, et al. Structural mechanism of cytosolic DNA sensing by cGAS. Nature. 2013. Jun 20;498(7454):332–7. doi: 10.1038/nature12305 - DOI - PMC - PubMed

LinkOut - more resources