. 2024 Oct;602(19):4941-4958.
doi: 10.1113/JP286802. Epub 2024 Sep 16.

The structural and functional effects of myosin regulatory light chain phosphorylation are amplified by increases in sarcomere length and [Ca2+]

Affiliations

The structural and functional effects of myosin regulatory light chain phosphorylation are amplified by increases in sarcomere length and [Ca2+]

Kyrah L Turner et al. J Physiol. 2024 Oct.

Abstract

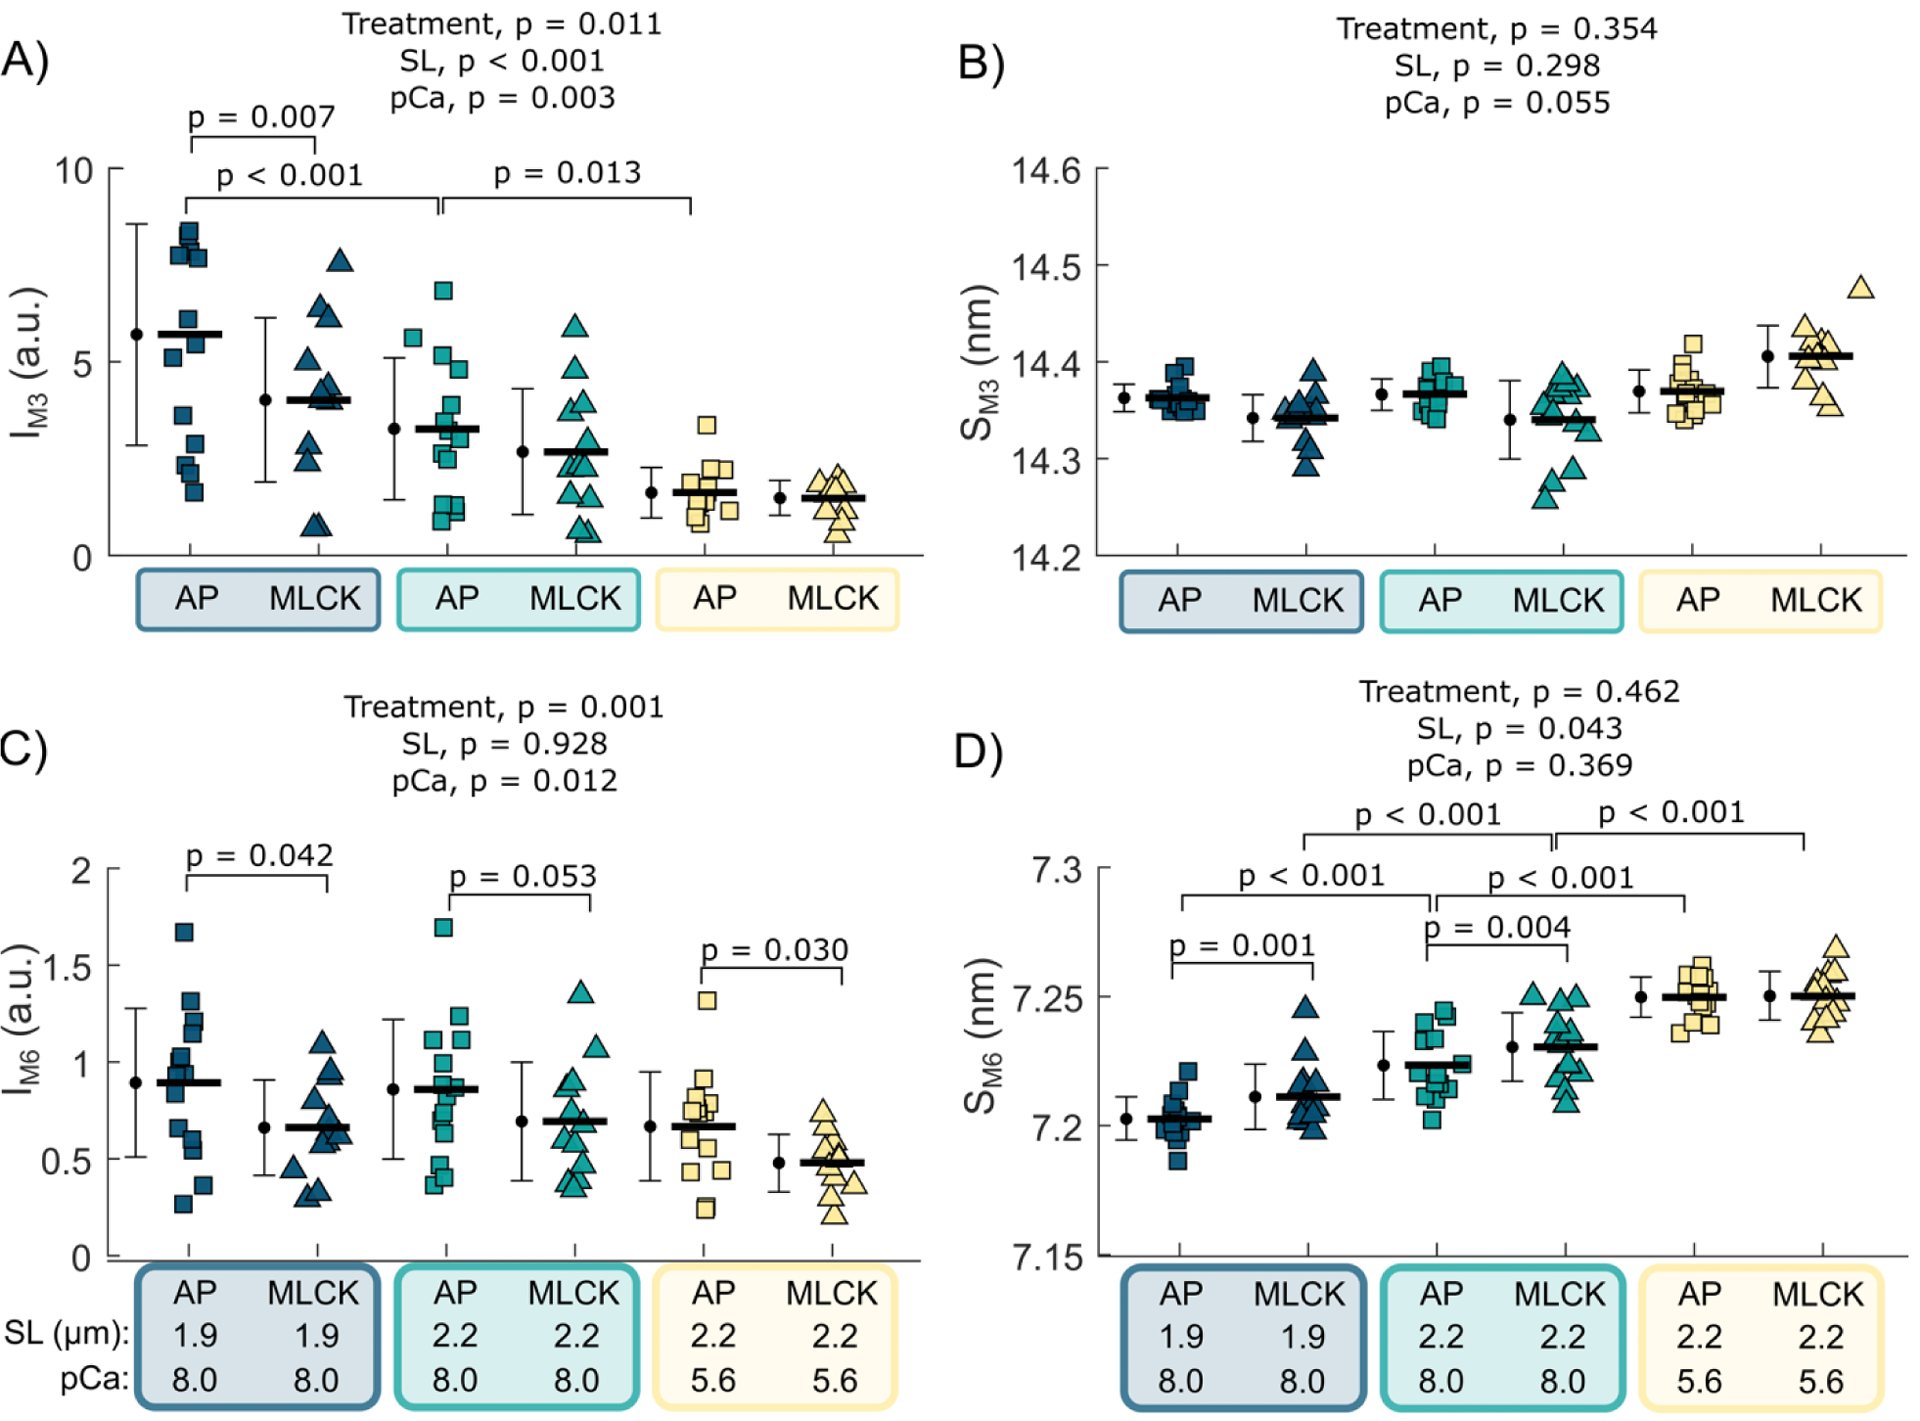
Precise regulation of sarcomeric contraction is essential for normal cardiac function. The heart must generate sufficient force to pump blood throughout the body, but either inadequate or excessive force can lead to dysregulation and disease. Myosin regulatory light chain (RLC) is a thick-filament protein that binds to the neck of the myosin heavy chain. Post-translational phosphorylation of RLC (RLC-P) by myosin light chain kinase is known to influence acto-myosin interactions, thereby increasing force production and Ca2+-sensitivity of contraction. Here, we investigated the role of RLC-P on cardiac structure and function as sarcomere length and [Ca2+] were altered. We found that at low, non-activating levels of Ca2+, RLC-P contributed to myosin head disorder, though there were no effects on isometric stress production and viscoelastic stiffness. With increases in sarcomere length and Ca2+-activation, the structural changes due to RLC-P become greater, which translates into greater force production, greater viscoelastic stiffness, slowed myosin detachment rates and altered nucleotide handling. Altogether, these data suggest that RLC-P may alter thick-filament structure by releasing ordered, off-state myosin. These more disordered myosin heads are available to bind actin, which could result in greater force production as Ca2+ levels increase. However, prolonged cross-bridge attachment duration due to slower ADP release could delay relaxation long enough to enable cross-bridge rebinding. Together, this work further elucidates the effects of RLC-P in regulating muscle function, thereby promoting a better understanding of thick-filament regulatory contributions to cardiac function in health and disease. KEY POINTS: Myosin regulatory light chain (RLC) is a thick-filament protein in the cardiac sarcomere that can be phosphorylated (RLC-P), and changes in RLC-P are associated with cardiac dysfunction and disease. This study assesses how RLC-P alters cardiac muscle structure and function at different sarcomere lengths and calcium concentrations. At low, non-activating levels of Ca2+, RLC-P contributed to myofilament disorder, though there were no effects on isometric stress production and viscoelastic stiffness. With increases in sarcomere length and Ca2+-activation, the structural changes due to RLC-P become greater, which translates into greater force production, greater viscoelastic stiffness, slower myosin detachment rate and altered cross-bridge nucleotide handling rates. This work elucidates the role of RLC-P in regulating muscle function and facilitates understanding of thick-filament regulatory protein contributions to cardiac function in health and disease.

Keywords: X‐ray diffraction; muscle mechanics; myofilament phosphorylation.


Conflict of interest statement

Competing interests

T.I and W.M provides consulting and collaborative research studies to Edgewise Therapeutics, but such work is unrelated to the content of this article.

Figures

Figure 1.
Figure 1.
AP and MLCK treatment of myocardial strips only affected RLC phosphorylation levels. Relative phosphorylation levels for the primary phosphorylatable myofilament regulatory proteins: A) regulatory light chain (RLC), B) cardiac troponin I (cTnI), and C) cardiac myosin binding protein-C (cMyBP-C) were quantified by SYPRO Ruby and Pro-Q Diamond gel stain. Average values represent mean±SD, using the with individual data points for each condition within each panel. Dashed lines represent untreated phosphorylation levels for each protein. Significance is listed within each panel. nsamples = 2 per condition (pooled from nfibers = 4, technical replicates) from each heart (nhearts = 2, biological replicates).
Figure 2:
Figure 2:. Regulatory light chain phosphorylation (RLC-P) increases active stress at short (1.9 μm) and long (2.2 μm) sarcomere lengths.
Summary data are shown for A) passive stress at pCa 8.0, B) active stress at pCa 5.6, C) active stress at ½ maximal activation, and D) active stress at pCa 4.8 for each condition. Averages represent mean±SD, with individual data points shown. Fixed effects are listed above each panel. Post-hoc comparisons are listed within each panel. nfibers = 3–4 per condition (technical replicates) from each heart (nhearts = 2, biological replicates).
Figure 3:
Figure 3:. RLC-P does not alter equatorial parameters measured by small-angle x-ray diffraction.
A) Representative x-ray diffraction images of permeabilized porcine myocardium at low calcium (pCa 8.0) after treatment with AP or MLCK at sarcomere length 1.9 μm or 2.2 μm. Each quadrant shows a representative image for each of the conditions. Left: AP treatment; Right: MLCK treatment; Upper: SL 1.9 μm; Lower: SL 2.2 μm. B) The equatorial reflections are associated with thick- and thin-filament configuration. The 1,0 reflection arises from thick-filament mass, while the 1,1 reflection arises from both thick- and thin-filament mass. Increases in the equatorial intensity ratio, I1,1/I1,0, indicate movement of the myosin heads, with myosin head mass shifting away from the thick-filament backbone and toward the thin-filament. Summary data for C) thick- to thick- filament spacing (d1,0), D) I1,1/I1,0. Averages represent mean± SD, with individual data points shown. Fixed effects are listed above each panel. Post-hoc comparisons are listed within each panel. nfibers = 5–6 per condition (technical replicates) from each heart (nhearts = 2, biological replicates).
Figure 4:
Figure 4:. RLC-P influences meridional diffraction parameters associated with structural changes along the thick-filament backbone.
The meridional reflections are associated with the orientation and/or organization of myosin heads along the thick-filament backbone. Summary data for A) intensity of the third-order meridional reflection (IM3), B) spacing of the third-order meridional reflection (SM3), C) intensity of the sixth-order meridional reflection (IM6), D) and spacing of the sixth-order meridional reflection (SM6). Averages represent mean± SD, with individual data points shown. Fixed effects are listed above each panel. Post-hoc comparisons are listed within each panel. nfibers = 5–6 per condition (technical replicates) from each heart (nhearts = 2, biological replicates).
Figure 5:
Figure 5:. RLC-P does not affect passive viscoelastic stiffness at low [Ca2+] (pCa 8.0).
A) Elastic and B) viscous moduli are plotted against oscillatory frequency from sinusoidal length-perturbation measurements. Averages represent mean±SEM. In the left and middle column, colored solid lines (=AP treatment) and dashed lines (=MLCK treatment) represent fit lines from the SL not shown on the panel. Fixed effects are listed above each right-most panel because the statistical analysis of the nested linear mixed model was only applied to all data (not sub-divided sections of data shown in the left and middle panels). Post-hoc comparisons are indicated within each right-most panel. nfibers = 3–4 per condition (technical replicates) from each heart (nhearts = 2, biological replicates).
Figure 6:
Figure 6:. RLC-P and sarcomere length increase viscoelastic stiffness.
Elastic (A) and viscous moduli (B) are plotted against oscillatory frequency from sinusoidal length-perturbation measurements at pCa 5.6 (left column) and ½ maximal activation (middle column), and pCa 4.8 (right column). Fixed effects are listed above each panel. Averages represent mean±SEM. Post-hoc comparisons are listed within each panel. nfibers = 3–4 per condition (technical replicates) from each heart (nhearts = 2, biological replicates).
Figure 7:
Figure 7:. RLC-P increases cross-bridge stiffness or number of strongly bound cross-bridges.
Summary data for parameters A (A), and k (B) at pCa 5.6 (left column), ½ maximal activation (middle column), and pCa 4.8 (right column). Fixed effects are listed above each panel. Averages represent mean± SD. Post-hoc comparisons are listed within each panel. nfibers = 3–4 per condition (technical replicates) from each heart (nhearts = 2, biological replicates).
Figure 8:
Figure 8:. RLC-P decreases myosin head detachment rate.
Summary data for parameters B (A), C (B), 2πb (C), and 2πc (D) at pCa 5.6 (left column), ½ maximal activation (middle column), and pCa 4.8 (right column). Fixed effects are listed above each panel. Averages represent mean± SD. Post-hoc comparisons are listed within each panel. nfibers = 3–4 per condition (technical replicates) from each heart (nhearts = 2, biological replicates).
Figure 9:
Figure 9:. RLC-P decreases the ADP dissociation rate and increases the ATP association rate at both sarcomere lengths (pCa 4.8).
A) Permeabilized myocardial strips were stretched by 0.5% muscle length (ML, upper panel) and the stress response was measured as [ATP] was titrated to from 5 mM towards rigor (lower panel). B) krel vs [ATP] were fit to Eq. 2 to extract parameters that describe nucleotide handling rates for each experimental condition: C) k−ATP, the ATP dissociation rate, and E) k+ATP, the ATP association rate. F) [MgATP]50, the MgATP concentration at half-maximal detachment rate for each condition. Averages represent mean± SD, with individual data points shown where applicable. Post-hoc comparisons are listed within each panel. nfibers = 3–4 per condition (technical replicates) from each heart (nhearts = 2, biological replicates).

References

    1. Ait-Mou Y, Zhang M, Martin JL, Greaser ML & de Tombe PP (2017). Impact of titin strain on the cardiac slow force response. Prog Biophys Mol Biol 130, 281–287. - PMC - PubMed
    1. Akiyama K, Akopian G, Jinadasa P, Gluckman TL, Terhakopian A, Massey B & Bing RJ (1997). Myocardial infarction and regulatory myosin light chain. J Mol Cell Cardiol 29, 2641–2652. - PubMed
    1. Alamo L, Li XE, Espinoza-Fonseca LM, Pinto A, Thomas DD, Lehman W & Padrón R (2015). Tarantula myosin free head regulatory light chain phosphorylation stiffens N-terminal extension, releasing it and blocking its docking back. Mol Biosyst 11, 2180–2189. - PMC - PubMed
    1. Awinda PO, Bishaw Y, Watanabe M, Guglin MA, Campbell KS & Tanner BCW (2020). Effects of mavacamten on Ca2+ sensitivity of contraction as sarcomere length varied in human myocardium. Br J Pharmacol 177, 5609–5621. - PMC - PubMed
    1. de Beer EL, Grundeman RL, Wilhelm AJ, van den Berg C, Caljouw CJ, Klepper D & Schiereck P (1988). Effect of sarcomere length and filament lattice spacing on force development in skinned cardiac and skeletal muscle preparations from the rabbit. Basic Res Cardiol 83, 410–423. - PubMed

LinkOut - more resources