. 2024 Sep 24;121(39):e2411428121.
doi: 10.1073/pnas.2411428121. Epub 2024 Sep 16.

SARS-CoV-2-specific CD8+ T cells from people with long COVID establish and maintain effector phenotype and key TCR signatures over 2 years

Affiliations

SARS-CoV-2-specific CD8+ T cells from people with long COVID establish and maintain effector phenotype and key TCR signatures over 2 years

Louise C Rowntree et al. Proc Natl Acad Sci U S A. .

Abstract

Long COVID occurs in a small but important minority of patients following COVID-19, reducing quality of life and contributing to healthcare burden. Although research into underlying mechanisms is evolving, immunity is understudied. SARS-CoV-2-specific T cell responses are of key importance for viral clearance and COVID-19 recovery. However, in long COVID, the establishment and persistence of SARS-CoV-2-specific T cells are far from clear, especially beyond 12 mo postinfection and postvaccination. We defined ex vivo antigen-specific B cell and T cell responses and their T cell receptors (TCR) repertoires across 2 y postinfection in people with long COVID. Using 13 SARS-CoV-2 peptide-HLA tetramers, spanning 11 HLA allotypes, as well as spike and nucleocapsid probes, we tracked SARS-CoV-2-specific CD8+ and CD4+ T cells and B-cells in individuals from their first SARS-CoV-2 infection through primary vaccination over 24 mo. The frequencies of ORF1a- and nucleocapsid-specific T cells and B cells remained stable over 24 mo. Spike-specific CD8+ and CD4+ T cells and B cells were boosted by SARS-CoV-2 vaccination, indicating immunization, in fully recovered and people with long COVID, altered the immunodominance hierarchy of SARS-CoV-2 T cell epitopes. Meanwhile, influenza-specific CD8+ T cells were stable across 24 mo, suggesting no bystander-activation. Compared to total T cell populations, SARS-CoV-2-specific T cells were enriched for central memory phenotype, although the proportion of central memory T cells decreased following acute illness. Importantly, TCR repertoire composition was maintained throughout long COVID, including postvaccination, to 2 y postinfection. Overall, we defined ex vivo SARS-CoV-2-specific B cells and T cells to understand primary and recall responses, providing key insights into antigen-specific responses in people with long COVID.

Keywords: SARS-CoV-2 epitopes; T cell receptors; T cells; long COVID.


Conflict of interest statement

Competing interests statement:Hayley McQuilten consults for Ena Respiratory.

Figures
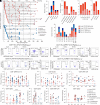
Fig. 1.
Fig. 1.
SARS-CoV-2-specific CD8+ and CD4+ T cell responses in people with long COVID. (A) Sampling timepoints. (B) Severity of initial SARS-CoV-2 infection. (C) Clinical syndromes, number of clinical syndromes, and study endpoint recovery status of people with long COVID. (D) HLA distribution across participants. (E) Donor representative FACS plots of TAME enriched SARS-CoV-2-specific CD8+ and CD4+ T cells. (F) CD8+ SARS-CoV-2-specific and (G) CD8+ spike-specific and CD8+ ORF1a/N-specific tetramer+ T cell frequencies in people with long COVID and non-LC controls over time post diagnosis. 7 datapoints are from previously described COVID-19 adult cohort (39). (H) CD8+ spike-specific T cell precursor frequencies grouped by acute, convalescent, and post-COVID-19 vaccination. (I, i) Paired CD8+ spike-specific and (I, ii) CD8+ ORF1a/N-specific T cell frequencies pre- and post-SARS-CoV-2-vaccination. (J) CD4+ spike-specific T cell precursor frequencies grouped by acute, convalescent, and post-COVID-19 vaccination. Statistical significance determined by (F–H and J) Dunn’s multiple comparisons test comparing all timepoints, (I) Wilcoxon matched-pairs sign-rank test for comparison between pre- and postvaccination. (F–I) Frequency of tetramer+ cells has been shifted up by 10−6 (i.e. samples with zero tetramer+ events displayed as 10−6) for visibility on the logarithmic y-axis. Samples with <10 tetramer+ events are shown as open symbols.
Fig. 2.
Fig. 2.
SARS-CoV-2 epitope hierarchy pre- and post-COVID-19 vaccination in people with long COVID. SARS-CoV-2 epitope-specific T cells in longitudinal individuals (>3 mo) graphed per individual per timepoint showing frequencies in (A) long COVID and (B) non-LC individuals. Plots are colored by epitope. (C) Paired S- and ORF1a/N-specific T cell frequencies in people with long COVID and non-LC controls pre- and post-COVID-19 vaccination. Statistical significance determined by the Wilcoxon matched-pairs sign-rank test comparing pre- and post-vaccination. (A–C) Frequency of tetramer+ cells has been shifted up by 10−6 (i.e. no detected tetramer+ events displayed as 10−6) for visibility on the logarithmic y-axis. (D) SARS-CoV-2 tetramer+ cells per 106 CD4+ or CD8+ T cells.
Fig. 3.
Fig. 3.
Phenotypic analysis of SARS-CoV-2-specific T and B cells in people with long COVID. Phenotypic profiles split by long COVID status in (A) total unenriched CD8+ and CD4+ T cells, (B) enriched CD8+ spike-specific and ORF1a/N-specific tetramer+ T cells. Seven datapoints are derived from our previous COVID-19 adult cohort (39). (C) Radar plots of activation markers (HLA-DR+, CD71+, CD38+, TIM-3+, PD-1+) of total CD8+ T cells and SARS-CoV-2 tetramer+ CD8+ T cells in long COVID and non-LC groups. Radar shows frequency of expression from 0% (center) to 100% (outer edge). (D) TIM-3 and PD-1 expression of spike-specific CD8+ T cells in long COVID and non-LC groups. (E) Frequency and (F) phenotype of SARS-CoV-2 spike-specific probe+ B cells in long COVID and non-LC individuals. Samples with <10 probe+ events are shown as open symbols. (G) Correlation of S-specific CD4+ T cells and B cells. Statistical significance determined by (A, B, and F) Tukey’s multiple comparisons test, (D and E) Dunn’s multiple comparisons test, and (G) Spearman correlation. (A–D and F) Samples with 10 or more tetramer+ or probe+ events are included in the phenotypic analysis.
Fig. 4.
Fig. 4.
SARS-CoV-2-specific T cell receptor repertoires of people with long COVID overlap with non-LC individuals. (A) Number and frequency of TCR clonotypes sequenced per SARS-CoV-2 epitope. Bar segments indicate the contributions from individual donors. (B) kPCA plot of long COVID and non-LC TCR clonotypes together by clonotype size. (C) kPCA plots of long COVID and non-LC TCR clonotypes colored by epitope or (D) by sampling timepoint as days post disease onset. (E) Combined long COVID and non-LC alluvial plots of A2/S269, A24/S1208, B7/N105, and DPB4/S167 TCR repertoires, showing sharing of TCRαβ clones across the time-points by the band connections in colors representing individuals. (F) Alluvial plots showing sharing of TCRα and TCRβ CDR3 chains across the time-points by the band connections in colors representing TRAV and TRBV usage.

References

    1. Bowe B., Xie Y., Al-Aly Z., Postacute sequelae of COVID-19 at 2 years. Nat. Med. 29, 2347–2357 (2023). - PMC - PubMed
    1. Su S., et al. , Epidemiology, clinical presentation, pathophysiology, and management of long COVID: An update. Mol. Psychiatry 28, 4056–4069 (2023). - PubMed
    1. Appelman B., et al. , Muscle abnormalities worsen after post-exertional malaise in long COVID. Nat. Commun. 15, 17 (2024). - PMC - PubMed
    1. Davis H. E., et al. , Characterizing long COVID in an international cohort: 7 months of symptoms and their impact. eClinicalMed. 38, 101019 (2021). - PMC - PubMed
    1. Michelen M., et al. , Characterising long COVID: A living systematic review. BMJ Glob Health 6, e005427 (2021). - PMC - PubMed

Substances