

Frequency and Longitudinal Course of Behavioral and Neuropsychiatric Symptoms in Participants With Genetic Frontotemporal Dementia
- PMID: 39284109
- PMCID: PMC11399068
- DOI: 10.1212/WNL.0000000000209569
Frequency and Longitudinal Course of Behavioral and Neuropsychiatric Symptoms in Participants With Genetic Frontotemporal Dementia
Abstract
Background and objectives: Behavioral and neuropsychiatric symptoms are frequent in patients with genetic frontotemporal dementia (FTD). We aimed to describe behavioral and neuropsychiatric phenotypes in genetic FTD, quantify their temporal association, and investigate their regional association with brain atrophy.
Methods: We analyzed data of pathogenic variant carriers in the chromosome 9 open reading frame 72 (c9orf72), progranulin (GRN), or microtubule-associated protein tau (MAPT) gene from the Genetic Frontotemporal dementia Initiative cohort study that enrolls both symptomatic pathogenic variant carriers and first-degree relatives of known carriers. Principal component analysis was performed to identify behavioral and neuropsychiatric clusters that were compared with respect to frequency and severity between groups. Associations between neuropsychiatric clusters and MRI-assessed atrophy were determined using voxel-based morphometry. We applied linear mixed effects and generalized linear mixed effects models to assess the longitudinal course of symptoms.
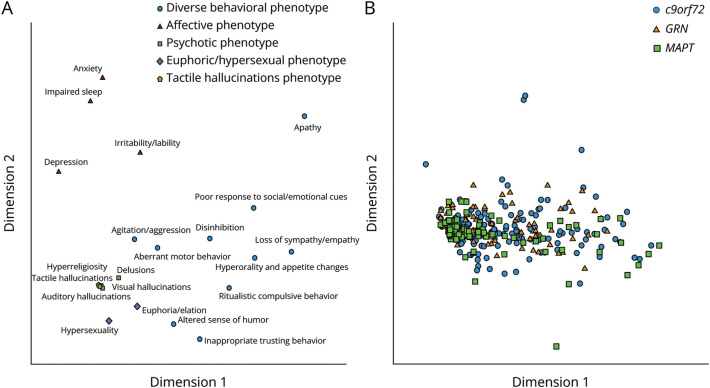
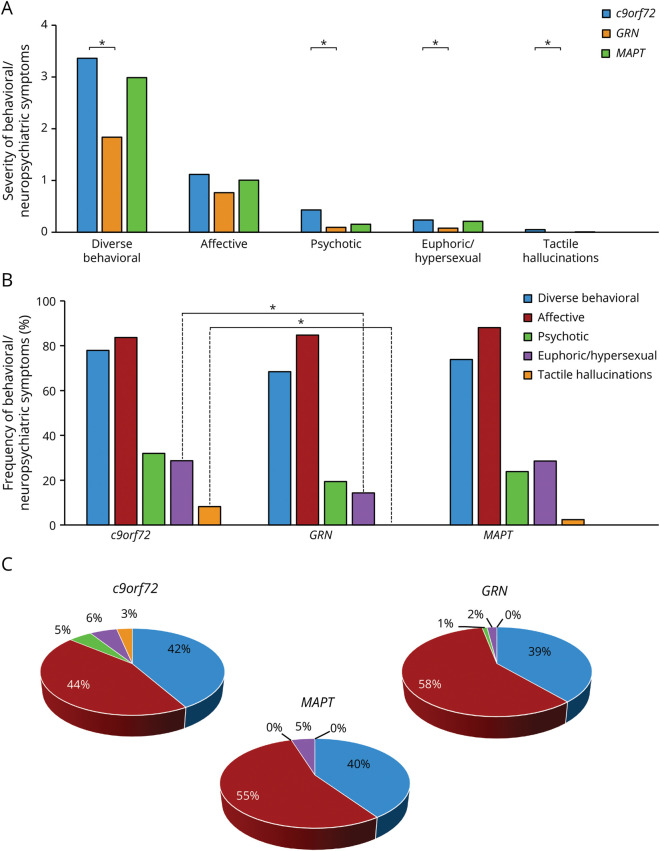
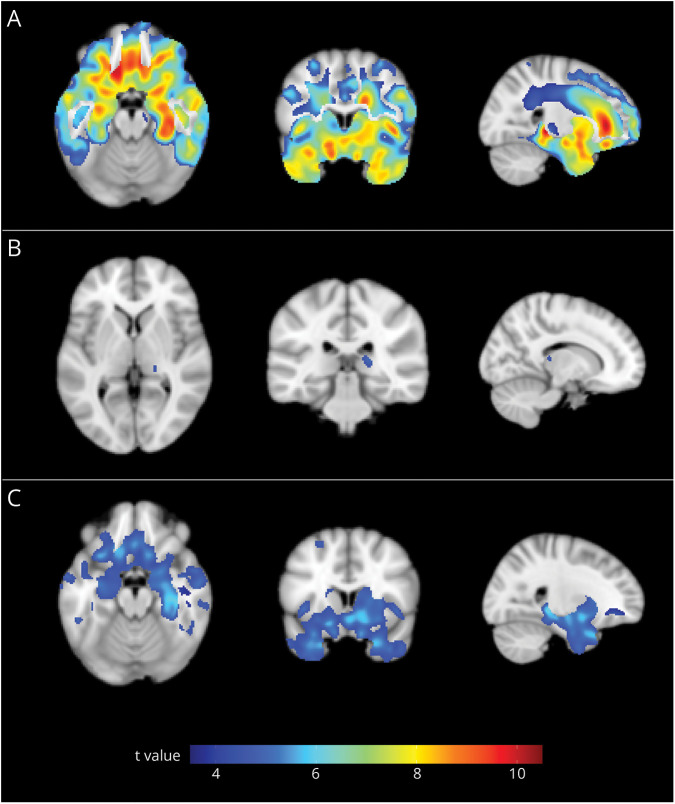
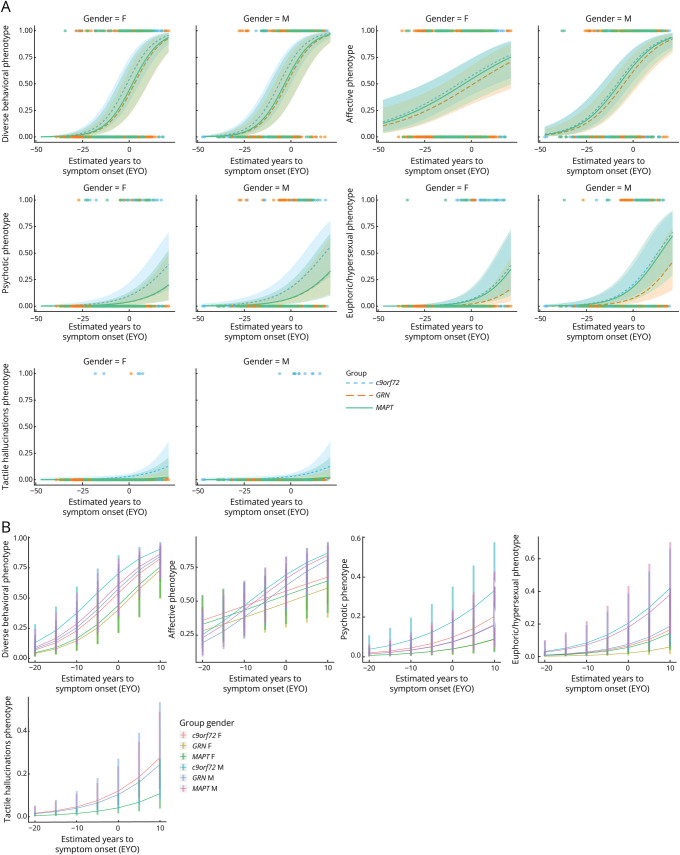
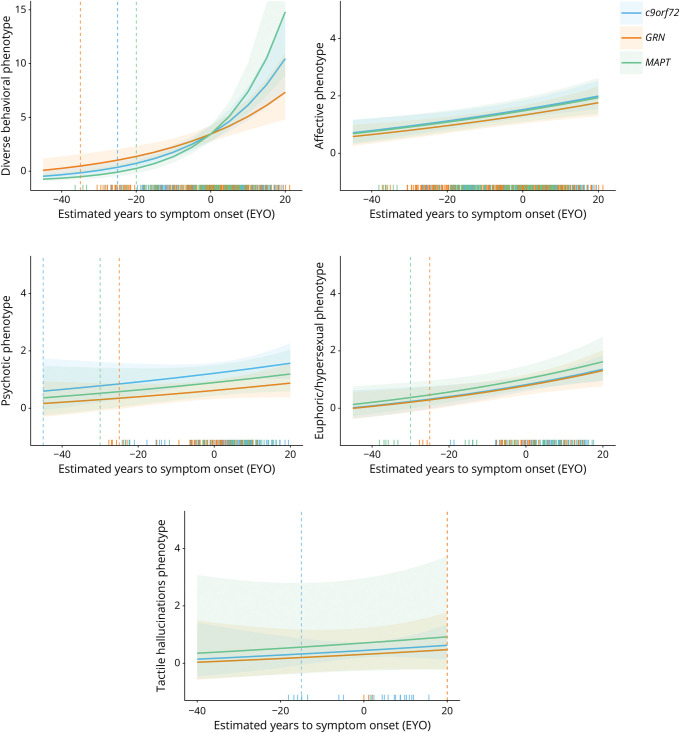
Results: A total of 522 participants were included: 221 c9orf72 (138 presymptomatic), 213 GRN (157 presymptomatic), and 88 MAPT (62 presymptomatic) pathogenic variant carriers. Principal component analysis revealed 5 phenotypic clusters (67.6% of variance), labeled diverse behavioral, affective, psychotic, euphoric/hypersexual, and tactile hallucinations phenotype. In participants presenting behavioral or neuropsychiatric symptoms, affective symptoms were most frequent across groups (83.6%-88.1%), followed by diverse behavioral symptoms (68.4%-77.9%). In c9orf72 and GRN pathogenic variant carriers, psychotic symptoms (32.0% and 19.4%, respectively) were more frequent than euphoric/hypersexual symptoms (28.7% and 14.2%, respectively), which was the other way around in MAPT pathogenic variant carriers (28.6% and 23.8%). Although diverse behavioral symptoms were associated with gray and white matter frontotemporal atrophy, only a small atrophy cluster in the right thalamus was associated with psychotic symptoms. Euphoric/hypersexual symptoms were associated with atrophy in mesial temporal lobes, basal forebrain structures, and the striatum (p < 0.05). Estimated time to symptom onset, genetic group, education, and sex influenced behavioral and neuropsychiatric symptoms (p < 0.05). Particularly, in c9orf72 pathogenic variant carriers, psychotic symptoms may be starting decades before recognition of onset of illness.
Discussion: We identified multiple clusters of behavioral and neuropsychiatric symptoms in participants with genetic FTD that relate to distinct cerebral atrophy patterns. Their severity depends on time, affected gene, sex, and education. These clinical-genetic associations can guide diagnostic evaluations and the design of clinical trials for new disease-modifying and preventive treatments.
Conflict of interest statement
S. Schönecker, F.J. Martinez-Murcia, J. Denecke, N. Franzmeier, A. Danek, O. Wagemann, C. Prix, E. Wlasich, J. Vöglein, S.V. Loosli, A. Brauer, J.-M. Górriz Sáez, A. Bouzigues, L.L. Russell, P.H. Foster, E. Ferry-Bolder, J.C. van Swieten, L.C. Jiskoot, H. Seelaar, R. Laforce, C. Graff, D. Galimberti, R. Vandenberghe, A. de Mendonça, P. Tiraboschi, I. Santana, A. Gerhard, S. Sorbi, M. Otto, F. Pasquier, C.R. Butler, I. Le Ber, E. Finger, M.C. Tartaglia, M. Masellis, J.B. Rowe, F. Moreno, J.D. Rohrer, J. Priller, and G.U. Höglinger report no disclosures relevant to the manuscript. S. Ducharme receives salary funding from the Fonds de Recherche du Québec-Santé, is involved with sponsored research (Biogen, Ionis Pharmaceuticals, Wave Life Sciences, Janssen), advisory boards (Biogen, Eisai, QuRALIS), has received speaking honorarium (Eisai), and is the co-founder of AFX Medical Inc. R. Sanchez-Valle has served in Advisory board meetings for Wave Life Sciences, Ionis, and Novo Nordisk and received personal fees for participating in educational activities from Janssen, Roche Diagnostics, and Neuroxpharma and funding to her institution for research projects from Biogen and Sage Pharmaceuticals. B. Borroni has served at scientific boards for Denali, Wave, Alector, and Aviadobio. M. Synofzik has received consultancy honoraria from Janssen Pharmaceuticals, Ionis Pharmaceuticals, and Orphazyme Pharmaceuticals, all unrelated to the present manuscript. J. Levin reports speaker fees from Bayer Vital, Biogen, and Roche, consulting fees from Axon Neuroscience and Biogen, author fees from Thieme medical publishers and W. Kohlhammer GmbH medical publishers. In addition, he reports compensation for serving as a chief medical officer for MODAG GmbH, is beneficiary of the phantom share program of MODAG GmbH, and is inventor in a patent “Pharmaceutical Composition and Methods of Use” (EP 22 159 408.8) filed by MODAG GmbH, all activities outside the submitted work. Go to
Figures
References
MeSH terms
Substances
LinkOut - more resources
Full Text Sources
Miscellaneous