. 2024 Sep 16;15(1):8114.
doi: 10.1038/s41467-024-52352-z.

Erythropoietin regulates energy metabolism through EPO-EpoR-RUNX1 axis

Affiliations

Erythropoietin regulates energy metabolism through EPO-EpoR-RUNX1 axis

Weiqin Yin et al. Nat Commun. .

Abstract

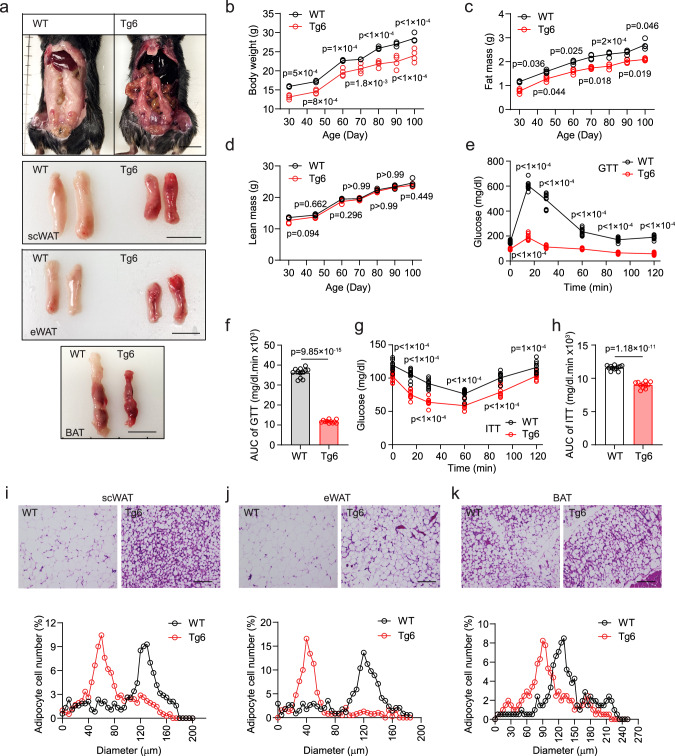
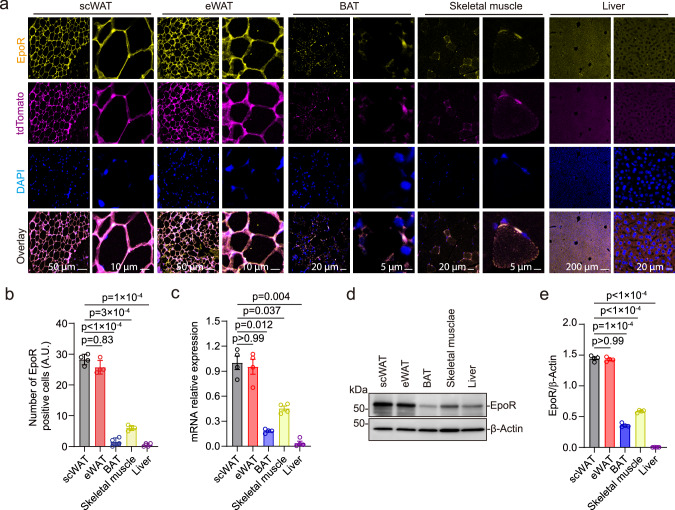
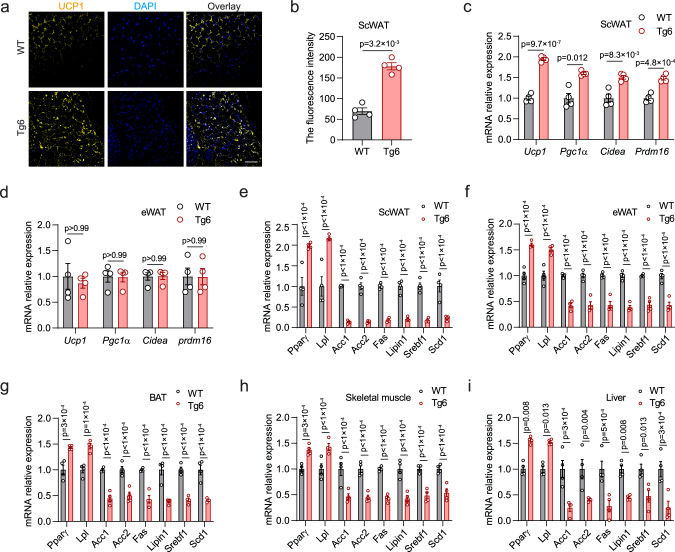
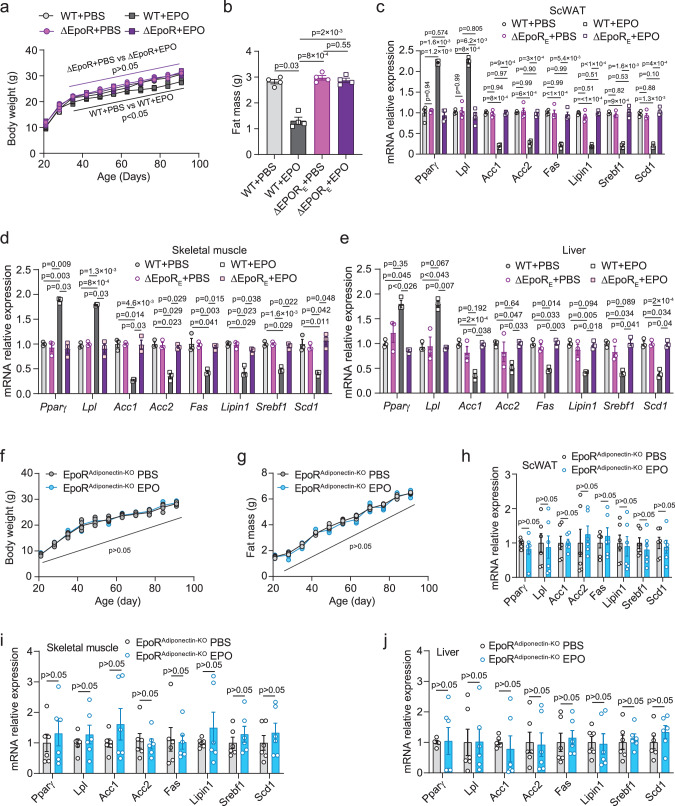
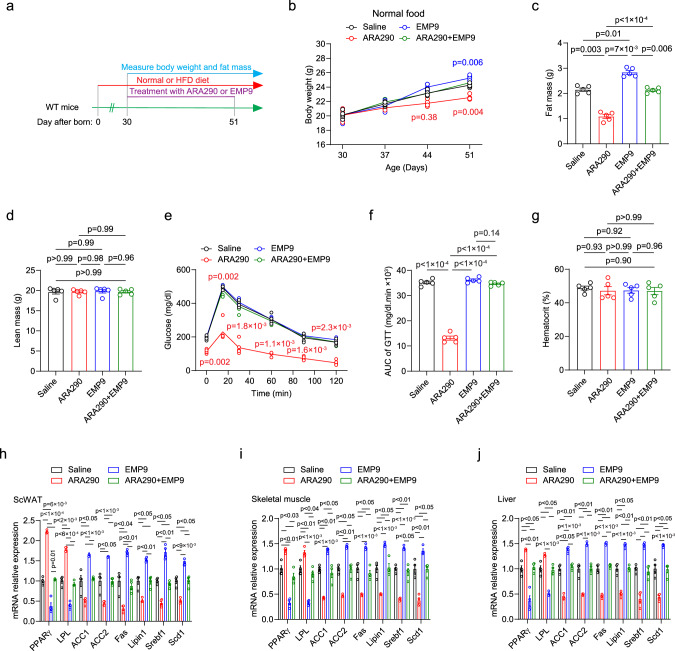
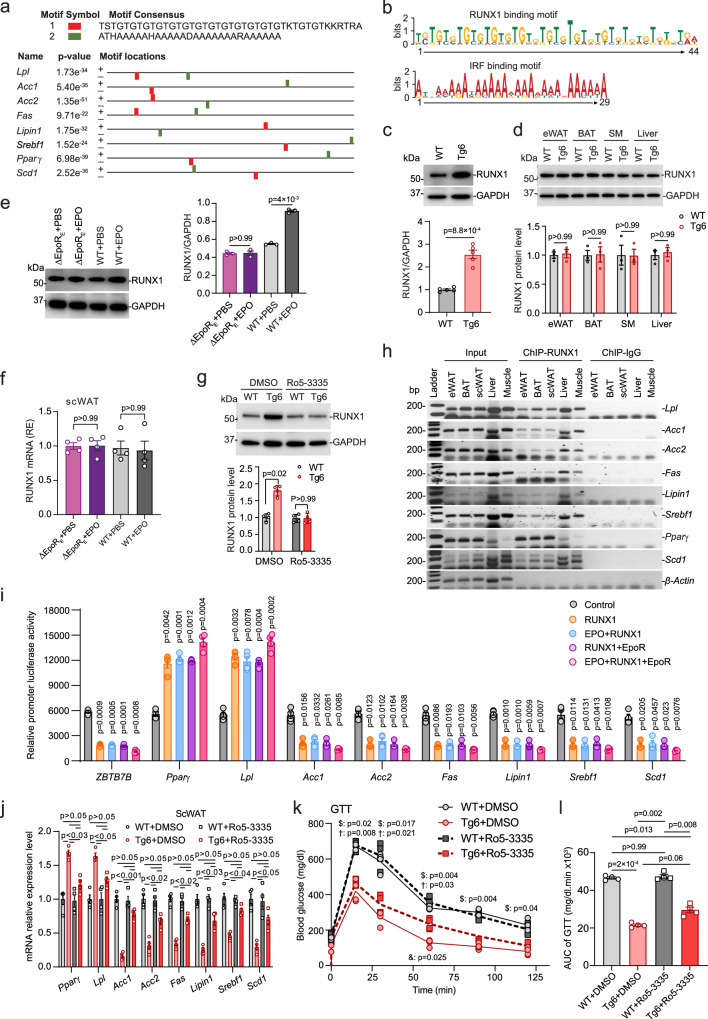
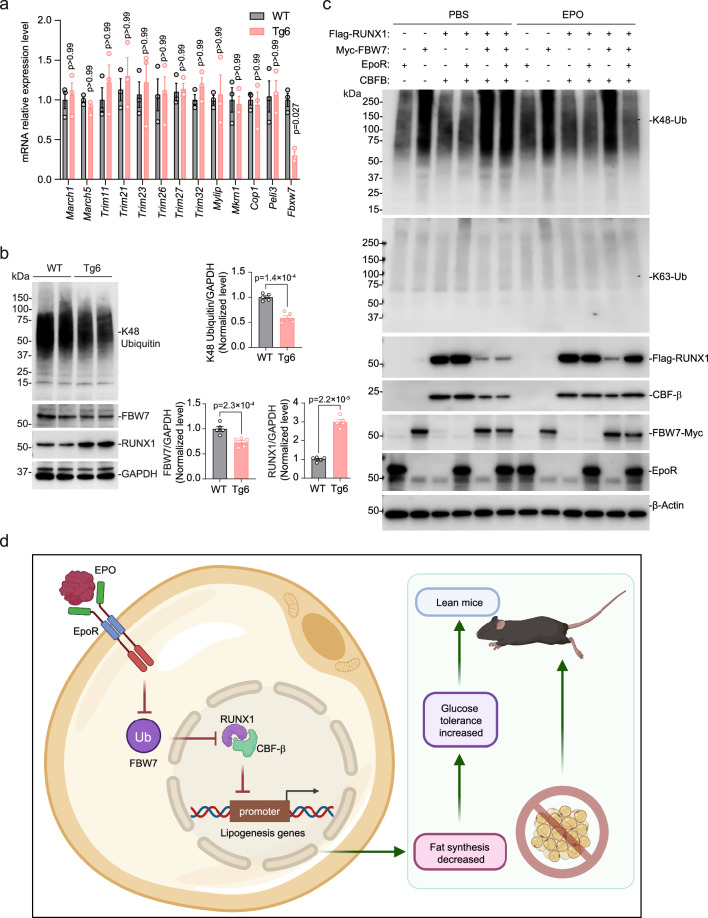
Erythropoietin (EPO) plays a key role in energy metabolism, with EPO receptor (EpoR) expression in white adipose tissue (WAT) mediating its metabolic activity. Here, we show that male mice lacking EpoR in adipose tissue exhibit increased fat mass and susceptibility to diet-induced obesity. Our findings indicate that EpoR is present in WAT, brown adipose tissue, and skeletal muscle. Elevated EPO in male mice improves glucose tolerance and insulin sensitivity while reducing expression of lipogenic-associated genes in WAT, which is linked to an increase in transcription factor RUNX1 that directly inhibits lipogenic genes expression. EPO treatment in wild-type male mice decreases fat mass and lipogenic gene expression and increase in RUNX1 protein in adipose tissue which is not observed in adipose tissue EpoR ablation mice. EPO treatment decreases WAT ubiquitin ligase FBXW7 expression and increases RUNX1 stability, providing evidence that EPO regulates energy metabolism in male mice through the EPO-EpoR-RUNX1 axis.


Conflict of interest statement

The authors declare no competing interests.

Figures

Fig. 1
Fig. 1. Chronic high EPO transgenic expression in young mice decreased fat mass, increased glucose and insulin tolerance, and reduced adipocyte size in adipose tissue.
Metabolic parameters were determined for young, male Tg6-mice (constitutive transgenic EPO expression) compared with wild-type (WT) mice on normal chow diet from postnatal 21 days to postnatal 100 days. a Tg6-mice exhibited reduced body size and smaller fat pads from subcutaneous WAT (scWAT), epididymal WAT (eWAT) and BAT compared with WT-mice. Scale bar: 1.0 cm. bh Body weight (b F(6, 18) = 2.82), fat mass (c F(2.220, 6.660) = 3.209), glucose tolerance test (GTT) (e F(5, 49) = 323.1) and area under the curve (AUC) for GTT (f t = 33.26, df = 21), and insulin tolerance test (ITT) (g F(5, 49) = 6.470) and AUC for ITT (h t = 15.07, df = 21) were reduced, but lean mass (d F(6, 18) = 0.5754) was similar in Tg6-mice (red) compared with WT-mice (gray). ik H&E-stained sections of adipose tissue from scWAT (i), eWAT (j), and BAT (k) showed reduced adipocyte size in Tg6-mice (red) compared with WT-mice (gray). p values are indicated. f, h: t-test; be, g, ik: two-way ANOVA with Bonferroni’s multiple comparisons test. Scale bar: scWAT: 50 μm; eWAT and BAT: 25 μm. bd WT-mice and Tg6-mice: n = 4/group; eh WT-mice: n = 12, Tg6-mice: n = 11; ik n = 200 cells/group. f, h Data shown as mean ± SEM. f, h: two-sided unpaired t-test. p values indicated in figure. Source data are provided as a Source Data file.
Fig. 2
Fig. 2. Tissue-specific expression of EpoR was determined in EpoR-tdTomato-Cre mice.
a Images shown are staining of scWAT, eWAT, BAT, skeletal muscle, and liver from male mice (postnatal 100 days) for EpoR (yellow), tdTomato (purple), and DAPI (blue) at low and high (scale bar: as indicated) magnification. Scale bar: scWAT and eWAT, 50 μm (left), 10 μm (right); BAT and Skeletal muscle, 20 μm (left), 5 μm (right); Liver, 200 μm (left), 20 μm (right). bc Number of EpoR positive cells (b F(1.574, 4.721) = 366.9) and relative mRNA expression determined by qPCR (c F(1.941, 5.824) = 52.06) were assessed for scWAT (gray), eWAT (red), BAT (blue), skeletal muscle (yellow), and liver (purple). de EpoR protein expression was determined by western blotting with β-actin as control (d) and was quantified by ImageJ (e F(1.540, 4.619) = 2194) for scWAT (gray), eWAT (red), BAT (blue), skeletal muscle (yellow), and liver (purple). Data are shown as mean ± SEM. b, c, e: n = 4 mice/group. b, c: the result shown in figure represents one of three independent experiments, p values are indicated. Scale bars indicated in the figure. One-way ANOVA with Bonferroni’s multiple comparisons test. Source data are provided as a Source Data file.
Fig. 3
Fig. 3. Expression of lipid metabolism-associated genes in Tg6-mice with high EPO compared with WT-mice.
ab Images show staining for uncoupling protein 1 (UCP1; yellow) and DAPI (blue) in scWAT from WT-mice and Tg6-mice (a) and quantification of fluorescence intensity by ImageJ (b (t, df = 8.656, 3)). cd Two-sided unpaired t-test. Scale bar: 200 μm. Gene expression of BAT-associated genes Ucp1, peroxisome proliferator-activated receptor-γ coactivator 1α (Pgc1α), cell death-indicating DNA fragmentation factor a-like effector A (Cidea) and Prdm16 in scWAT (c F(3, 9) = 14.44) and eWAT (d F(3, 9) = 0.1504) from WT-mice and Tg6-mice. ei Gene expression was determined by real-time quantitative PCR (qPCR) for peroxisome proliferator-activated receptor γ (PPARγ), lipoprotein lipase (LPL), acetyl-CoA carboxylases (ACC1, ACC2), Fas, Lipin1, sterol regulatory element binding protein 1 (Srebf1), and stearoyl-CoA desaturase 1 (Scd1) for scWAT (e F(7, 21) = 41.43), eWAT (f F(7, 21) = 52.60), BAT (g F(7, 21) = 32.11), skeletal muscle (h F(7, 21) = 33.81), and liver (i F(7, 21) = 14.66) for WT-mice and Tg6-mice. Bars indicate WT-mice (gray) and Tg6-mice (red) mice. bi: n = 4 mice/group, the result shown in figure represent one of three independent experiments. Data shown as mean ± SEM. p values are indicated. b: t-test; ci: two-way ANOVA with Bonferroni’s multiple comparisons test. Source data are provided as a Source Data file.
Fig. 4
Fig. 4. EPO regulation of lipid metabolism gene expression in WT-mice was not evident in ΔEpoRE mice or mice that lack EpoR in WAT.
ab Body weight (a F(2.61, 7.82) = 4.15) and fat mass (b F(1.225, 3.675) = 69.91) were determined for WT-mice treated with PBS (light gray) or EPO (dark gray) and ΔEpoRE mice treated with PBS (light purple) or EPO (purple) for 3 weeks beginning at postnatal 21 days. ce WT-mice were treated with PBS (light gray) or EPO (dark gray) and ΔEpoRE mice were treated with PBS (light purple) or EPO (purple) for 3 weeks beginning at postnatal 21 days and gene expression determined for Pparγ, Lpl, Acc1, Acc2, Fas, Lipin1, Srebf1, and Scd1 by qPCR in the scWAT (c F(2.397, 7.192) = 113.7), skeletal muscle (d F(1.586, 3.173) = 44.39), and liver (e F(1.884, 3.769) = 15.88). fg Body weight (f F(10, 50) = 0.577) and fat mass (g F(10, 50) = 2.661) were determined for EpoRAdiponectin-KO mice treated with PBS (gray) or EPO (blue). hj EpoRAdiponectin-KO mice were treated with PBS (gray) or EPO (blue) for 3 weeks beginning at postnatal 21 days and gene expression for Pparγ, Lpl, Acc1, Acc2, Fas, Lipin1, Srebf1, and Scd1 in scWAT (h F(7, 35) = 0.3032), skeletal muscle (i F(7, 35) = 0.4291), and liver (j F(7, 35) = 0.2572) determined by qPCR. Data shown as mean ± SEM. ac n = 4; d, e n = 3; fj n = 6, be, hj: the n means mice per group. The result shown in figure represents one of three independent experiments. p values are indicated. One-way or Two-way ANOVA with Bonferroni’s multiple comparisons test. Source data are provided as a Source Data file.
Fig. 5
Fig. 5. EpoR agonist ARA290 treatment in WT-mice decreased fat mass and increased glucose tolerance, without increasing EPO stimulated erythropoiesis.
Non-erythropoietic EpoR agonist ARA290, but not EpoR antagonist EMP9 mimics the EPO effect on fat accumulation in the WT-mice. a Experiment set up chart. bg WT-mice were fed normal chow diet and treated with Saline (black), ARA290 (red), EMP9 (blue), or ARA290 + EMP9 (green) for 3 weeks and body weight (b F(3.187, 12.75) = 7.169), fat mass (c F(1.907, 7.627) = 100.2), lean mass (d F(1.956, 7.823) = 0.0441), glucose tolerance (GTT) (e F(2.632, 10.53) = 15.13) and area under the curve (AUC for GTT) (f F(2.255, 9.019) = 347.2), and hematocrit (g F(1.932, 7.726) = 0.2888) were determined. hj Lipid metabolism genes expression in the scWAT (h F (2.568, 7.703) = 161.1), skeletal muscle (i F(2.762, 8.285) = 74.57), and liver (j F(2.748, 8.244) = 69.77) was assayed with qRT-PCR in WT-mice feed normal chow diet and treated with ARA290, EMP9, or ARA290 + EMP9; saline treated group was used as control. bj: n = 5 mice/group. The result shown in figure represents one of three independent experiments. Data shown as mean ± SEM. One-way or Two-way ANOVA with Bonferroni’s multiple comparisons test. Source data are provided as a Source Data file.
Fig. 6
Fig. 6. Regulation of lipid metabolism-associated gene expression in scWAT by EPO assessed by conserved motif identification.
ad Promoter sequences of lipid metabolism genes in Tg6 scWAT were analyzed using Clustal Omega and MEME. RUNX motif (a red; b upper); IRF motif (a green; b lower). Western blotting for RUNX1 protein in WT (gray) and Tg6 (red) scWAT (c, n = 5, t = 8.151, df = 8, two-sided unpaired t-test), eWAT, BAT, skeletal muscle, and liver (d, n = 3, F(3, 6) = 0.06043), data shown as mean ± SEM. e, f Western blotting for RUNX1 protein (e, n = 3, F(1.13, 2.25) = 230) and qPCR for relative gene expression (f, n = 4, F(1.216, 3.649) = 0.2208) in ΔEpoRE and WT-mice treated with EPO for 3 weeks (ΔEpoRE, purple; WT, grey), quantified with GAPDH control by ImageJ. g Western blotting for scWAT RUNX1 protein in WT (dark gray) and Tg6 (red) mice treated with RUNX1 inhibitor Ro5-3335 (5 mg/kg) or DMSO control (WT, light gray; Tg6, light red), n = 4, F(1, 3) = 16.15, data shown as mean ± SD. h RUNX1 protein binding to proposed promoter regions in lipid metabolism genes by ChIP analysis with β-actin control for WT scWAT (Input DNA, ChIP-RUNX1, ChIP-IgG), original images in Supplementary Fig. 16. i Transcription activity for RUNX1-binding regions from promoters inserted into luciferase-reporter plasmids, with ZBTB7B control for RUNX1-dependent silencer activity in HEK293T cells, co-transfected with various plasmids, F(2.792, 8.376) = 91.56. j Lipid metabolism gene expression (qPCR) in scWAT of WT and Tg6-mice treated with RUNX1 inhibitor Ro5-3335 (Ro5-3335 treatment group, squares; WT, dark gray; Tg6, red) or DMSO control (circles; WT, light gray; Tg6, light red), F(2.709, 8.128) = 31.27. k, l Glucose tolerance test (GTT, k F(2.489, 7.468) = 10.55) and area under the curve (AUC, l F(2.045, 6.136) = 170.1) for mice treated with RUNX1 inhibitor (Ro5-3335) (WT, dark gray; Tg6, red) or DMSO control (WT, light gray; Tg6, light red). Comparisons indicated: $WT + DMSO vs Tg6 + DMSO; WT + Ro5-3335 vs Tg6 + Ro5-3335; &Tg6 + DMSO vs Tg6 + Ro5-3335; mean ± SEM. il n = 4/group, the result shown in figure represent one of three independent experiments. One-way or two-way ANOVA with Tukey’s (i) or Bonferroni’s (dg, jl) multiple comparisons test. Source data are provided as a Source Data file.
Fig. 7
Fig. 7. EPO activation of EpoR signaling in scWAT inhibited ubiquitin ligase FBW7, thereby increasing RUNX1 protein stability.
a E3 ubiquitin ligase-related proteins MARCH1, MARCH5, TRIM11, TRIM21, TRIM23, TRIM26, TRIM27, TRIM32, MYLIP, MKRN1, COP1, PELI3, and FBW7 relative gene expression were determined by qPCR for scWAT of WT-mice (gray) and Tg6-mice (red) (n = 3/genotype; the result shown in figure represents one of three independent experiments. t-test, F(12, 24) = 1.313). b K48 Ubiquitin and FBW7 and RUNX1 protein expression were determined by western blotting with GAPDH as control (left) were determined for scWAT WT-mice (gray) and Tg6-mice (red) mice and were quantified by ImageJ (right). High transgenic EPO expression in Tg6-mice significantly inhibited FBW7 protein expression with a decrease in K48 Ubiquitin, and increased RUNX1 protein in scWAT. (n = 5/genotype; t-test). K48: t = 7.564, df = 8; FBW7: t = 4.407, df = 8; RUNX1: t = 14.27, df = 8. c HEK293T cells were transfected with expression plasmids for FBW7 (FBW7-Myc), and/or RUNX1 (Flag-RUNX1), and/or CBFβ, and/or EpoR and were treated with EPO (3 U/ml) or PBS for 24 h. The ubiquitylation of K48-Ub and K63-Ub, and protein levels of Flag-RUNX1, FBW7-Myc, CBFβ, and EpoR were determined by western blotting with β-actin as control. d Proposed model for EPO–EpoR axis protects against fat store by regulating lipogenic and lipolysis signaling pathway in the scWAT. Elevated EPO increases EPO binding to and activation of EpoR in scWAT resulting in reduction of ubiquitin ligase FBW7 and promotes RUNX1 stability and activity to regulate lipid metabolism and fat storage and to trigger lipolysis and promotes a lean phenotype in mice. Created with BioRender.com. Figure 7d Created with BioRender.com released under a Creative Commons Attribution-NonCommercial-NoDerivs 4.0 International license. Data shown as mean ± SEM. p values are indicated. Two-way ANOVA with Bonferroni’s multiple comparisons test (a), two-sided unpaired t-test (b). Source data are provided as a Source Data file.

References

    1. Bhoopalan, S. V., Huang, L. J. & Weiss, M. J. Erythropoietin regulation of red blood cell production: from bench to bedside and back. F1000Res.9, F1000 Faculty Rev-1153 (2020). 10.12688/f1000research.26648.1 - DOI - PMC - PubMed
    1. Wakhloo, D. et al. Functional hypoxia drives neuroplasticity and neurogenesis via brain erythropoietin. Nat. Commun.11, 1313 (2020). 10.1038/s41467-020-15041-1 - DOI - PMC - PubMed
    1. Cai, Z. & Semenza, G. L. Phosphatidylinositol-3-kinase signaling is required for erythropoietin-mediated acute protection against myocardial ischemia/reperfusion injury. Circulation109, 2050–2053 (2004). 10.1161/01.CIR.0000127954.98131.23 - DOI - PubMed
    1. Jia, Y., Suzuki, N., Yamamoto, M., Gassmann, M. & Noguchi, C. T. Endogenous erythropoietin signaling facilitates skeletal muscle repair and recovery following pharmacologically induced damage. FASEB J.26, 2847–2858 (2012). 10.1096/fj.11-196618 - DOI - PMC - PubMed
    1. Katz, O. et al. Erythropoietin treatment leads to reduced blood glucose levels and body mass: insights from murine models. J. Endocrinol.205, 87–95 (2010). 10.1677/JOE-09-0425 - DOI - PubMed

Publication types

MeSH terms

LinkOut - more resources