. 2024 Sep 16;15(1):8131.
doi: 10.1038/s41467-024-52509-w.

Lipoprotein metabolism mediates hematopoietic stem cell responses under acute anemic conditions

Affiliations

Lipoprotein metabolism mediates hematopoietic stem cell responses under acute anemic conditions

Kiyoka Saito et al. Nat Commun. .

Abstract

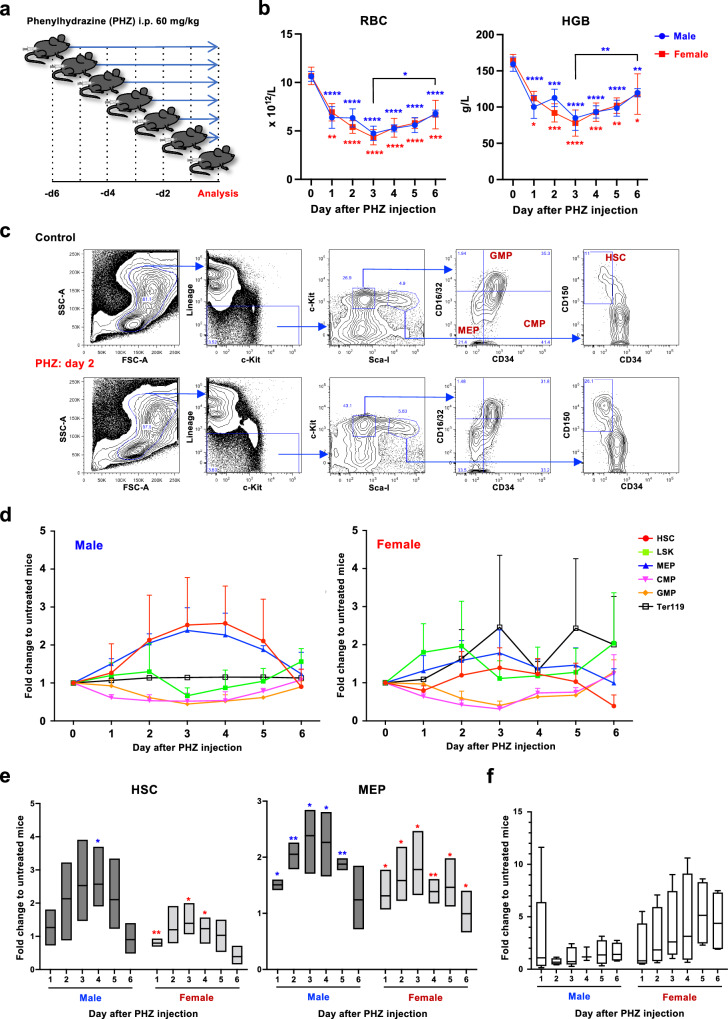
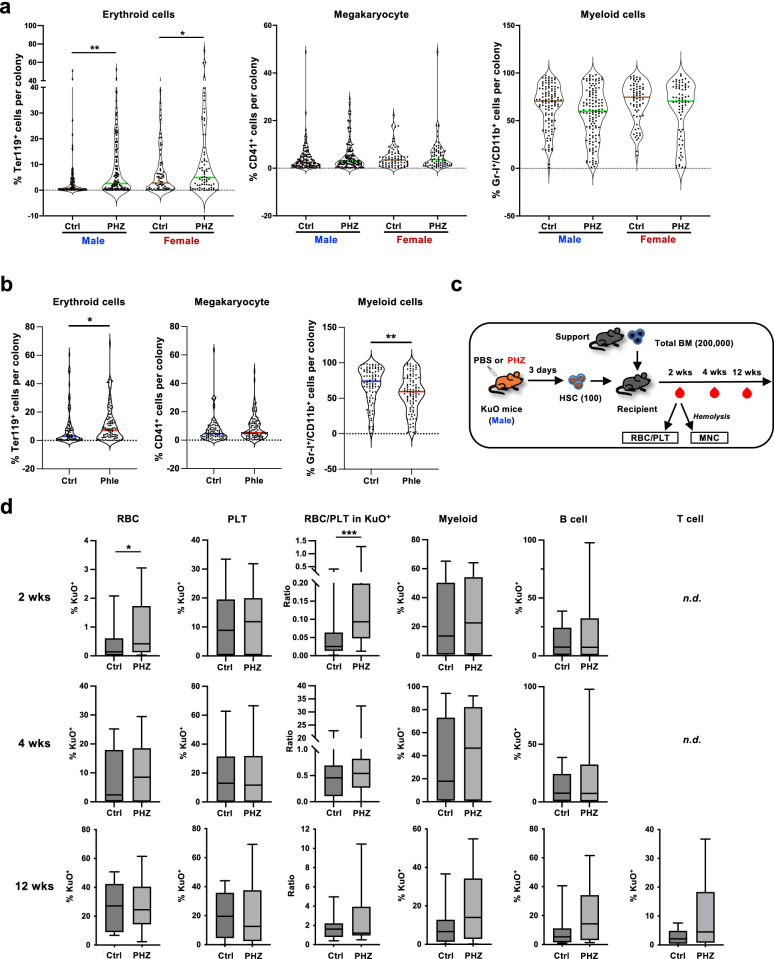
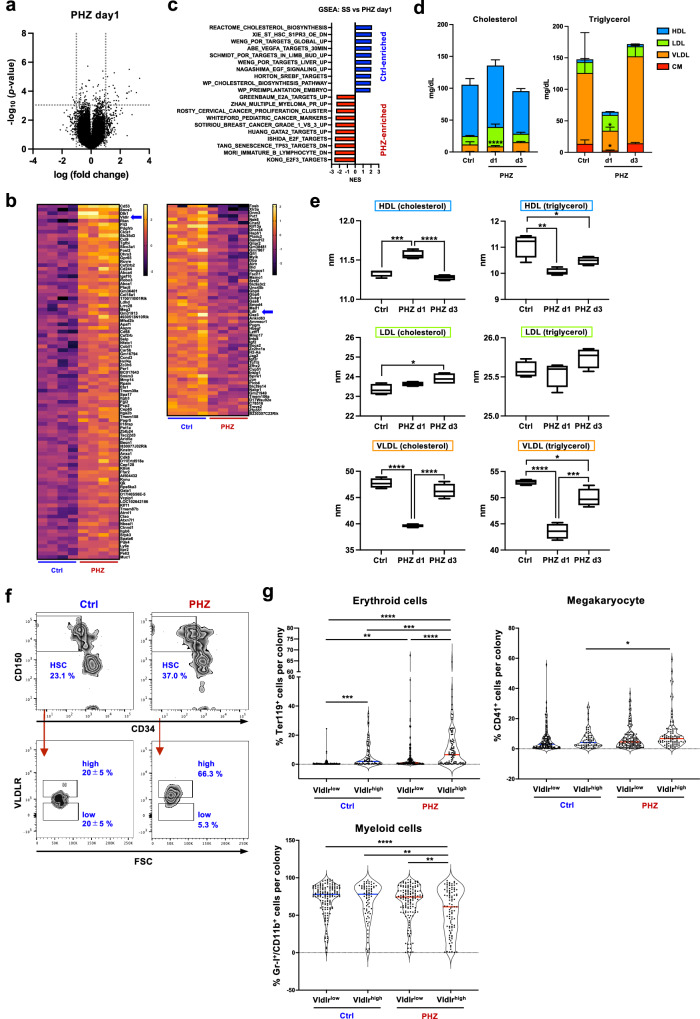
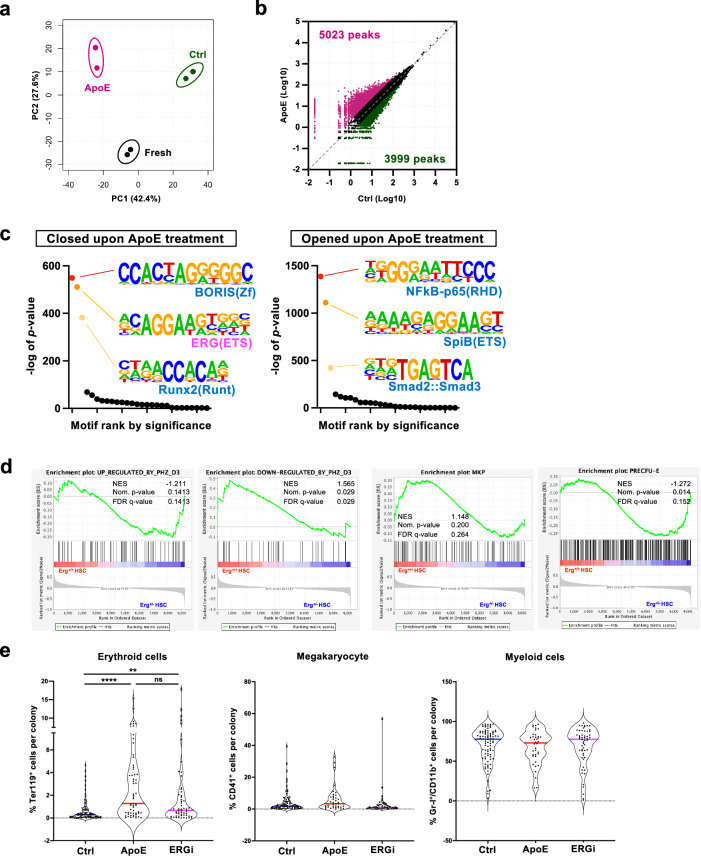
Hematopoietic stem cells (HSCs) react to various stress conditions. However, it is unclear whether and how HSCs respond to severe anemia. Here, we demonstrate that upon induction of acute anemia, HSCs rapidly proliferate and enhance their erythroid differentiation potential. In severe anemia, lipoprotein profiles largely change and the concentration of ApoE increases. In HSCs, transcription levels of lipid metabolism-related genes, such as very low-density lipoprotein receptor (Vldlr), are upregulated. Stimulation of HSCs with ApoE enhances their erythroid potential, whereas HSCs in Apoe knockout mice do not respond to anemia induction. VldlrhighHSCs show higher erythroid potential, which is enhanced after acute anemia induction. VldlrhighHSCs are epigenetically distinct because of their low chromatin accessibility, and more chromatin regions are closed upon acute anemia induction. Chromatin regions closed upon acute anemia induction are mainly binding sites of Erg. Inhibition of Erg enhanced the erythroid differentiation potential of HSCs. Our findings indicate that lipoprotein metabolism plays an important role in HSC regulation under severe anemic conditions.


Conflict of interest statement

The authors declare no competing interests.

Figures

Fig. 1
Fig. 1. HSCs expand upon acute anemia induction.
a Experimental design of the PB and BM analysis after hemolysis induction. Hemolytic anemia was induced by intraperitoneally injecting 60 mg/kg of PHZ or the same volume of PBS. The analysis of all groups was done on the same day. The figure was created by authors. b PB analysis of the PHZ-treated mice. Red blood cell count (RBC) and hemoglobin concentration (HGB) are shown. See also Supplementary Fig. S1A. Four male and three female mice were used for each time point. Mean ± SEM are shown. Significance was calculated between day 0 (untreated) and each time point unless separately indicated. Adjusted p values were obtained using one-way ANOVA (Tukey’s multiple comparison test). c Representative FACS plot of hematopoietic stem and progenitor populations in the BM of control (Ctrl) or PHZ-treated mice. Each population was defined as the following: HSC (CD150+CD34-c-kit+Sca-I+Lineage-; CD150+CD34-KSL), granulocyte/macrophage lineage-restricted progenitors (GMP; CD34+CD16/32+c-kit+Sca-I-Lineage-), common myeloid progenitors (CMP; CD34+CD16/32-c-kit+Sca-I-Lineage-), megakaryocyte/erythrocyte lineage-restricted progenitors (MEP; CD34-CD16/32-c-kit+Sca-I-Lineage-). d Fold change of the frequencies of HSC and progenitor fractions over experimental time. Fold change compared with day 0 (untreated) mice (mean ± SEM) are shown. n = 3. e Fold change of HSC (left) and MEP (right) populations in male and female BM. Fold change compared with day 0 (untreated) mice (mean ± SEM) are shown. Six male and three female mice were used for each time point. Each bar extends from the minimum value to the maximum value, with center lines showing the mean value. Four mice for each time point were used. P values were obtained using one sample t and Wilcoxon test. f Fold change of HSC in the male and female spleen. Fold change compared with day 0 (untreated) mice (mean ± SEM) are shown. Each bar extends from the minimum value to the maximum value, with center lines showing the mean value. Four mice for each time point were used. Adjusted P values were obtained using one-way ANOVA (Dunnett’s multiple comparisons test). *p < 0.05, **p < 0.01, ***p < 0.001, ****p < 0.0001. Exact P values are provided as Source Data.
Fig. 2
Fig. 2. HSCs under anemic conditions show enhanced erythroid differentiation potential.
a CFU-FACS of HSCs derived from PBS-treated control (Ctrl) or PHZ-treated mice. Data of male and female mice on day 3 are shown. Frequencies of Ter119+ cells (Erythrocyte), CD41+ cells (Megakaryocyte), and Gr-I+Mac-I+ cells (Myelocyte) in individual colonies. Each dot represents one colony. n = 70-130 from the total of 3 experiments. Adjusted p values were obtained using one-way ANOVA (Tukey’s multiple comparison test). b CFU-FACS of HSCs derived from untreated (Ctrl) or phlebotomized male mice on day 3. n = 84–93 from the total of 3 experiments. P values were obtained using Kolmogorov–Smirnov test. c Experimental design of transplantation assay. One hundred CD150+CD34-KSL cells isolated from KuO mice (donor) treated with PBS or PHZ were mixed with 2 × 105 total bone marrow cells of Ly-5.2 mice (competitor) and then transplanted into Ly-5.2 mice irradiated with 900 cGy (recipient). PB was collected and subjected to flow cytometry analyses two, four, and twelve weeks after transplantation. The figure was created by authors. d Frequencies of KuO+ cells in different cell types of PB. nd: not detected. Twenty-one recipient mice transplanted from three donor mice for each condition were used. Box plots show the median (center line) first and third quartiles (box limits), and whiskers extend to minimum and maximum values. P values were obtained using two-tailed Mann–Whitney rank tests. *p < 0.05, **p < 0.01, ***p < 0.001. Exact P values are provided as Source Data.
Fig. 3
Fig. 3. HSCs under acute anemia elevates erythroid signature genes.
ELISA assay to measure concentrations of EPO, SCF, and CXCL12 in blood plasma (a) or BM fluid (b) on day 3. Four mice for the control condition and five mice for PHZ and phlebotomy were used. Data are presented as mean values mean ± SD. Adjusted p values were obtained using one-way ANOVA (Tukey’s multiple comparison test). c Volcano plot showing differentially expressed genes in HSC upon PHZ treatment (day 3) (left) and phlebotomy (right). Significant difference was defined as p < 0.001 and log2 fold change < −1 or > 1. The p values are not adjusted. d Venn diagrams depicting the overlap of up- or down-regulated genes between PHZ-treatment and phlebotomy. e Heatmaps showing the genes commonly differentially upregulated (left) and downregulated (right) in HSCs (CD150+CD34-KSL) isolated from PHZ-injected mice (PHZ) and phlebotomized mice (Phle) compared with HSC from control mice (Ctrl). f Enrichment of progenitor/precursor gene signatures in HSCs of PHZ treated mice. The gene signatures of each cell type were generated from the gene expression data of Pronk et al.. NES: normalized enrichment score. g Summary of GSEA comparing PHZ and Phle vs Ctrl. The top 10 gene signatures are shown. See also Supplementary Data 2. h Representative MsigDB enriched in the HSCs isolated from PHZ-treated or phlebotomized mice. P values in c, f, and h were adjusted with Benjamini–Hochberg method. *p < 0.05, **p < 0.01, ***p < 0.001, ****p < 0.0001. Exact P values are provided as Source Data.
Fig. 4
Fig. 4. Cholesterol metabolism is altered upon acute anemia induction.
a Volcano plot showing differentially expressed genes in HSCs 24 hours after PHZ treatment. Significant difference was defined as p < 0.001 and log2 fold change < −1 or > 1. The p values are not adjusted. b Heatmaps showing up- or down-regulated genes in HSCs isolated from PHZ-injected mice (PHZ) compared with HSCs from control mice (Ctrl). The blue arrows highlight Vldlr and Ldlr genes. c Summary of GSEA comparing PHZ day1 vs Ctrl HSC. The top 10 gene signatures are shown. NES: normalized enrichment score. See also Supplementary Data 3. d Lipoprotein profiling of PB. The concentrations of cholesterol and triglycerol in different lipoproteins are shown. HDL high-density lipoprotein; LDL, low-density lipoprotein; VLDL, very low-density lipoprotein; CM, chylomicron. Four mice for each condition were used. Data are presented as mean values + SD. e The particle size of each lipoprotein. Four mice for each condition were used. Box-plots show the median (center line) first and third quartiles (box limits), and whiskers extend to minimum and maximum values. f Vldlr expression on HSCs. Representative FACS plot of Vldlr expression on CD150+CD34- population (KSL gated) of Ctrl and PHZ-treated mice are shown. Vldlr gates show Vldlrlow and Vldlrhigh populations. g CFU-FACS of VldlrhighHSC and VldlrlowHSC derived from Ctrl and PHZ-treated mice. n = 75-151 from the total of 3 experiments. Adjusted p values were obtained using one-way ANOVA (Tukey’s multiple comparison test). *p < 0.05, **p < 0.01, ***p < 0.001, ****p < 0.0001. Exact P values are provided as Source Data.
Fig. 5
Fig. 5. Chromatin accessibility difference between VldlrhighHSCs and VldlrlowHSCs.
a Principal component analysis (PCA) of the ATAC-seq data of Vldlrhigh and VldlrlowHSC derived from the steady state (SS) or PHZ-treated (PHZ) mice. Data are presented as mean values +/− SD. Scatter plots comparing ATAC-seq peaks between VldlrhighHSC and VldlrlowHSC in the SS mice (b) or PHZ-treated mice (c). d Average plot (top) and heatmap (bottom) of open chromatin regions in Vldlrhigh and VldlrlowHSC derived from the steady state (SS) or PHZ-treated (PHZ) mice. e The enrichment of genes related to “unchanged between Vldlrhigh and Vldlrlow HSC under SS conditions but closed in VldlrhighHSC upon PHZ treatment”. P values were adjusted with Benjamini–Hochberg method. f Motif analysis of open chromatin regions closed in VldlrhighHSC under SS condition (left) or after PHZ-treatment (right). Ranks of motifs enriched in each condition are shown. P values were not adjusted. g Motif analysis of open chromatin regions closed upon PHZ treatment in VldlrlowHSC (left) or VldlrhighHSC (right). Ranks of motifs enriched in each condition are shown. P values were not adjusted. *p < 0.05, **p < 0.01, ***p < 0.001, ****p < 0.0001. Exact P values are provided as Source Data.
Fig. 6
Fig. 6. ApoE controls the erythroid differentiation potential of HSCs.
a ELISA assay to measure concentrations of ApoE in blood plasma (left) or BM fluid (right). Five mice were used for each time point. The fold changes to day 0 were evaluated. Adjusted P values were obtained using one-way ANOVA (Dunnett’s multiple comparisons test). b CFU-FACS of HSCs derived from Ctrl or PHZ-treated Apoe-/- mice. n = 137–159 from the total of 3 experiments. P values were obtained using two-tailed Mann–Whitney rank tests. c Experimental design of CFU-FACS of HSCs derived from Apoe−/− mice engrafted with WT BM cells. WT BM cells were transplanted to WT mice or Apoe−/− mice, and three months later the mice were injected with PHZ or PBS. CFU-FACS were performed using re-isolated donor-derived HSCs. Data from the total of 3 experiments. The figure was created by authors. d Result of CFU-FACS of HSCs. n = 77–168 colonies from three independent recipient mice. Adjusted p values were obtained using one-way ANOVA (Tukey’s multiple comparison test). e PB analysis of the PHZ-treated WT mice or Apoe-/- mice. RBC, HGB, hematocrit (HCT), mean corpuscular volume (MCV), mean corpuscular hemoglobin (MCH), white blood cell count (WBC) and platelet count (PLT) on day 7 are shown. Five mice for each genotype were used. P values were obtained using two-tailed unpaired t tests. f, g BM and spleen (SPL) analysis of the PHZ-treated WT mice or Apoe-/- mice. Ter119+ erythroid cells (Ery), CD11b+/Gr-I+ myeloid cells (Mye), B220+ B cells (B), and CD4+/CD8+ T cells (T) on day 7 are shown. Five mice for each genotype were used. P values were obtained using two-tailed unpaired t tests. h qRT-PCR for Fabp5 expression in HSC treated with recombinant ApoE for 3 days. Relative expression compared to the DMSO control (Ctrl) is shown. The expression levels were normalized to Hprt. Four individual experiments were done. P value was obtained using two-tailed unpaired t test. i CFU-FACS of HSC treated with recombinant ApoE for 3 days. One-hundred-seven (Ctrl), ninety-five (5 μg), or eighty-one (10 μg) colonies from the total of three experiments were analyzed. Box plots show the median (center line) first and third quartiles (box limits), and whiskers extend to minimum and maximum values. Adjusted p values were obtained using one-way ANOVA (Tukey’s multiple comparison test). *p < 0.05, **p < 0.01, ***p < 0.001, ****p < 0.0001. Exact P values are provided as Source Data.
Fig. 7
Fig. 7. ApoE modifies chromatin accessibility in HSCs.
a Principal component analysis (PCA) of the ATAC-seq data of freshly isolated HSC (Fresh), control culture (Ctrl), and recombinant ApoE-treated HSC (ApoE). b Scatter plots comparing ATAC-seq peaks between control culture (Ctrl) and recombinant ApoE-treated (ApoE) HSC. c Motif analysis of open chromatin regions closed (left) or opened (right) upon ApoE treatment. Ranks of motifs enriched in each condition are shown. P values were not adjusted. d The enrichment of genes related to “closed upon ApoE treatment” in Erg+/- HSC gene expression data (Knudsen et al.). P values were adjusted with Benjamini–Hochberg method. e CFU-FACS of HSCs treated with recombinant ApoE or Erg inhibitor (ERGi) for 3 days. n = 55-89 from the total of 2 experiments. Adjusted p values were obtained using one-way ANOVA (Tukey’s multiple comparison test). *p < 0.05, **p < 0.01, ***p < 0.001, ****p < 0.0001. Exact P values are provided as Source Data.

References

    1. Orkin, S. H. & Zon, L. I. Hematopoiesis: an evolving paradigm for stem cell biology. Cell132, 631–644 (2008). 10.1016/j.cell.2008.01.025 - DOI - PMC - PubMed
    1. Takizawa, H. et al. Pathogen-induced TLR4-TRIF innate immune signaling in hematopoietic stem cells promotes proliferation but reduces competitive fitness. Cell Stem Cell21, 225–240 (2017). 10.1016/j.stem.2017.06.013 - DOI - PubMed
    1. Umemoto, T., Hashimoto, M., Matsumura, T., Nakamura-Ishizu, A. & Suda, T. Ca2+-mitochondria axis drives cell division in hematopoietic stem cells. J. Exp. Med.215, 2097–2113 (2018). 10.1084/jem.20180421 - DOI - PMC - PubMed
    1. Sigurdsson, V. et al. Induction of blood-circulating bile acids supports recovery from myelosuppressive chemotherapy. Blood Adv.4, 1833–1843 (2020). 10.1182/bloodadvances.2019000133 - DOI - PMC - PubMed
    1. Umemoto, T. et al. ATP citrate lyase controls hematopoietic stem cell fate and supports bone marrow regeneration. EMBO J.41, e109463 (2022). 10.15252/embj.2021109463 - DOI - PMC - PubMed

Publication types

Associated data