. 2024 Nov;43(21):4870-4891.
doi: 10.1038/s44318-024-00215-0. Epub 2024 Sep 16.

IF1 is a cold-regulated switch of ATP synthase hydrolytic activity to support thermogenesis in brown fat

Affiliations

IF1 is a cold-regulated switch of ATP synthase hydrolytic activity to support thermogenesis in brown fat

Henver S Brunetta et al. EMBO J. 2024 Nov.

Abstract

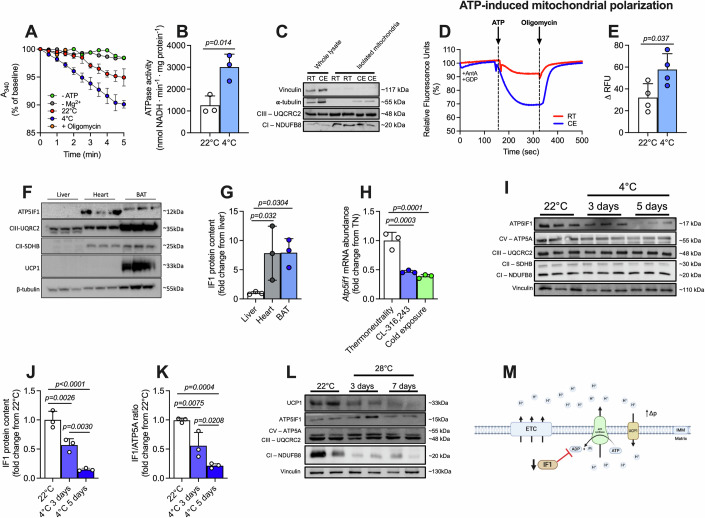
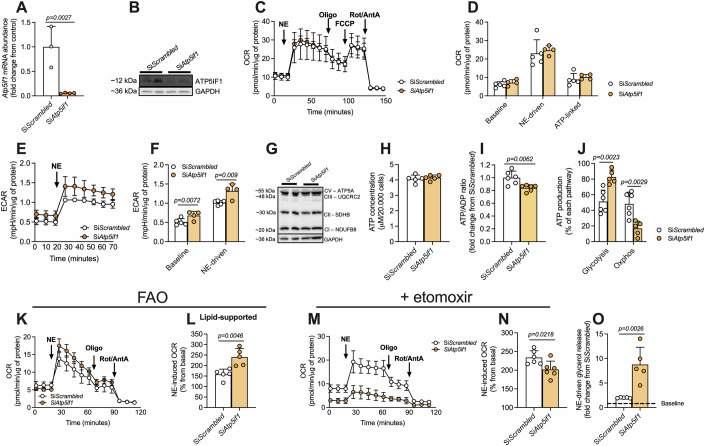
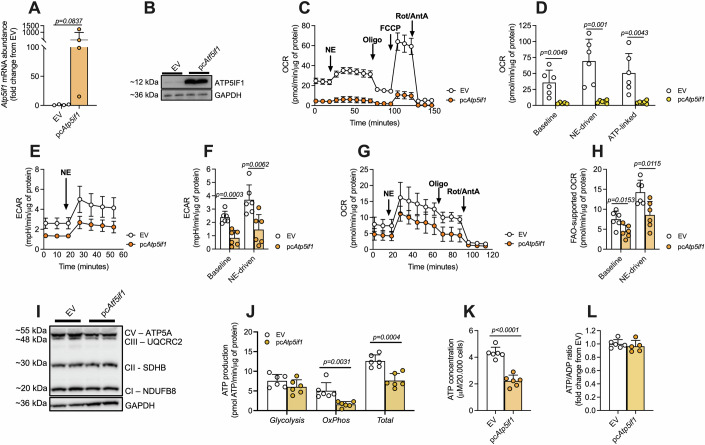
While mechanisms controlling uncoupling protein-1 (UCP1) in thermogenic adipocytes play a pivotal role in non-shivering thermogenesis, it remains unclear whether F1Fo-ATP synthase function is also regulated in brown adipose tissue (BAT). Here, we show that inhibitory factor 1 (IF1, encoded by Atp5if1), an inhibitor of ATP synthase hydrolytic activity, is a critical negative regulator of brown adipocyte energy metabolism. In vivo, IF1 levels are diminished in BAT of cold-adapted mice compared to controls. Additionally, the capacity of ATP synthase to generate mitochondrial membrane potential (MMP) through ATP hydrolysis (the so-called "reverse mode" of ATP synthase) is increased in brown fat. In cultured brown adipocytes, IF1 overexpression results in an inability of mitochondria to sustain the MMP upon adrenergic stimulation, leading to a quiescent-like phenotype in brown adipocytes. In mice, adeno-associated virus-mediated IF1 overexpression in BAT suppresses adrenergic-stimulated thermogenesis and decreases mitochondrial respiration in BAT. Taken together, our work identifies downregulation of IF1 upon cold as a critical event for the facilitation of the reverse mode of ATP synthase as well as to enable energetic adaptation of BAT to effectively support non-shivering thermogenesis.

Keywords: Adipocytes; Metabolism; Mitochondria; Thermogenesis; UCP1.


Conflict of interest statement

The authors declare no competing interests.

Figures

Figure 1
Figure 1. Cold favors the reverse mode of ATP synthase and lowers IF1 levels in BAT.
(A) Representative traces of NADH consumption to determine the hydrolytic capacity of ATP synthase and (B) quantification of ATPase activity in BAT from room temperature (RT, 22 °C) or cold-exposed (4 °C) mice (A, B—three biological replicates). (C) Representative immunoblots showing low content of cytosolic proteins in our mitochondrial isolation protocol (two biological replicates). (D) Representative plots of safranin fluorescence in mitochondria isolated from RT or cold-exposed mice in response to ATP addition and (E) quantification of the ATP-induced change in membrane potential (four biological replicates). (F) Representative images and (G) quantification of IF1 protein levels in liver, heart, and BAT of mice kept at RT (three biological replicates). (H) Atp5if1 mRNA levels in BAT of thermoneutrality-adapted mice, 4 h after cold exposure or CL316,243 injection (three biological replicates). (I) Representative images, (J) quantification of IF1 in BAT following 3 or 5 days of cold exposure and (K) IF1/ATP5A ratio in BAT of animals kept in RT, and 3 or 5 days of cold exposure (three biological replicates). (L) Representative blots of mitochondrial proteins from animals kept at RT and exposed to thermoneutrality (TN) for 3 and 7 days (two biological replicates). (M) Schematic model of the hypothetical relationship between IF1 and UCP1 in brown adipocytes (created with Biorender). A340 340 nm absorbance, ANT adenine nucleotide transporter, ATP adenosine triphosphate, ADP adenosine diphosphate, Mg2+ magnesium, AA Antimycin A, CE cold exposure, ATP5IF1 ATP synthase inhibitory factor subunit 1, BAT brown adipose tissue, CIII complex III, CI complex I, ETC electron transport chain, GDP guanosine diphosphate, IF1 inhibitory factor 1, NADH reduced nicotinamide adenine dinucleotide, RFU relative fluorescence units, RT room temperature, TN thermoneutrality, UCP1 uncoupling protein 1, IMM inner mitochondrial membrane. Statistical test: Two-tailed Student’s t-test (B, E) and one-way ANOVA followed by LSD post hoc test (G, H, J, K). Data are expressed with individual values and mean ± SD superimposed. The exact p-value is displayed when p < 0.05. Source data are available online for this figure.
Figure 2
Figure 2. IF1 modulates mitochondrial membrane potential upon adrenergic stimulation.
(A) Atp5if1 mRNA and (B) protein levels following Atp5if1 knockdown in differentiated WT1 brown adipocytes (three technical replicates). (C) Representative immunoblots and (D) quantification of p-p38-MAPK in non-stimulated and norepinephrine (NE)-stimulated (10 μM for 30 min) WT1 cells in which Atp5if1 was knocked down (siAtp5if1) or in scramble controls (siScrambled) (three technical replicates from three biological experiments). (E) Relative TMRM fluorescence at baseline and upon NE stimulation in IF1-knocked down adipocytes (three/four technical replicates). (F) Atp5if1 mRNA and (G) protein levels following IF1 overexpression in WT1 brown adipocytes (three technical replicates). (H) Representative immunoblots and (I) quantification of p-p38-MAPK in non-stimulated and NE-stimulated (10 μM for 30 min) WT1 cells in which IF1 was overexpressed (pcAtp5if1) or an empty vector control (EV) (three technical replicates from three biological experiments). (J) Relative TMRM fluorescence at the baseline and following NE stimulation (three technical replicates). (K) Ucp1 and Atp5if1 mRNA levels following Ucp1 knockdown, IF overexpression, or both (three/six technical replicates). (L) Relative TMRM fluorescence at baseline and upon NE stimulation in Ucp1 knocked down/IF1 overexpressing WT1 cells (four technical replicates). (M) Relative TMRM fluorescence at baseline and following NE stimulation in cells overexpressing mutant IF1(E55A) (four/six technical replicates). Atp5if1 ATP synthase inhibitory factor subunit 1, GAPDH glyceraldehyde-3-phosphate dehydrogenase, TMRM tetramethylrhodamine methyl ester, FC fold change, FCCP Carbonyl cyanide-p-trifluoromethoxyphenylhydrazone, p38MAPK p38 mitogen-activated protein kinase, NE norepinephrine, UCP1 Uncoupling protein 1, EV empty vector. Statistical test: Two-tailed Student’s t-test (A, D, F, I), one-way ANOVA followed by LSD post hoc test (K, M), and two-way ANOVA followed by LSD post hoc test (E, J, L). Data are expressed with individual values and mean ± SD superimposed. Experiments were replicated in at least 3 independent experiments. The exact p-value is displayed when p < 0.05. Source data are available online for this figure.
Figure 3
Figure 3. IF1 knockdown induces mitochondrial lipid oxidation in brown adipocytes.
(A) Atp5if1 mRNA (three technical replicates) and (B) protein levels (two biological experiments). (C) Representative plot and (D) quantification of oxygen consumption rate following NE stimulation in primary brown adipocytes upon IF1 knockdown (siAtp5if1) or scramble control (siScrambled) (four/five technical replicates). (E) Representative plot and (F) quantification of extracellular acidification rate in these cells (four/five technical replicates). (G) Representative immunoblots of OxPhos subunits in primary brown adipocytes (two biological experiments). (H) Cellular ATP content, (I) ATP/ADP ratio and (J) relative ATP production from glucose (five/six technical replicates). (K) Representative plot of fatty-acid oxidation-supported respiration (100 μM palmitate) and (L) quantification of NE-driven oxygen consumption (five technical replicates). (M) Representative plot and (N) NE-induced respiration in the presence of etomoxir (five technical replicates). (O) NE-driven glycerol release (five technical replicates). Atp5if1 ATP synthase inhibitory factor subunit 1, GAPDH glyceraldehyde-3-phosphate dehydrogenase, OCR oxygen consumption rate, NE norepinephrine, Oligo oligomycin, FCCP carbonyl cyanide-p-trifluoromethoxyphenylhydrazone, Rot rotenone, AA antimycin A, ATP adenosine triphosphate, ECAR extracellular acidification rate, OxPhos oxidative phosphorylation, CI complex I, CII complex II, CIII complex III, CV complex V, FAO fatty-acid oxidation. Two-tailed Student’s t-test (A, D, F, H, I, J, L, N, O). The exact p-value is displayed when p < 0.05. Data are expressed with individual values and mean ± SD superimposed. Findings were replicated in at least 3 independent experiments. Source data are available online for this figure.
Figure 4
Figure 4. IF1 overexpression blunts OxPhos and ATP production in primary brown adipocytes.
(A) Atp5if1 mRNA (four technical replicates) and (B) protein levels in primary brown differentiated adipocytes following Atp5if1 overexpression (two biological experiments). (C) Representative plot and (D) quantification of oxygen consumption rate following NE stimulation in primary brown adipocytes overexpressing IF1 (pcAtp5if1) or an empty vector (EV) (five/six technical replicates). (E) Representative plot and (F) quantification of extracellular acidification rate at baseline and upon NE stimulus (six technical replicates). (G) Representative plot of fatty-acid oxidation-supported respiration (100 μM palmitate) and (H) quantification of baseline and NE-driven oxygen consumption (six technical replicates). (I) Representative immunoblots of OxPhos subunits in primary brown adipocytes (two biological experiments). (J) Glycolytic, OxPhos, and total ATP production from glucose (six technical replicates); (K) total cell ATP content, and (L) ATP/ADP ratio (six technical replicates). Atp5if1 ATP synthase inhibitory factor subunit 1, GAPDH glyceraldehyde-3-phosphate dehydrogenase, EV empty vector, OCR oxygen consumption rate, NE norepinephrine, Oligo oligomycin, FCCP carbonyl cyanide-p-trifluoromethoxyphenylhydrazone, Rot rotenone, AA antimycin A, ATP adenosine triphosphate, ECAR extracellular acidification rate, Oxphos oxidative phosphorylation, CI complex I, CII complex II, CIII complex III, CV complex V, FAO fatty-acid oxidation. Two-tailed Student’s t-test (A, D, F, H, J, K, L). The exact p-value is displayed when p < 0.05. Data are expressed with individual values and mean ± SD superimposed. Findings were replicated in at least 3 independent experiments. Source data are available online for this figure.
Figure 5
Figure 5. In vivo IF1 overexpression in iBAT suppresses adrenergic-induced thermogenic response and mitochondrial respiration.
(A) Model for AAV-induced IF1 overexpression in iBAT of male mice (created with BioRender). (B) IF1 mRNA levels in iBAT (five biological replicates); (C) representative immunoblot and (D) quantification of IF1 in iBAT (five biological replicates). (E) Mitochondrial oxygen consumption in the presence of pyruvate/malate (complex I), succinate (complex II), GDP (UCP1 inhibitor), and ADP (OxPhos stimulator) (five biological replicates). (F) Representative O2 consumption changes induced by GDP and (G) quantification of % of inhibition caused by GDP (five biological replicates). (H) Representative mitochondrial respiration stimulated by ADP and (I) quantification of ADP-supported respiration in the presence of substrates and GDP (three/four biological replicates). (J) Representative and (K) quantification of immunoblot for mitochondrial complexes subunits (five biological replicates). (L) Representative trace and (M) quantification of ATP hydrolytic activity of ATP synthase of iBAT overexpressing IF1 (three biological replicates). (N) Correlation between body weight and energy expenditure (kJ/h) at 22 °C (five biological replicates). (O) Real-time recording of in vivo CL-316,24-induced oxygen consumption and (P) average of 3 h following injection (five biological replicates). (Q) Variation of iBAT temperature over 10 min and (R) area under the curve of CL-316,243-induced iBAT temperature (five biological replicates). iBAT interscapular brown adipose tissue, IF1 Inhibitor Factor 1, CL CL-316,243. P pyruvate, M malate, S succinate, GDP guanosine diphosphate, ADP adenosine diphosphate, OCR oxygen consumption rate, A340 absorbance at 430 nm. Statistical test: Two-tailed Student’s t-test. The exact p-value is displayed when p < 0.05. Data are expressed with individual values and mean ± SD superimposed. Findings were replicated in at least 3 independent experiments. Source data are available online for this figure.
Figure EV1
Figure EV1. Cold exposure induces body weight loss and does not alter IF1 levels in liver and heart.
(A) Change of body weight and (B) food intake during 5 days of cold exposure. IF1 protein levels in (C) liver and (D) heart after 5 days of cold exposure. IF1 - ATP synthase inhibitory factor subunit 1; Two-tailed Student’s t-test (A, B). Data are expressed with individual values and mean ± SD superimposed. The exact p-value is displayed when p < 0.05.
Figure EV2
Figure EV2. Effects of oligomycin and FCCP on mitochondrial membrane potential.
(A) Brown adipocytes were pre-treated (30 min) with FCCP or oligomycin before the addition of norepinephrine. Norepinephrine treatment lasted 30 min before the cells were loaded with 20 nM TMRM. (B) mRNA levels of Ucp1 and (C) of Atp5if1 after 1 h, 4 h, and 24 h of norepinephrine (10 μM) treatment. (D) ATP5IF1 protein levels following norepinephrine stimulation (10 μM for 1 h). (E) Comparison between ATP5A and ATP5IF1 levels in differentiated primary brown adipocytes and brown adipose tissue. (F) Representative blot of IF1 mutant overexpression in differentiated WT1 brown adipocytes. FCCP - Carbonyl cyanide-p-trifluoromethoxyphenylhydrazone. Statistical test: one-way ANOVA followed by LSD post hoc test. Data are expressed with individual values and mean ± SD superimposed. The exact p-value is displayed when p < 0.05.
Figure EV3
Figure EV3. Mitochondrial respiration in the presence of fatty acid-free BSA and lipid accumulation in IF1 knockdown adipocytes.
(A) Representative trace and (B) quantification of mitochondrial oxygen consumption rate in primary brown adipocytes knockdown for IF1 (siAtp5if1) or controls (siScrambled). (C) Lipid content upon Atp5if1 silencing in primary brown adipocytes visualized by Oil Red O staining. Atp5if1 ATP synthase inhibitory factor subunit 1, OCR oxygen consumption rate, NE norepinephrine, Oligo oligomycin, FCCP carbonyl cyanide-p-trifluoromethoxyphenylhydrazone, Rot rotenone, AA antimycin A. Data are expressed with individual values and mean ± SD superimposed. Two-tailed Student’s t-test.
Figure EV4
Figure EV4. IF1 overexpression suppresses mitochondrial respiration independent of free-fat acids and does not affect basic cell parameters in brown adipocytes.
(A) Representative trace and (B) quantification of mitochondrial oxygen consumption rate in primary brown adipocytes overexpressing IF1 (pcAtp5if1) or controls (EV). (C) mRNA and (D) protein yield from 500,000 cells overexpressing IF1. (E) Norepinephrine-induced lipolysis (10 µM for 90 min) in IF1-overexpressing adipocytes. Atp5if1 ATP synthase inhibitory factor subunit 1, OCR oxygen consumption rate, NE norepinephrine, Oligo oligomycin, FCCP carbonyl cyanide-p-trifluoromethoxyphenylhydrazone, Rot rotenone, AA antimycin A. Two-tailed Students t test (B, C, D). Two-way ANOVA followed by LSD post hoc test (E). The exact p-value is displayed when p < 0.05. Data are expressed with individual values and mean ± SD superimposed.
Figure EV5
Figure EV5. IF1 global knockout does not affect resting and adrenergic-stimulated whole-body oxygen consumption.
(A) Body weight, (B) food intake, (C) real-time trace, and (D) average of baseline and CL316,243-induced energy expenditure in adult WT and IF1 KO male mice after 2 weeks of living at thermoneutrality. (E) Body weight, (F) food intake, (G) real-time trace, and (H) average of baseline and CL316,243-induced energy expenditure in adult WT and IF1 KO male mice after 2 weeks living at 23 °C. WT wild type, IF1 KO Mice with global IF1 knockout, RT room temperature, TN thermoneutrality. Two-tailed Student’s t-test. Data are expressed with individual values and mean ± SD superimposed.
Figure EV6
Figure EV6. Effects of BAT IF1 overexpression in male mice.
(A) Body weight and (B) daily food intake after 14 days of AAV transduction. (C) Oxygen consumption and (D) voluntary ambulatory activity in the dark and light cycles. (E) iBAT temperature at RT (day 0) and following cold exposure (4 °C). (F) Change of body weight and (G) food intake after 5 days of cold exposure (4 °C). (H) Inguinal WAT mass and (I) mRNA Ucp1 levels after 5 days of cold exposure. WAT white adipose tissue. Statistical test: Two-tailed Student’s t-test. The exact p-value is displayed when p < 0.05. Data are expressed with individual values and mean ± SD superimposed.

References

    1. Acin-Perez R, Beninca C, Fernandez L, Shu C, Baghdasarian S, Zanette V, Gerle C, Jiko C, Khairallah R, Khan S et al (2023) Inhibition of ATP synthase reverse activity restores energy homeostasis in mitochondrial pathologies. EMBO J 42:1–21 - PMC - PubMed
    1. Bartelt A, Bruns OT, Reimer R, Hohenberg H, Ittrich H, Peldschus K, Kaul MG, Tromsdorf UI, Weller H, Waurisch C et al (2011) Brown adipose tissue activity controls triglyceride clearance. Nat Med 17(2):200–206 - PubMed
    1. Benador IY, Veliova M, Mahdaviani K, Petcherski A, Wikstrom JD, Assali EA, Acín-Pérez R, Shum M, Oliveira MF, Cinti S et al (2018) Mitochondria bound to lipid droplets have unique bioenergetics, composition, and dynamics that support lipid droplet expansion. Cell Metab 27(4):869–885.e6 - PMC - PubMed
    1. Brunetta HS, Petrick HL, Momken I, Handy RM, Pignanelli C, Nunes EA, Piquereau J, Mericskay M, Holloway GP (2022) Nitrate consumption preserves HFD-induced skeletal muscle mitochondrial ADP sensitivity and lysine acetylation: a potential role for SIRT1. Redox Biol 52(3):102307 - PMC - PubMed
    1. Brunetta HS, Politis-Barber V, Petrick HL, Dennis KMJH, Kirsh AJ, Barbeau PA, Nunes EA, Holloway GP (2020) Nitrate attenuates high fat diet-induced glucose intolerance in association with reduced epididymal adipose tissue inflammation and mitochondrial reactive oxygen species emission. J Physiol 598(16):3357–3371 - PubMed

Substances

LinkOut - more resources