. 2024 Nov;43(21):5186-5210.
doi: 10.1038/s44318-024-00225-y. Epub 2024 Sep 16.

RNA fine-tunes estrogen receptor-alpha binding on low-affinity DNA motifs for transcriptional regulation

Affiliations

RNA fine-tunes estrogen receptor-alpha binding on low-affinity DNA motifs for transcriptional regulation

Deepanshu Soota et al. EMBO J. 2024 Nov.

Abstract

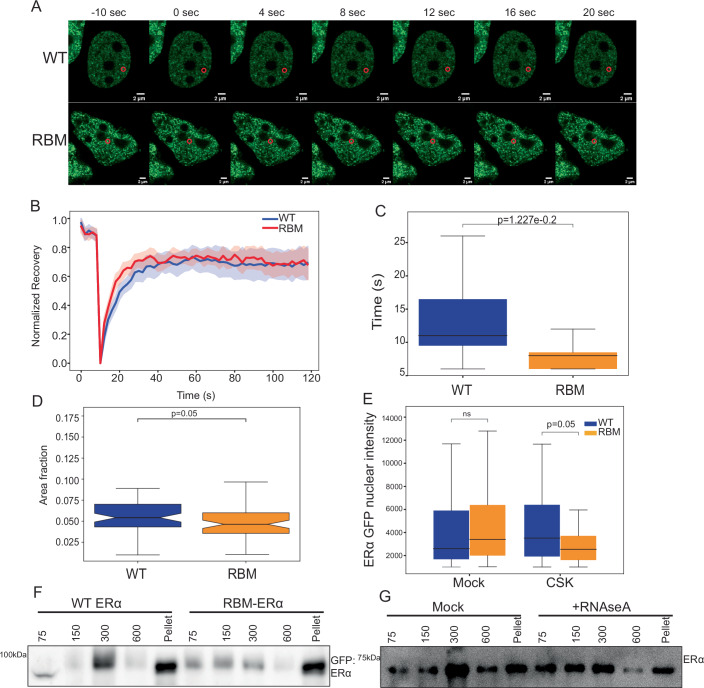
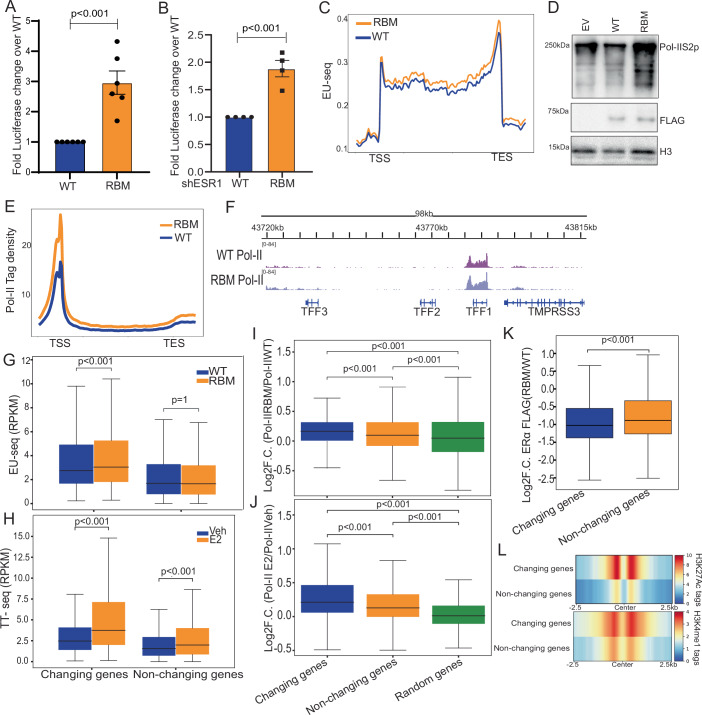
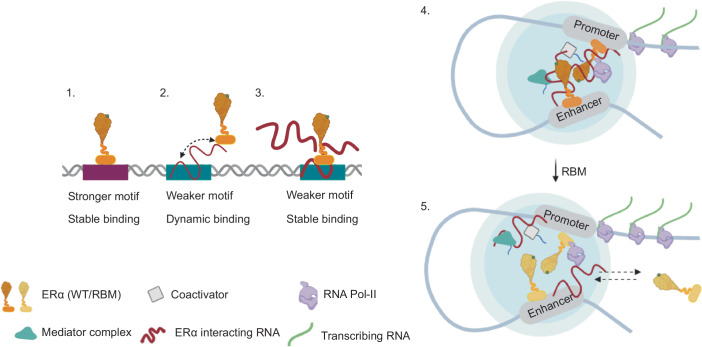
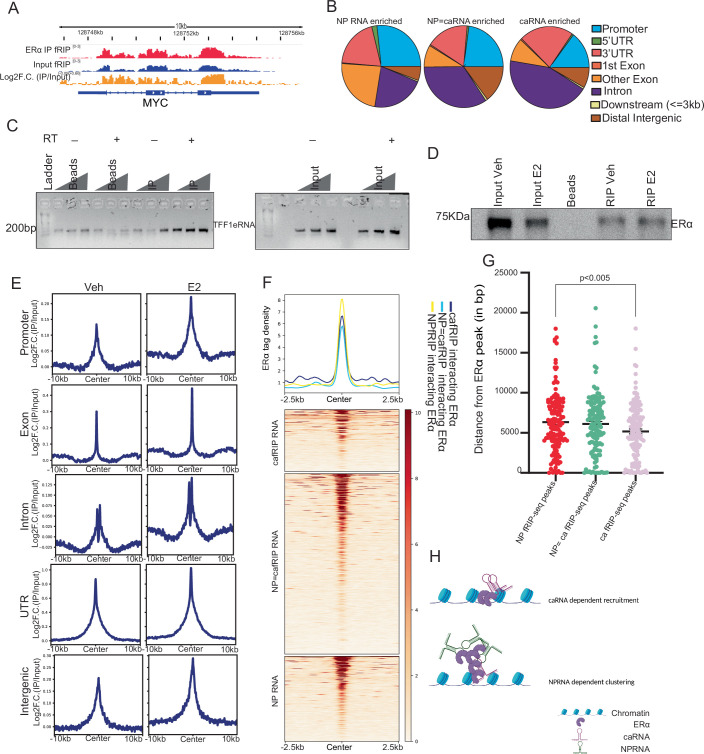
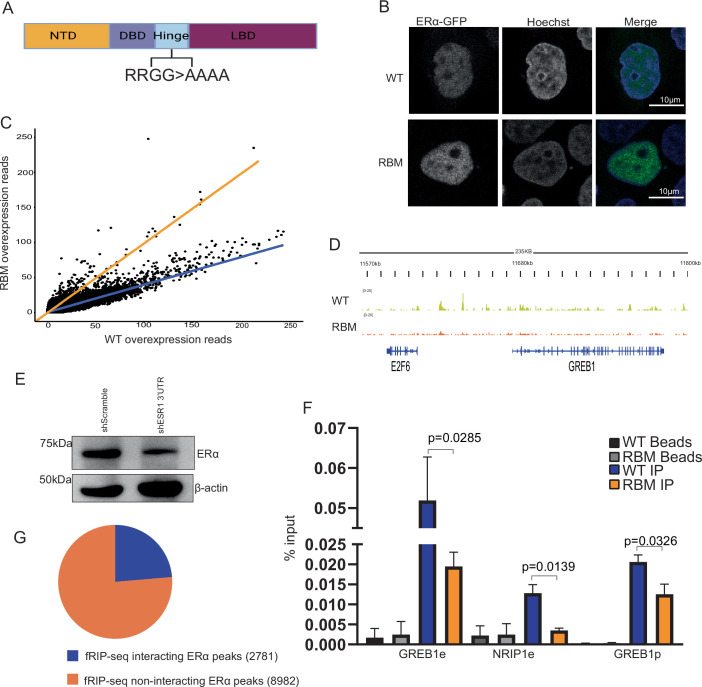
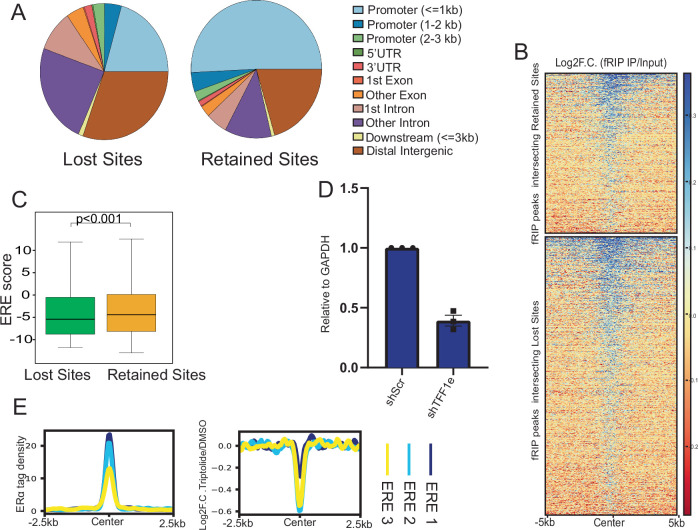
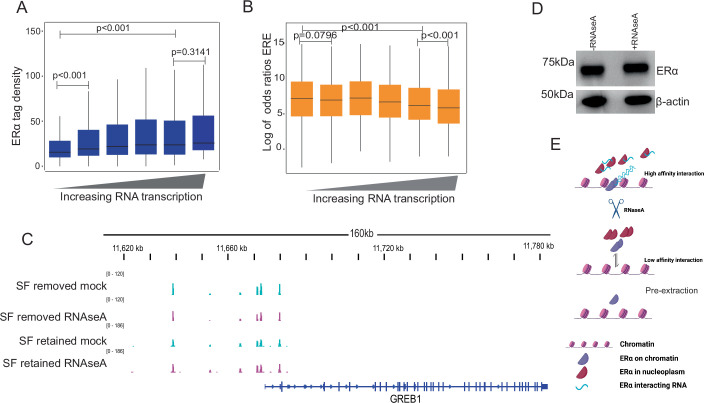
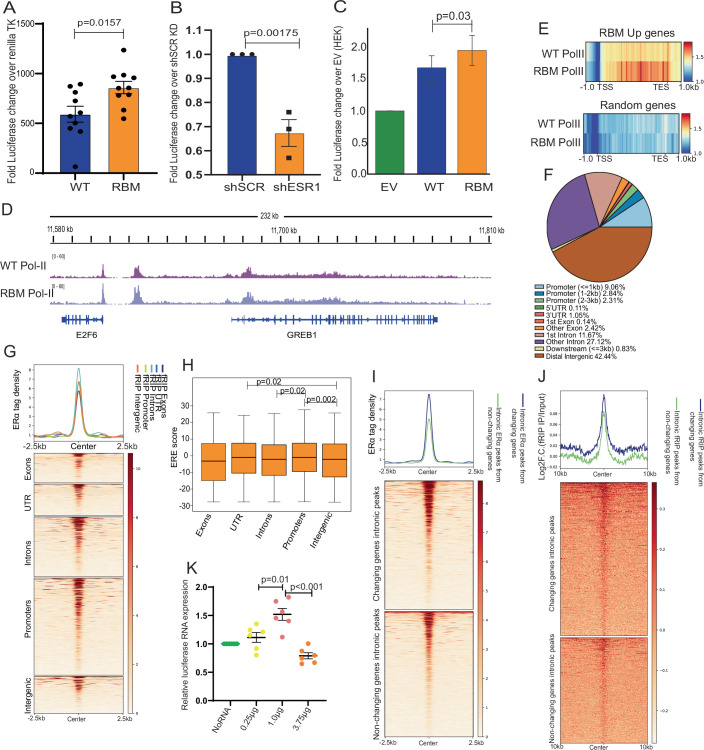
Transcription factors (TFs) regulate gene expression by binding with varying strengths to DNA via their DNA-binding domain. Additionally, some TFs also interact with RNA, which modulates transcription factor binding to chromatin. However, whether RNA-mediated TF binding results in differential transcriptional outcomes remains unknown. In this study, we demonstrate that estrogen receptor α (ERα), a ligand-activated TF, interacts with RNA in a ligand-dependent manner. Defects in RNA binding lead to genome-wide loss of ERα recruitment, particularly at weaker ERα-motifs. Furthermore, ERα mobility in the nucleus increases in the absence of its RNA-binding capacity. Unexpectedly, this increased mobility coincides with robust polymerase loading and transcription of ERα-regulated genes that harbor low-strength motifs. However, highly stable binding of ERα on chromatin negatively impacts ligand-dependent transcription. Collectively, our results suggest that RNA interactions spatially confine ERα on low-affinity sites to fine-tune gene transcription.

Keywords: Chromatin; DNA-motifs; Estrogen Receptor-Alpha; Non-Coding RNA; Transcription Factors.


Conflict of interest statement

The authors declare no competing interests.

Figures

Figure 1
Figure 1. ERα interacts with RNA.
(A) Pie chart showing the genomic distribution of ERα interacting RNA by formaldehyde-assisted RNA immunoprecipitation sequencing (fRIP-seq). (B) Heatmap showing the enrichment of fRIP-seq immunoprecipitation over the input across categories of ERα interacting RNA. (C) Genome browser screenshot showing fRIP-seq IP, Input, Log2F.C.(IP/Input), and ERα ChIP-seq for TFF1 locus. (D) Genome browser screenshot with fRIP-seq IP, Input, Log2F.C.(IP/Input), and ERα ChIP-seq for TFF1 enhancer. (E) Proportions of ERα interacting RNA inside the nucleus (NP nucleoplasmic enriched RNA and ca: Chromatin-associated RNA). (F) Immunoblot for ERα on RNA pulldowns using biotin-labeled TFF1 eRNA fragments. (G) Immunoblot for ERα and GAPDH on RNA pulldowns using biotin-labeled TFF1 eRNA with lysates from cells grown in DMEM or stripping media treated with either Vehicle or E2. (H) Immunoblot for ERα on RNA pulldowns using TFF1 eRNA with increasing concentration of the TFF1 enhancer DNA as a competitor. (I) TFF1 eRNA RTPCR from biotin-labeled 3X ERE as bait with lysates from HEK-293T expressing either empty vector or ERα. (J) Heatmap depicting the strength of ERα binding in intergenic regions within (fRIP interacting sites) and beyond (fRIP non-interacting sites) 10 Kb of fRIP-seq peak. Source data are available online for this figure.
Figure 2
Figure 2. RNA binding mutant of ERα shows loss of binding genome-wide.
(A) Immunoblot for FLAG, ERα and GAPDH on RNA pulldowns using TFF1 eRNA for ERα WT and RBM overexpressed lysates from HEK-293T (* denotes non-specific band). (B) Immunoblot for FLAG and H3 on chromatin-bound fraction from ERα WT or RBM overexpressed MCF-7 cells. (C) Heatmap depicting the binding strength of ERα:FLAG WT and RBM overexpressed in MCF-7 cells. (D) Genome browser screenshot for the binding of ERα WT and RBM on TFF1 locus in MCF-7. (E, F) Normalized read count of ERα WT and RBM pfChIP-seq for all CTCF peaks and ERα peaks beyond 5 kb of CTCF peaks, respectively. Here r denotes Pearson correlation and p value is calculated using t-test. (G) Heatmap depicting the log2F.C. of binding of RBM-ERα over WT-ERα and GRO-seq signal plotted at the sorted sites in the same order. (H) Boxplot depicting the Log2F.C. (RBM/WT) at 2781 ERα sites categorized as either RNA-interacting or non-interacting. Statistical significance determined by Mann–Whitney U-test. (I) Genomic distribution in percentages for the ERα:FLAG WT and RBM. (J) Boxplot depicting the Log2F.C. (RBM/WT) at ERα sites categorized as promoters (within 500 bp of 14,206 ERα peaks), intronic (50,302 peaks), and intergenic (26,992 peaks). Statistical significance was determined using the Mann–Whitney U-test. The center lines of the boxplot denote the median, the box limits indicate the 25th and 75th percentiles, and the whiskers extend 1.5 times the interquartile range from the 25th and 75th percentiles. Outliers are not presented. Replicates for the WT and RBM ChIP-seq biological replicates in C, D and HJ is provided in Appendix Table S6. Source data are available online for this figure.
Figure 3
Figure 3. Weaker motifs exhibit the highest loss of ERα upon RNA binding deficiency.
(A) Heatmap depicting the ERα tag density, Log2F.C (pbox/WT) and (RBM/WT) at ERE bins of varying strength (strongest to weakest). (B) Boxplot depicting the Log2F.C. (pbox/WT) and (RBM/WT) at decreasing order of ERE strength bins each consisting of 1060 sites. Statistical significance determined by Mann–Whitney U-test. (C) Profile plot illustrating the KLF4 and SOX2 tag density at their respective motif bins of varying strength (strongest to weakest). (D) Boxplot depicting the Log2F.C. (RBM/WT) for KLF4 and SOX2 at decreasing order of motif strength, with each bin consisting of ~9000 sites for KLF4 and ~6500 sites for SOX2. Statistical significance determined by Mann–Whitney U-test. (E) ERα enrichment on enhancers of TFF1 and FOXC1 upon transfecting short hairpin RNA targeting either scramble or TFF1 enhancer RNA (sense and antisense). Statistical significance was determined by unpaired t-test, and error bars denote the standard error of the mean (SEM) from three biological replicates. The center lines of the boxplot denote the median, the box limits indicate the 25th and 75th percentiles, and the whiskers extend 1.5 times the interquartile range from the 25th and 75th percentiles. Outliers are not presented. Replicates for (A, B), WT and RBM-ERα ChIP-seq and for (C, D) publicly available datasets for KLF4 and SOX2 WT and RBM CUT&Tag are mentioned in Appendix Table S6. Source data are available online for this figure.
Figure 4
Figure 4. Retention of ERα on weaker binding sites depends on RNA.
(A) Boxplot showing ERα enrichment on all non-genic sites binned based on the levels of RNA transcription in increasing order. (B) Boxplot showing the Log of odds ratio for the ERE motif on all non-genic sites binned on the basis of RNA transcription in increasing order. (C) Immunoblot of ERα and total H3 on chromatin-bound fractions from nucleus with or without RNase A treatment. (D) ERE binding to ERα in cellular lysate in the presence or absence of total RNA. (E) Schematic of ChIP-seq following the removal of total RNA before crosslinking, with and without pre-extraction. (F, G) Scatter plots showing a correlation between ERα ChIP-seq normalized read counts with and without RNase A following pre-extraction and in the absence of pre-extraction respectively. Here r denotes Pearson correlation and p value is calculated using t-test. (H, I) Heatmap depicting ERα tag density between mock and RNase A treatment followed by pre-extraction and without pre-extraction, respectively. (J, K) Genome browser screenshot of TFF1 locus showing ERα ChIP-seq upon RNase A treatment with pre-extraction of soluble proteins and with retention of soluble proteins, respectively. (L) Log2FC of +RNase A/mock with pre-extraction ERα ChIP-seq at all sites binned based on the RNA transcription. Statistical significance determined by Mann–Whitney U-test. (M) Log2FC of +RNase A/mock SF retained at all sites binned based on increasing ERE strength. Statistical significance determined by Mann–Whitney U-test. The center lines of the boxplot denote the median, the box limits indicate the 25th and 75th percentiles, and the whiskers extend 1.5 times the interquartile range from the 25th and 75th percentiles. Outliers are not presented. In (A, B, L), the first to sixth bins contain 9104, 438, 572, 432, 173, and 102 regions, respectively. In (M), the first to sixth bins contain 2698, 4554, 1880, 750, 394, and 545 peaks, respectively. Replicates for (A, B), publicly available ERα ChIP-seq and GRO-seq. For (FM) Mock and RNAse A-treated ERα ChIP-seq are mentioned in Appendix Table S6. Source data are available online for this figure.
Figure 5
Figure 5. RNA binding mutant of ERα interacts dynamically with the chromatin.
(A) Representative image of WT-ERα:GFP and RBM-ERα:GFP showing the FRAP ROI pre and post-bleaching. Red circles denote the ROI that was bleached and followed post-recovery. (B) Recovery plot of FRAP ROIs for WT-ERα:GFP and RBM-ERα:GFP. (C) Boxplot depicting the half-life recovery for WT-ERα:GFP and RBM-ERα:GFP. Statistical significance determined by unpaired t-test and error bar denotes SEM calculated from three biological replicates of live cell microscopy, with 15 ROIs (Region of Interest) each for WT and RBM-ERα GFP. (D) Boxplot depicting the normalized area fraction of WT and RBM-ERα. Statistical significance determined by Mann–Whitney U-test and error bar denotes SEM calculated from three biological replicates of microscopy with 60 nuclei per condition for WT and RBM-ERα:GFP. (E) Boxplot depicting the retention assay for WT-ERα:GFP and RBM-ERα:GFP. Statistical significance determined by Mann–Whitney U-test and error bar denotes SEM calculated from three biological replicates of microscopy with 64, 57, 110, and 79 nuclei for WT mock, RBM mock, WT CSK, and RBM CSK treated, respectively. (F) Immunoblotting for ERα on chromatin-associated proteins eluted at different salt concentrations from cell expressing either WT or RBM ERα:GFP. (G) Immunoblotting for ERα on chromatin-associated proteins isolated from mock and RNAse A-treated nuclei at different salt concentrations. The center lines of the boxplot denote the median, the box limits indicate the 25th and 75th percentiles, and the whiskers extend 1.5 times the interquartile range from the 25th and 75th percentiles. Outliers are not presented. Source data are available online for this figure.
Figure 6
Figure 6. The dynamic binding of ERα allows better transcription of target genes.
(A) Luciferase activity normalized to the WT for 3X ERE reporter assay with ERα WT and RBM overexpression in MCF-7 upon 4 h of E2 treatment. Statistical significance determined by Mann–Whitney U-test and error bar denotes SEM calculated from six biological replicates. (B) Luciferase activity normalized to WT for 3X ERE reporter assay with ERα WT and RBM overexpression in MCF-7 cells upon 24 h E2 treatment, in the background of endogenous ERα knockdown using shRNA. Statistical significance was determined using the Mann–Whitney U-test, and error bar denotes SEM from four biological replicates. (C) Summary plot showing the EU-seq reads from the whole gene body for upregulated genes upon RBM-ERα expression over WT-ERα. (D) Immunoblot of PolIIS2p, FLAG, and H3 from chromatin-bound fractions of either empty vector or WT-ERα or RBM-ERα expressing nuclei. (E) Summary plot showing the total PolII ChIP-seq reads from the whole gene body for upregulated genes upon RBM-ERα expression over WT-ERα. (F) Genome browser screenshot of TFF1 locus for the total Pol-II ChIP-seq upon ERα WT or RBM overexpression. (G) Boxplot showing the EU-seq reads for the whole gene body in two categories- changing genes and non-changing genes in WT-ERα or RBM-ERα. Statistical significance was determined by Wilcoxon signed rank-sum test. (H) Boxplot showing the TT-seq reads for the whole gene body upon vehicle or E2 treatment in two categories- changing genes and non-changing genes. Statistical significance was determined by Wilcoxon signed rank-sum test. (I) Boxplot depicting the Log2F.C. PolII ChIP-seq (RBM-ERα/WT-ERα) for three categories namely, changing genes, non-changing genes, and random gene list. Statistical significance determined by Mann–Whitney U-test. (J) Boxplot depicting the Log2F.C. PolII ChIP-seq (E2/Veh) for three categories namely, changing genes, non-changing genes, and random gene list. Statistical significance determined by Mann–Whitney U-test. (K) Boxplot depicting the Log2F.C. of ERα (RBM/WT) on intronic ERα sites from changing (859 peaks) and non-changing (387 peaks) gene categories. Statistical significance determined by Mann–Whitney U-test. (L) Profile plot depicting the tag density of H3K27ac and H3K4me1 at intronic ERα sites from changing and non-changing gene categories. The center lines of the boxplot denote the median, the box limits indicate the 25th and 75th percentiles, and the whiskers extend 1.5 times the interquartile range from the 25th and 75th percentiles. Outliers are not presented. For (GJ), the number of regions for changing, non-changing, and random gene categories are 556, 1266, and 1000, respectively Replicates for WT and RBM expression EU-seq (C, G), Pol-II ChIP-seq (E, F, I), and vehicle and E2-treated TT-seq (H), and PolII ChIP-seq (J) are mentioned in Appendix Table S6. Source data are available online for this figure.
Figure 7
Figure 7. Schematic.
(1) ERα exhibits stable binding to stronger motifs due to high interaction strength between its DBD and DNA. (2) On weaker motifs with low RNA transcription, ERα binds dynamically due to the low-affinity interaction between its DBD and DNA. (3) ERα binding to weaker motifs, coupled with increased RNA accumulation from enhanced signaling-induced transcription, stabilizes the interaction between ERα and DNA through additional interaction of the hinge region of ERα with RNA as positive feedback. (4) The excess stabilization of ERα-DNA interaction by RNA can lead to the formation of ERα condensates, which are less dynamic, inhibiting continuous ligand-induced transcription. (5) Mutation in the RBD of ERα results in dynamic interaction between ERα and DNA, preventing the excess stabilization of ERα in condensates, leading to continuous activation of ligand-induced transcription.
Figure EV1
Figure EV1. ERα interacts with RNA.
(A) Genome browser screenshot showing fRIP-seq IP, Input, and Log2F.C. (IP/Input) for MYC locus. (B) Genomic distribution of fRIP-seq peaks differentially enriched either in nucleoplasmic (NP) or chromatin (ca) fraction or distributed equally between chromatin and nucleoplasmic fractions. (C) fRIP-PCR using TFF1 eRNA oligos. (D) Immunoblot for ERα and GAPDH on RNA pulldowns using biotin-labeled TFF1 eRNA with lysates from cells grown in stripping media treated with either Vehicle or E2. (E) Summary plot showing the log2F.C. (fRIP IP/Input) across categories of ERα interacting RNA in Veh and E2 treatment. (F) Heatmap depicting ERα intensity on intergenic regions intersecting within 10 kb of caRNA or NPRNA or ca=NPRNA enriched fRIP-seq peaks. (G) Plot depicting the distance between the nearest ERα peak and fRIP-seq peak enriched either in caRNA (200 regions), NPRNA (275 regions) or ca=NP (583 regions) RNA. Statistical significance determined by Mann–Whitney U-test. Replicates for fRIP-seq and publicly available ERα ChIP-seq are mentioned in Appendix Table S6. (H) Illustration explaining the RNA-mediated recruitment of ERα.
Figure EV2
Figure EV2. RNA binding mutant of ERα shows loss of binding genome-wide.
(A) Schematic depicting the domains of ERα protein, the RNA binding RRGG sequence, and its mutation to AAAA. (B) Confocal images of ERα:GFP WT and RBM overexpressed in MCF-7 with E2 treatment for 1 h. (C) Normalized read counts showing the distribution of ERα:FLAG WT and RBM ChIP-seq reads. (D) Genome browser snapshot showing ChIP-seq signal of ERα WT and RBM on GREB1 locus in MCF-7. (E) Immunoblot for ERα and β-actin expression in total lysates from MCF-7 cells transfected with short hairpin RNA targeting against either a scramble sequence or the 3’UTR of the ESR1 gene. (F) FLAG enrichment on enhancers of GREB1 and NRIP1, as well as on the promoter of GREB1, in the background of downregulation of endogenous ERα and upon overexpression of WT and RBM FLAG-tagged ERα. Statistical significance was determined by unpaired t-test, and error bars denote the standard error of the mean (SEM) with two biological and three technical replicates. (G) Pie chart illustrating the number of ERα peaks categorized based on their interaction with RNA.
Figure EV3
Figure EV3. Weaker motifs exhibit higher dependence on RNA for ERα binding.
(A) Genomic distribution of lost and retained peaks upon overexpression of RBM-ERα over WT-ERα. (B) Log2F.C. IP/Input for the fRIP-seq peaks intersecting with the lost and retained ERα upon RBM-ERα overexpression over WT-ERα. (C) Boxplot depicting the ERE motif score of ERα peaks that are lost (36,587 peaks) and retained (14,668 peaks) upon RBM expression as compared to the WT. Statistical significance determined by Mann–Whitney U-test. (D) qRT-PCR depicts the levels of TFF1 enhancer RNA following shRNA-mediated knockdown compared to scramble. The error bar denotes SEM from three biological replicates. (E) Heatmap depicting ERα tag density and Log2F.C (Triptolide ERα/DMSO ERα) tag density at varying ERE strength. The center lines of the boxplot denote the median, the box limits indicate the 25th and 75th percentiles, and the whiskers extend 1.5 times the interquartile range from the 25th and 75th percentiles. Outliers are not presented.
Figure EV4
Figure EV4. ERα retention on chromatin is RNA dependent.
(A) Boxplot showing ERα enrichment on all sites binned based on the levels of RNA transcription in increasing order. Statistical significance determined by Mann–Whitney U-test. (B) Boxplot showing the Log of odds ratio for the ERE motif on all sites binned based on the levels of RNA transcription in increasing order. Statistical significance determined by Mann–Whitney U-test. (C) Genome Browser screenshot of GREB1 locus showing ERα ChIP-seq upon RNAse A treatment with removal and retention of soluble proteins. (D) Immunoblot depicting ERα and β-actin levels in MCF-7 isolated nuclei treated with mock or RNAse A. (E) Illustration depicting the RNA is required for ERα on chromatin. The center lines of the boxplot denote the median, the box limits indicate the 25th and 75th percentiles, and the whiskers extend 1.5 times the interquartile range from the 25th and 75th percentiles. Outliers are not presented. In (A, B), the first to sixth bins contains 15,863, 1404, 1988, 1543, 630, and 301 regions, respectively. Replicates for (A, B), publicly available ERα ChIP-seq, and GRO-seq are mentioned in Appendix Table S6.
Figure EV5
Figure EV5. The dynamic binding of ERα allows better transcription of target genes.
(A) 3X ERE-driven firefly luciferase activity normalized to renilla TK luciferase upon 24 h of E2 treatment. Statistical significance determined by Mann–Whitney U-test and error bar denotes SEM from five biological replicates with two technical replicates each, plotted all. (B) Luciferase activity normalized to the scramble knockdown for the 3X ERE reporter assay conducted with short hairpin RNA targeting either the scramble sequence or the 3′UTR of the ESR1 gene in MCF-7 cells after 24 h of E2 treatment. Statistical significance was determined using the Mann–Whitney U-test, and the error bar denotes SEM from three biological replicates. (C) 3X ERE-driven firefly luciferase activity upon WT-ERα or RBM-ERα overexpression and 24 h of E2 treatment in HEK-293T. Statistical significance determined by Mann–Whitney U-test and error bar denotes SEM from three biological replicates. (D) Genome browser screenshot showing the occupancy of total PolII on GREB1 locus upon expression of WT-ERα or RBM-ERα. (E) Profile plot illustrating PolII tag density normalized with respect to Drosophila DNA spike in, plotted on genes upregulated by RBM and a random set of genes across the entire gene body. (F) Pie chart depicting the genomic distribution of ERα ChIP-seq peak. (G) Heatmap depicting the ERα intensity across ERα bound regions within 10 kb of various categories of fRIP-seq peaks. (H) Boxplot depicting the ERE motif score from different categories of exonic (445), UTR (486), intronic (943), promoter (1574), and intergenic (574), ERα peaks interacting with RNA. Statistical significance was determined using the Mann–Whitney U-test. (I) Heatmap depicting the ERα tag density on intronic sites from changing and non-changing gene categories. (J) Heatmap depicting the fRIP-seq signal from intronic peaks of genes that are changing and non-changing. (K) Relative luciferase RNA expression from an in vitro transcription reaction with varying concentrations of added RNA. Statistical significance is determined by unpaired t-test and error bar denotes SEM from three biological replicates. The center lines of the boxplot denote the median, the box limits indicate the 25th and 75th percentiles, and the whiskers extend 1.5 times the interquartile range from the 25th and 75th percentiles. Outliers are not presented.

Similar articles

Cited by

References

    1. Anon. n.d. Picard tools - by Broad Institute. http://broadinstitute.github.io/picard/
    1. Ahmed J, Meszaros A, Lazar T, Tompa P (2021) DNA-binding domain as the minimal region driving RNA-dependent liquid–liquid phase separation of androgen receptor. Protein Sci 30:1380–1392 - PMC - PubMed
    1. Aiello A, Bacci L, Re A, Ripoli C, Pierconti F, Pinto F, Masetti R, Grassi C, Gaetano C, Bassi PF, Pontecorvi A, Nanni S, Farsetti A (2016) MALAT1 and HOTAIR long non-coding RNAs play opposite role in estrogen-mediated transcriptional regulation in prostate cancer cells. Sci Rep. 6:38414 - PMC - PubMed
    1. Beltran M, Yates CM, Skalska L, Dawson M, Reis FP, Viiri K, Fisher CL, Sibley CR, Foster BM, Bartke T, Ule J, Jenner RG (2016) The interaction of PRC2 with RNA or chromatin is mutually antagonistic. Genome Res 26:896–907 - PMC - PubMed
    1. Boldes T, Merenbakh-Lamin K, Journo S, Shachar E, Lipson D, Yeheskel A, Pasmanik-Chor M, Rubinek T, Wolf I (2020) R269C variant of ESR1: high prevalence and differential function in a subset of pancreatic cancers. BMC Cancer 20:531 - PMC - PubMed

LinkOut - more resources