. 2025 May;54(5):925-936.
doi: 10.1007/s00256-024-04793-2. Epub 2024 Sep 16.

The observation that older men suffer from hip fracture at DXA T-scores higher than older women and a proposal of a new low BMD category, osteofrailia, for predicting fracture risk in older men

Affiliations

The observation that older men suffer from hip fracture at DXA T-scores higher than older women and a proposal of a new low BMD category, osteofrailia, for predicting fracture risk in older men

Yì Xiáng J Wáng et al. Skeletal Radiol. 2025 May.

Abstract

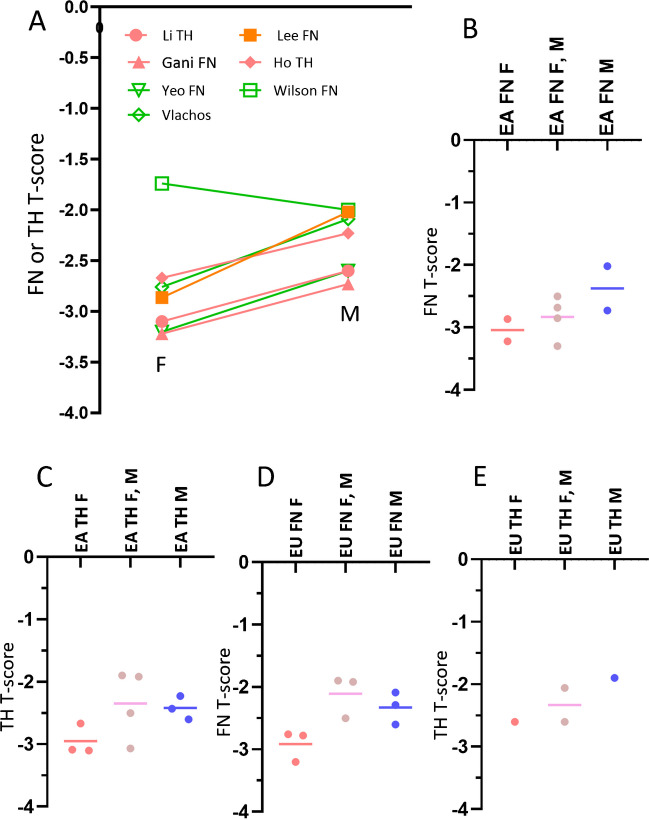
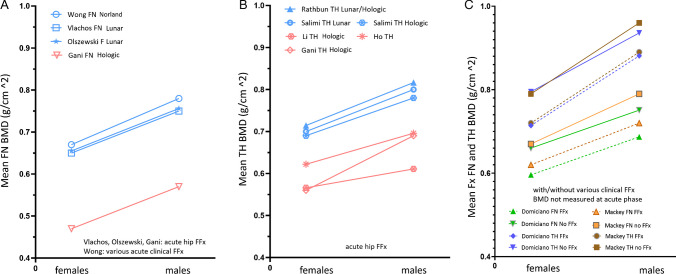
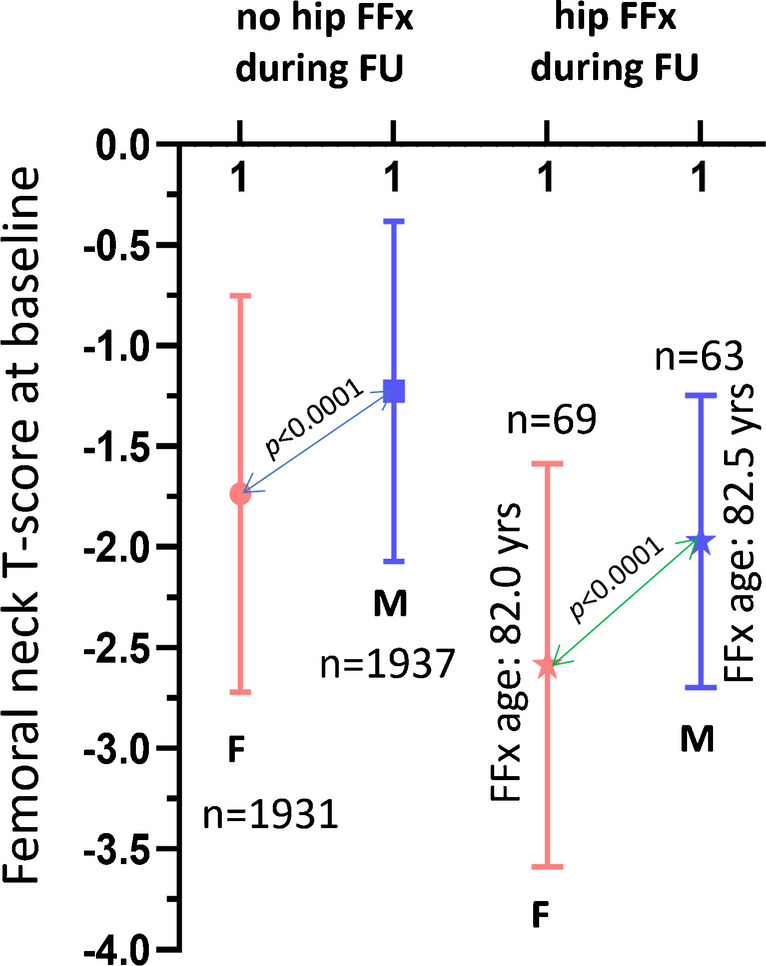
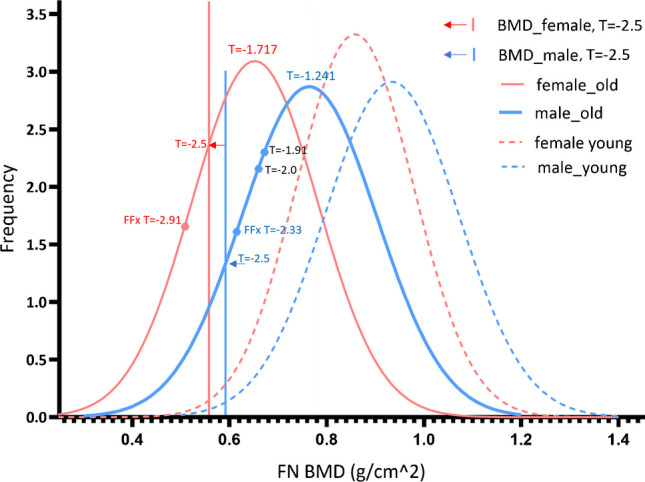
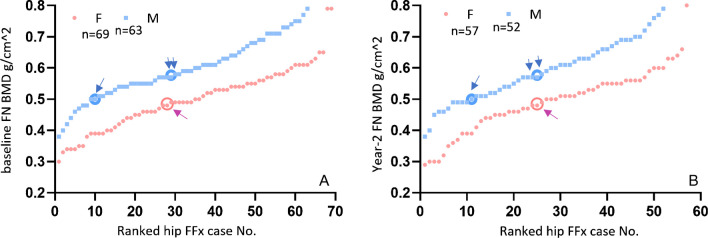
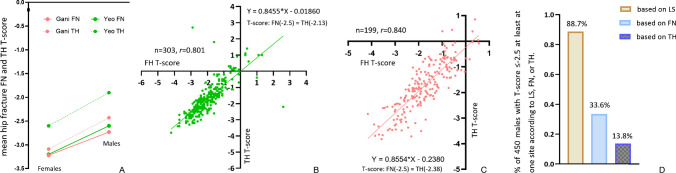
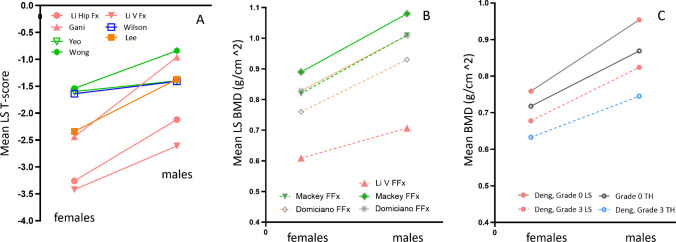
The clinical significance of osteoporosis lies in the occurrence of fragility fractures (FFx), and the most relevant fracture site is the hip. The T-score is defined as follows: (BMDpatient-BMDyoung adult mean)/SDyoung adult population, where BMD is bone mineral density and SD is the standard deviation. When the femoral neck (FN) is measured in adult Caucasian women, a cutpoint value of patient BMD of 2.5 SD below the young adult mean BMD results in a prevalence the same as the lifetime risk of hip FFx for Caucasian women. The FN T-score criterion for classifying osteoporosis in older Caucasian men has been provisionally recommended to be - 2.5, but debates remain. Based on a systematic literature review, we noted that older men suffer from hip FFx at a FN T-score approximately 0.5-0.6 higher than older women. While the mean hip FFx FN T-score of around - 2.9 for women lies below - 2.5, the mean hip FF FN T-score of around - 2.33 for men lies above - 2.5. This is likely associated with that older male populations have a higher mean T-score than older female populations. We propose a new category of low BMD status, osteofrailia, for older Caucasian men with T-score ≤ - 2 (T-score ≤ - 2.1 for older Chinese men) who are likely to suffer from hip FFx. The group with T-score ≤ - 2 for older Caucasian men is comparable in prevalence to the group with T-score ≤ - 2.5 for older Caucasian women. However, older men in such category on average have only half the FFx risk as that of older women with osteoporotic T-score.

Keywords: T-score; Bone mineral density (BMD); Males; Osteoporosis; Reference database.


Conflict of interest statement

Declarations. Competing interests: A. G. is a shareholder of BICL and LLC and consultant to Pfizer, ICM, TrialSpark, TissueGene, Coval, Medipost, and Novartis. Other authors declare no competing interests.

Figures

Fig. 1
Fig. 1
A comparison of femoral neck (FN) and total hip (TH) T-scores of female (F) and male (M) acute hip FFx patients. A Mean FN or TH T-score of M and F patients. Data are from Wilson et al. [17], Yeo et al. [18], Vlachos et al. [19], Lee et al. [20], Gani et al. [21], Ho et al. [22], and Li et al. [23]. Except the data of Wilson et al. [17], all other six groups of data show a higher FN or TH T-score in men than in women. For the study of Wilson et al. [17], while the FN T-score was higher in women, the study cases’ LS T-score and wrist T-score were higher in men than in women. Yeo et al. [18] and Gani et al. [21] also presented TH T-score, with a similar trend as shown in this graph. Caucasian data in green color and East Asian data in pink color. B FN T-score of East Asian (EA) patients. Each dot represents the mean T-score of one study respectively [, , –27]. For the data from Lee et al. [20] and Gani et al. [21], M and F patients are presented separately. Mixed gender patient data are from Hey et al. [24], Li et al. [25], Kanno et al. [26], and Xu et al. [27]. C TH T-score of EA patients. Each dot represents the mean T-score of one study respectively [–, –29]. For the data from Gani et al. [21], Ho et al. [22], and Li et al. [23], M and F patients are presented separately. Mixed gender patient data are from Hey et al. [24], Xu et al. [27], Cha et al. [28], and Yamamoto et al. [29]. D FN T-score of European (EU) patients. Each dot represents the mean T-score of one study respectively [, , –32]. For the data from Yeo et al. [18] and Vlachos et al. [19], M and F patients are presented separately. Mixed gender patient data are from Heetveld et al. [30], Valentini et al. [31], and Amar et al. [32]. E TH T-score of EU patients. Each dot represents the mean T-score of one study respectively [18, 32, 33]. For the data from Yeo et al. [18], M and F patients are presented separately. Mixed gender patient data are from Amar et al. [32] and Ganhão et al. [33]. In B, C, D, E, M patients: blue dots; mixed gender patients: gray dots; F patients: pink dots. Bars: mean values, with each study giving an equal weight (i.e., sample size for each study was not weighted). FFx, fragility fracture
Fig. 2
Fig. 2
Older men sustain FFx at higher BMDs than older women. Y-axis is the mean BMD of patients when FFx occurred. A Femoral neck (FN) BMD for male and female patients with acute FFx. Data from Vlachos et al. [19], Gani et al. [21], Wong et al. [34], and Olszewski et al. [35]. B Total hip (TH) BMD for male and female patients with acute hip FFx. Data from Gani et al. [21], Ho et al. [22], Li et al. [23], Rathbun et al. [36] (> 90% the study cases being USA Caucasians), and Salimi et al. [37] (USA data, measures by both Lunar DXA scanner and Hologic DXA scanner provided). In A and B East Asian data in pink color, and other data (from Europe, Australia, and USA) are in blue. C A random selection of two reports with the data of Mackey et al. [38] with patients of various clinical FFx (Hologic DXA scanner) and Domiciano et al. [39] with patients of various non-vertebral clinical FFx (Hologic DXA scanner). FFx, fragility fracture
Fig. 3
Fig. 3
Males who suffered hip FFx during follow-up have a higher baseline femoral neck (FN) T-score than those of females who suffered hip FFx during follow-up. Data from MrOS and MsOS Hong Kong studies. It can be seen that the male–female difference in baseline FN T-score for subjects with hip FFx during follow-up parallels the male–female difference for the subjects without hip FFx during follow-up (lines with arrow at both ends). Males’ T-score was significantly higher than that of females both for the no FFx groups and the FFx groups (both, p < 0.0001). FFx, fragility fracture
Fig. 4
Fig. 4
The femoral neck (FN) BMD distribution (Hologic DXA scanner) of US Caucasians and thresholds to define osteoporosis. The BMD distribution data of both young population and older population (≥ 50 years) are from Looker et al. [2]. The mean FN T-score among US older Caucasian community men was − 1.241, the mean FN T-score among US older Caucasian community women is − 1.717, and the T-score difference is 0.476. Red arrow: the T-score to define osteoporosis in women (prevalence = 23.4%). Blue arrow: the T-score to define osteoporosis in men (prevalence = 10.8%). T-score =  − 2.91 and T-score =  − 2.33 are the approximately estimated mean hip fracture T-scores for women and men respectively (estimated based on the mean of data of Yeo et al. [18] and Vlachos et al. [19], which is also consistent with the data of Wong et al. [34])
Fig. 5
Fig. 5
Different BMD thresholds to predict hip FFx during follow-up. Data from MrOS and MsOS Hong Kong studies. Sixty-nine hip FFX were recorded for women and 63 hip FFx were recorded for men. Each dot represents a case with hip FFx. Y-axis: femoral neck (FN) BMD measured at baseline (A) and at year 2 follow-up (B). X-axis: FFx cases ranked from the lowest BMD to highest BMD. Single blue arrow: BMD values corresponding to T-score threshold of − 2.7 for osteoporosis in Chinese men and women, double blue arrows: BMD value corresponding to T-score threshold of − 2.1. This graph shows baseline BMD measurement and year 2 BMD measurement show similar patterns with association of hip FFx (mitigating the possibility of major measurement imprecision errors). F, female; M, male; FFx, fragility fracture
Fig. 6
Fig. 6
Correlation between femoral neck (FN) T-score and total hip (TH) T-score. A Mean hip FFx FN and TH T-scores data from Yeo et al. [18] (Caucasian men and women) and Gani et al. [21] (Singaporean men and women). B Italian Caucasian women data (age, 73.6 ± 6.1 years) from Wang et al. [59], with Pearson r of 0.801 (p < 0.0001). C Chinese women data (age, 74.1 ± 6.14 years) from Wang et al. [60], with Pearson r of 0.840 (p < 0.0001). D Data from Viapiana et al. [61] with a total of 450 osteoporotic Italian older men (age, 67.5 ± 9.6 years)
Fig. 7
Fig. 7
Male patients suffer from FFx at a higher lumbar spine (LS) T-score and BMD than female patients. A LS T-score data with the studies listed in Fig. 1A (hip FFx), the data of Li et al. [23] with clinical vertebral FFx (Li VFx), and the data of Wong et al. [34] with patients of various FFx. East Asian data in pink color. B LS BMD data of Li et al. [23] with clinical vertebral FFx, and a random selection of two reports with the data of Mackey et al. [38] reporting patients of various FFx and Domiciano et al. [39] reporting patients of non-vertebral FFx. C BMD data of Deng et al. [65] on radiographic vertebral FFx of community subjects who had or did not have radiographic grade 3 vertebral FFx. Grade 0: no FFx; grade 3: FFx with > 40% vertebral height loss. FFx, fragility fracture

Similar articles

Cited by

References

    1. World Health Organization. Assessment of fracture risk and its application to screening for postmenopausal osteoporosis : report of a WHO study group [meeting held in Rome from 22 to 25 June 1992]. 1994. Available online: https://apps.who.int/iris/handle/10665/39142. Accessed 20 Aug 2023. - PubMed
    1. Looker AC, Wahner HW, Dunn WL, Calvo MS, Harris TB, Heyse SP, Johnston CC Jr, Lindsay R. Updated data on proximal femur bone mineral levels of US adults. Osteoporos Int. 1998;8:468–89. - PubMed
    1. Wáng YXJ. Estimation of osteoporosis prevalence among a population is reasonable only after the concerned reference bone mineral density database and cutpoint T-score have been validated. Osteoporos Int. 2023;34:417–8. - PubMed
    1. Kanis JA, Johnell O, Oden A, De Laet C, Mellstrom D. Diagnosis of osteoporosis and fracture threshold in men. Calcif Tissue Int. 2001;69:218–21. - PubMed
    1. de Laet CE, van der Klift M, Hofman A, Pols HA. Osteoporosis in men and women: a story about bone mineral density thresholds and hip fracture risk. J Bone Miner Res. 2002;17:2231–6. - PubMed

Publication types

LinkOut - more resources